Conceptual Design of Nuclear Systems for
Hydrogen Production
by
Katherine J. Hohnholt
Submitted to the Department of Nuclear Science and Engineering
in partial fulfillment of the requirements for the degree of
Bachelor of Science in Nuclear Engineering
at the
MASSACHUSETTS INSTITUTE OF TECHNOLOGY
June 2006
@
Katherine J. Hohnholt, MMVI. All rights reserved.
The author hereby grants to MIT permission to reproduce and
distribute publicly paper and electronic copies of this thesis document
in whole or in part.
rl/
d-Author ...
/
...
.. ..
...
...
...
Departm
,f Nuclear Science and Engineering
May 12, 2006
Certified by ...
... J ..3 .'.::...
...
CertifiedMujid
Kazimi
Professor of Nuclear Engineering and Mechanical Engineering
Thesis Supervisor
Accepted by...
...
avid G. ory
Chairman, NSE Committee for Undergraduate Students
Conceptual Design of Nuclear Systems for Hydrogen
Production
by
Katherine J. Hohnholt
Submitted to the Department of Nuclear Science and Engineering on May 12, 2006, in partial fulfillment of the
requirements for the degree of Bachelor of Science in Nuclear Engineering
Abstract
Demand for hydrogen in the transportation energy sector is expected to keep growing in the coming decades; in the short term for refining heavy oils and in the long term for powering fuel cells. However, hydrogen cannot be harvested from natural sources like other fuels, it must be industrially produced. In the United States, the vast majority of hydrogen is produced today by reforming methane, a carbon-based fuel. Due to environmental and fuel source concerns, non-carbon alternatives for producing hydro-gen from water are being explored using different combinations of thermal, chemical, and electrical energy. This work explores some of the non-carbon alternatives, specif-ically using a nuclear reactor for providing heat and electricity for high temperature steam electrolysis and a hybrid electrolysis-chemical sulfur cycle. Also addressed is the sensitivity of production and efficiency of these cycles to process conditions. For a desired hydrogen distribution pressure of 3MPa, high system pressures increase the efficiency of high temperature steam electrolysis because of the decreased post-cycle compression energy requirements. High system pressures for the hybrid sulfur cy-cle, however, decrease the equilibrium thermal acid decomposition necessary to the
process. High temperature steam electrolysis may also be used to provide variable
hydrogen production when coupled with an electricity generation system. Increased hydrogen production decreases the efficiency of the electricity production, because of the high enthalpy removed from the reactor system. Both approaches are also analyzed for their sensitivity to incomplete reactions within the process loop.
Thesis Supervisor: Mujid Kazimi
Acknowledgments
Primarily, I would like to thank my advisor Professor Kazimi. He has led me patiently through this project for many years now. Also thanks to Dr. Bilge Yildiz, for getting me into this in the first place. Her patience and perseverance are incredible, and I thank her for investing so much in me.
Additionally, I would like to thank the entire nuclear engineering department. The staff, professors, and students are truly world class and I appreciate all of them tremendously. Both my education and my experience here at MIT have been out-standing and inspiring.
My deepest love and gratitude to my family: to Mom for teaching me how to dream and to Dad for keeping me grounded; to Mimi for teaching me to be meticulous and thorough and to Papa for showing me how to be calm, strong, and steady; to Daddy for his unconditional love and to Martha for telling me to fight back.
Contents
Contents
List of Figures
List of Tables
1 Introduction
2 Non-Carbon Hydrogen Production Systems 2.1 Introduction... 2.2 2.3 2.4 2.5 2.6 Thermal Production . . . . Electrical Production ... Hybrids ... 2.4.1 Thermo-Chemical ... 2.4.2 Thermo-Electrical ... 2.4.3 Thermo-Electro-Chemical Materials Concerns . . . . Electrolysis Cells . ...
3 High Temperature Steam Electrolysis 3.1 Electrolysis System ... 3.1.1 Electrolysis Unit ... 3.1.2 Heat Recovery... 17 ... 17 . . 18 . . 19 ... 21 . . 21 . . 22 . . 23 . . 24 . . 24 . . . . 28 . . . . . . . . . . . . . . . . . . ...
3.1.3 Compressors ... 31
3.2 Component Optimization ... 32
3.2.1 Pressure Effects on Component Design . ... 32
3.3 System Optimization ... 32
3.3.1 Interface with Reactor ... 32
3.3.2 Pressure Effects on System Design and Efficiency ... . 34
3.4 M odel Corrections ... 36
4 Hybrid Sulfur Cycle 39 4.1 Process Design ... 39
4.1.1 Basic Design ... ... . . . . ... ... . 39
4.1.2 Additional Electrolysis Design . ... 41
4.2 Component Design ... 42
4.2.1 Primary Electrolyzer ... 42
4.2.2 Sulfur Trioxide Secondary Electrolyzer . ... 43
4.3 System Optimization ... 44
4.3.1 Thermal Acid Decomposition . ... 44
5 Load Requirements 51 5.1 Introduction ... 51
5.2 Hydrogen / Electricity Production ... . 53
5.2.1 Cycle Efficiency ... 54
6 Incomplete Decomposition 57 6.1 Introduction ... 57
6.2 Kinetics of Decomposition Reactions . ... 58
6.2.1 Catalysts .. .. ... . ... .. ... .. 58
6.2.2 Thermal Decomposition . ... .. 58
6.2.3 Electrochemical Decomposition . ... 59
CONTENTS 9
6.3.1 High Temperature Steam Electrolysis . ... 59
6.3.2 Hybrid Sulfur Cycle ... .. ... 59
7 Conclusion 63 7.1 Non-Carbon Hydrogen Production Systems . ... 63
7.2 Load Dependant Capabilities ... ... 64
7.3 Incomplete Decomposition Effects ... . 64
7.4 Future Work ... ... 65
A Abbreviations and Symbols 67
B Hybrid Sulfur Optimization 69
C HTSE Load Calculations 71
List of Figures
2-1 Gibbs free energy ... 19
2-2 Effect of increasing current density on voltage requirement ... 20
3-1 Electrolysis cell for water decomposition . ... 28
3-2 Direct input of thermal energy to electrolysis system . ... 29
3-3 Diagram of electrolysis system with primary heat recuperation . . .. 30
3-4 Total hydrogen production efficiency and hydrogen production at vary-ing system pressures ... 36
4-1 Conceptual design of hybrid sulfur cycle . ... 40
4-2 Boiling temperatures of chemical compounds in Hybrid Sulfur Cycle . 41 4-3 Conceptual design of hybrid sulfur cycle with dual electrolyzers . . . 42
4-4 Primary electrolysis cell for hybrid sulfur cycle ... . . . ... . 43
4-5 Conceptual design of sulfur dioxide decomposition electrolysis cell . . 44
4-6 Mole fraction of chemical components in the decomposition reaction as a function of temperature, at 90% H2S04 inlet concentration, with volume and pressure (7 bar) held constant . ... . . .45
4-7 Mole fraction of sulfur dioxide in the decomposition reaction as a func-tion of temperature and acid inlet concentrafunc-tion: assuming constant volume and pressure (1 bar) ... 46
4-8 Mole fraction of sulfur dioxide in the decomposition reaction as a func-tion of temperature and acid inlet concentrafunc-tion, assuming constant
volume and pressure ... 47
4-9 Mole fraction of sulfur dioxide in the decomposition reaction as a func-tion of temperature, acid inlet concentrafunc-tion, and oxygen content, as-suming constant volume and pressure (1 bar) . ... 48 4-10 Mole fraction of sulfur dioxide in the decomposition reaction as a
func-tion of temperature, decomposer pressure, oxygen content, assuming constant volume and pressure ... 49
5-1 Electricity production broken into hydrogen process requirement and electricity distribution potential as a function of thermal energy ex-traction . . . .. . 53 5-2 Electrical and process efficiencies and hydrogen production as a
List of Tables
3.1 Sensitivity of hydrogen production efficiency to changes in net electrical
Chapter 1
Introduction
With rising oil prices and concerns about dependence on foreign oil, America has begun to look toward alternative sources of transportation fuel. One promising al-ternative is hydrogen. However, one drawback of hydrogen is that it cannot be har-vested from natural sources like other fuels. Hydrogen must instead be produced. Currently, the majority of hydrogen produced in the United States is produced by reforming methane, a carbon-based fuel [1][2]. However, due to environmental and fuel source concerns, non-carbon alternatives are being explored. Other methods of producing hydrogen involve using different combinations of thermal, chemical, and electrical energy to split water into hydrogen and oxygen.
This thesis will explore these non-carbon alternatives; giving background on the different methods of production, the materials concerns for hydrogen production, and a basic description of the electrolysis cells that are used to provide electrical energy to some hydrogen production cycles. The high temperature steam electrolysis and hybrid sulfur cycle will be examined in detail. To fully analyze high temperature steam electrolysis, the electrolysis unit, the heat recovery in the system, and the system compression must all be looked at in order to determine optimum component and system parameters. The hybrid sulfur cycle is a more complicated process, using the chemical energy from sulfur based compounds to assist in decomposing water
into hydrogen and oxygen. Important aspects of the design include the materials' tolerance for the chemical atmosphere, and the methods of decomposing the sulfur compounds in the cycle.
In order to avoid system problems such as blackouts, the electricity grid maintains a higher electricity supply than is demanded at any time. This leads to periods of time where there is a large amount of excess electricity generation. In these scenarios, hydrogen can be used as an energy storage device, increasing distribution efficiency by using electricity in times of low demand. The high temperature steam electrolysis process is analyzed from this viewpoint, examining the effect of varying production
rates and efficiencies depending on fluctuating electricity availability.
For any realistic system design, both the speed of reactions and the relative com-pletion of those reactions must be considered. This sensitivity is important in different ways depending upon which process is being considered.
Chapter 2
Non-Carbon Hydrogen Production
Systems
2.1
Introduction
Hydrogen is currently produced worldwide for industrial applications. The United States hydrogen industry produces 9 million tons of hydrogen per year, 95% of which is produced using steam methane reforming. Most of this hydrogen production is used in chemical production, petroleum refining, metals treating, and electrical applications[1]. Hydrogen is touted as a clean, environmentally friendly alternative to current hydrocarbon fuels. However, since 95% of hydrogen is produced from hy-drocarbons, alternative production techniques using non-carbon production sources have generated interest.
Hydrogen can be produced in a number of ways. Steam methane reforming men-tioned above is a process that converts methane into hydrogen and carbon monoxide, as shown in Reaction (2.1)
Additional hydrogen can also be extracted through this process by using the car-bon monoxide in the water shift reaction, shown in Reaction (2.2).
CO + H
20
--+ CO2 + H2T
350'C
(2.2)
Any method using hydrocarbons, however, has the potential of releasing large amounts of global warming gases into the air, primarily carbon dioxide, but also air pollutants such as sulfur and nitrogen compounds from impurities in the hydrocar-bons.
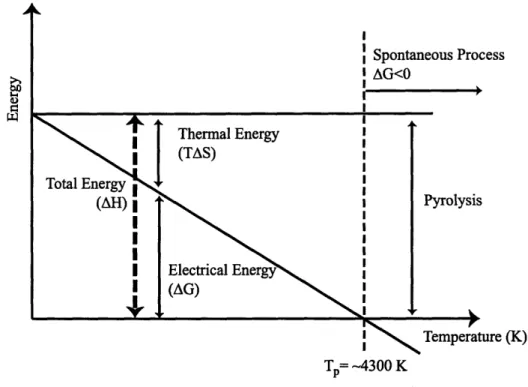
There are many alternative, non-carbon hydrogen production systems. Hydrogen can be produced by splitting water into hydrogen and oxygen. Providing the energy to do this can be done in three ways; thermally, chemically, and electrically. These energies can be used independently, but are more commonly used in conjunction with each other. Figure 2-1 shows the thermal and electrical energy requirements as a function of temperature.
Once chemical compounds are added to the process, the electric and thermal requirements can be substantially changed. By providing different pathways for com-pletion, additional chemical components can decrease the activation energy, thus decreasing the total energy requirement for the process.
2.2
Thermal Production
Water can be split using pure thermal energy. This process is called pyrolysis and the pyrolysis temperature of water is at . 40000C. As shown in Figure 2-1, when the temperature rises above - 40000C, Gibbs free energy becomes less than zero and the reaction becomes spontaneous. Splitting water using pyrolysis is generally seen as unfeasible because of the extremely high temperatures required.
2.3. ELECTRICAL PRODUCTION
>1 U ess are (K) Tp= -4300 KFigure 2-1: Gibbs free energy
2.3
Electrical Production
Pure electrolysis of water is the process of running a current through pure water, which provides the energy necessary to separate the water into hydrogen and oxy-gen. For a water electrolysis reaction at room temperature and atmospheric pressure, the theoretical minimum potential across the electrolyzer (the Nernst potential) is -1.23V, and the production will be proportional to the current. This is shown as Reaction (2.3) (calculated at 1 atm and 298K).
1
H20 + e --+ H2 + -02 Ec e, = -1.23V (2.3)
2
This theoretical minimum is not observable in a real cell though, as once any current is applied to the cell, gradients are created. The larger these gradients are, the more the cell can produce, however the cell will also experience larger losses. There
are also many factors within a particular cell that can change the Nernst potential in that cell. These factors, called overpotentials, include the partial pressures of the reactants and products within the cell, and the material properties of the cell. The important material properties are the exchange current density (related to the activation/kinetic losses within the electrodes), the limiting current density (related to the diffusion losses within the electrodes), and the ionic diffusion constant (related to the ionic transport losses through the electrolyte). The governing equations of these effects in the cell are given in Section 2.6. The effects of these overpotentials on the cell voltage required is shown in Figure 2-2.
0 Cd 0 Cd o f ration ential Current Density
Figure 2-2: Effect of increasing current density on voltage requirement
The region of activation overpotential is the level of current through the cell where the exchange current density dominates the losses in the cell, the region of ohmic overpotential is the level of current through the cell where the ionic transport losses and electrical resistance dominate in the cell, and the region of concentration overpotential is the level of current through the cell where the limiting current density
2.4. HYBRIDS
dominates the losses in the cell. As either the magnitude of the Nernst potential (due to changes in cell conditions) or the current through the cell increases, the voltage required, and thus the total energy used for production, also increases. Maximizing cell performance by decreasing the inefficiency of water electrolysis is the subject of ongoing research, including development of new electrolysis materials that will decrease the overpotentials in the cells [3] [4].
2.4
Hybrids
2.4.1
Thermo-Chemical
It may be more attractive to use a variety of energy sources instead of just one to pro-duce hydrogen. This allows the cycle more flexibility to be optimized for production and efficiency. There have been over 180 different thermochemical water-splitting pro-cesses identified [5]. A sample of the propro-cesses that were identified as most promising, and thereby have been most investigated among these production techniques, will be described here.
The sulfur iodine process is a thermochemical cycle that uses sulfur and iodine compounds to create a chemical cycle that splits water into hydrogen and oxygen, while recycling the other species back through the system. The three reactions used in the cycle are shown below.
2H20
+SO
2 + 12 --2HI +
H2S04 1000C(2.4)
1
H
2S0
4-- S02
+
H
20 + -0
2850
0C
(2.5)
2
2HI -+ I2
+
H2450
0C
(2.6)In Reaction (2.4) iodine and sulfur-dioxide are added to water to produce sulfuric acid and hydrogen iodide. The species are then separated and decomposed. Reaction
(2.5) shows the decomposition of sulfuric acid down into sulfur dioxide, water, and oxygen. Reaction (2.6) shows the decomposition of hydrogen iodide to iodine and hydrogen. Once the decomposition finishes, the oxygen and hydrogen are removed, and all other species are returned to Reaction (2.4). The sulfur iodine process has been researched extensively, and lab scale experiments have been conducted [6] [7].
There are also a few variants of the Calcium-Bromine type cycles, an example is shown below (UT-3 cycle). These cycles rely on calcium, bromine, and iron to chemically separate the water.
1 Br2 + CaO --
ý
CaBr2 +-02
6000C (2.7) 2 CaBr2 + H20 -+ CaO + 2HBr 7500C (2.8) Fe304 + 8HBr -+ Br2 + 3FeBr2 + 4H20 3000C (2.9)3FeBr
2+ 4H
20
-- Fe3O
4+ 6HBr +
H2600
0C
(2.10)
The basic process is to split water and produce oxygen in Reactions (2.7) and (2.8), regenerate bromine in Reaction (2.9), and produce hydrogen in Reaction (2.10). Ongoing research into this process is also being conducted [8].
2.4.2
Thermo-Electrical
High Temperature Steam Electrolysis (HTSE) is identical to regular electrolysis, ex-cept that the electrolytic cell is kept at a much higher temperature, around 9000C. By running at this higher temperature, a portion of the Gibbs free energy is provided thermally, making the Nernst potential for the cell, and thus the voltage required for production, much lower. The process for HTSE is shown in Reaction (2.11) (calcu-lated for 1 atm).
1
H20 + e --- H2 + 102 Ecel = -0.933V at 9000C (2.11)
2
2.4. HYBRIDS
HTSE is also the subject of active research, from its potential in a solid oxide electrolytic system [9] [10] to electrolyzer design [11], including system level modelling
[12][13]. The specifics of HTSE will be explored more in Chapter 3.
2.4.3
Thermo-Electro-Chemical
Some cycles can even take advantage of all three energy types; thermal, electrical, and chemical. One example of this is the Hybrid Sulfur cycle. This cycle uses sulfur compounds as the chemical constants throughout the steps, and utilizes both an elec-trolysis step (Reaction (2.12)) and a thermal decomposition step (Reaction (2.13)). There is ongoing research on this process, including preliminary lab scale experiments [14] [15][16].
SO2
+
2H20+
e-+
H2SO4 + H2Eole
=-0.17V
(2.12)1
H
2S04 - S02 + H
20 + -0
2850
0C
(2.13)
2
One variant of this cycle replace Reaction (2.13) with two reactions, the first being a thermal decomposition(Reaction (2.13a)) at a much lower temperature, and the second being an electrolytic step to complete decomposition (Reaction (2.13b)).
The Hybrid sulfur cycle and this variant will be discussed at length in Chapter 4.
S02
+
2H20
+e --+
H2S04+
H2E
1e, = -0.17Vat STP
(2.12)
H2S04 --+ S03 + H20 >
450
0C
(2.13a)
1
SO3
+ H20+ e --
S02+ H20 +
-O2
Ec
11 =-0.15V at
6000C
(2.13b) 2There is additional research into sulfur compound separation methods using inor-ganic membranes [17] [18].
Other thermal electrochemical hydrogen production cycles that have been re-searched are Copper-Chlorine, Copper-Sulfur, Zinc-Sulfur, and Potassium-Bismuth [19]. These cycles all use processes that take advantage of a combination of chemical, electrical, and thermal energy in unique ways.
2.5
Materials Concerns
There are significant materials concerns for each of the cycles, including high temper-ature, strength, and corrosion [20]. Materials must be tested for stability in different chemical environments, minimizing not only corrosion, but also adverse chemical in-teraction with that environment. In addition, for cycles with an electrolytic step, the choice of electrodes and electrolyte is very important not only from a stability
standpoint, but also to from a performance perspective.
There is ongoing research being performed for both system and electrolysis ma-terials. In order to choose appropriate materials for the sulfur environment in the hybrid sulfur cycle, ceramic [21] and silicon carbide [22] materials are being devel-oped. Electrodes, evolving oxygen [23] and hydrogen [24] and the electrolyte within the cell [25] are all crucial to cell performance, stability, and production. There is also system level work on the potential for high temperature transfer into the cycle and its effect on materials, heat exchangers, and loop dynamics [26].
2.6
Electrolysis Cells
Basic electrochemical cells are designed to allow oxidation-reduction reactions to oc-cur, and by placing two electrodes in solution, either draw or provide a current through the cell setup.
There are many types of electrochemical cells, developed mainly for use in fuel cells. One type of electrochemical cell that has been found suitable as an electrolysis
2.6. ELECTROLYSIS CELLS
cell is the solid oxide electrolysis cell (SOEC). An example of a SOEC electrolyzer will be shown in section 3.1.1.
Another common electrochemical cell is the proton exchange membrane (PEM) cell. This cell works by conducting protons instead of ions through it's electrolyte.
Ongoing work for utilizing PEM cells in electrolysis is being conducted [27][28]. The physical principles governing electrochemical cells are primarily dependant upon the operating conditions of the cell and the material characteristics of that cell. The governing equations given below use water electrolysis to demonstrate the effect of reactants and products on the electrochemical cell operation.
The theoretical minimum voltage is calculated as a function of temperature and pressure as given in Equation (2.14). The second term gives the partial pressure dependence for Vin and is independent of Gibb's free energy, AGo. However, the first term must be found as a function of temperature for the given reaction. This expression is the Nernst potential for the cell as a function of temperature and partial pressures of the species.
-AG
-AGO
RT
P
2
Vmin
= -
nF=
In
(2.14)
neF
neF PH2-0
2 (2.14)The exchange current density, io, is related to the activation losses intrinsic to electrochemical reactions that occur within the electrodes, and is a function of the temperature and species partial pressures, as given in Equation (2.15). Experimental data showing a relation between the cell temperature and exchange current density [29] can be compared with known ranges of y and Eact to produce a close fit.
io
=
~electrodePotal
)
(2.15)The exchange current density is used to determine the final current through the cell.
flow channels and porous electrodes. The binary diffusivity of the gases in the cell is dependant upon the gas properties, pressure, and temperature within the cell. The binary diffusivity of gas A into gas B, DAB, is related to the gas properties and temperatures within the cell as given in Equation (2.16) [30].
DAB = -1.8583 x 10
(1
1/2 (2.16)7 MA + i PUTrBQAB
The limiting current density, il, is related to the diffusion losses intrinsic to move-ment of reactants for electrochemical reactions that occur within the electrodes, and is a function of the temperature and the porous diffusivity of the reactants and prod-ucts. The limiting current density is related to the diffusivity, reactant concentrations, and temperatures within the cell. The limiting current is defined in Equation (2.17).
S= nFDCreac,bulk
(2.17)
6electrode
All of these components come together to describe the losses (called the overpoten-tials) in the cell. As the applied voltage within the cell increases, the overpotentials in the cell increase due to the increasing current through the cell as shown in Equation (2.18).
Vapplied = Vmin - 77activation - 77diffusion - 7ohmic . . .
(2.18)
This means that increasing production in the cell increases the losses. The op-timum level of compromise between maximum production and maximum efficiency must be decided within each system. More detail about how the current is calculated and the affects on hydrogen production is provided in Section 6.2.3.
Chapter 3
High Temperature Steam
Electrolysis
3.1
Electrolysis System
3.1.1
Electrolysis Unit
Solid Oxide Electrolysis Cell
The electrolysis unit for HTSE is generally modeled using a solid oxide electrolysis cell (SOEC). A SOEC cell is composed of an oxide ion-conducting electrolyte surrounded by porous electrodes. An example of the cell configuration is shown in Figure 3-1.
The figure shows the two independent flow paths through the cell, the oxygen outlet channel (usually containing a sweep gas), and the water inlet and hydrogen production channel. The cathode provides electrons to drive the decomposition of water into hydrogen and oxygen ions. The ions are then allowed to move through the electrolyte, while the hydrogen is pushed out of the cell. Once the oxygen ions move through the electrolyte, oxygen begins to evolve on the anode, giving off extra electrons that are driven back through the cell toward the cathode by the voltage across the cell.
-- - - -
----
-~
I
I
I 0 DCI
i 2e"
I
H2q9 I i H2 ?I I-Figure 3-1: Electrolysis cell for water decomposition
3.1.2
Heat Recovery
Direct Feed
The simplest way to provide the necessary thermal energy for the electrolysis loop is to provide it directly from a single heat exchanger, with the reactor as the heat source, as shown in Figure 3-2. This system is simple, providing all the necessary increase in temperature from the reactor.
The principle disadvantage of this setup, however, is that this would require the hot loop temperature to be greater than the temperature desired in the electrolysis loop. Since the electrolysis loop is most efficient at very high temperatures, this system would only be feasible with a very high temperature thermal energy source. In addition, a tremendous amount of energy would be lost in the exiting gas streams (hydrogen and oxygen), due to their high temperature.
3.1. ELECTROLYSIS SYSTEM
W-IwrAv-r~rrv,m
n
Water
Figure 3-2: Direct input of thermal energy to electrolysis system
Dual Recuperators
By adding recuperating heat exchangers, we can tap into the thermal energy of the exiting hydrogen and oxygen streams, and avoid having to supply some heat from the reactor. An example of such a system is shown in Figure 3-3.
Both gas streams can provide high temperature thermal energy to heat the in-coming steam up to a much higher temperature prior to entering the electrolysis unit. However, because of non-ideal heat transfer, both from heat losses in the heat exchanger, and energy losses at flow restrictions, the incoming steam will not be completely raised to the temperature necessary. In order to complete the last heating stage, a final electrical heater is used, as shown also shown in Figure 3-3.
Another important consideration is the amount of thermal energy that the gas streams possess. Since neither hydrogen nor oxygen will undergo a phase change in the range of temperatures of interest, the gas streams do not have enough enthalpy to overcome the heat of vaporization of water. Therefore the reactor must provide at least enough thermal energy to preheat the water through its phase change, to a quality of 1, i.e. to saturated steam conditions.
Figure 3-3: Diagram of electrolysis system with primary heat recuperation
Preheaters
Even after using the recuperators to heat the steam, there is still thermal energy available in the gas streams. The streams temperatures are now too low to contribute their thermal energy to heating the steam further, but they can serve to preheat the water before it enters the main boiler. By adding two preheaters the gas streams can be used to heat the incoming water.
Additional Recuperators
By adding additional recuperating heat exchangers, even more thermal energy can be recuperated, leading to increased efficiencies. However, with every heat exchanger added, there are diminishing returns on the increment in efficiency, as well as increas-ing effects on the capital costs of the system.
3.1. ELECTROLYSIS SYSTEM
3.1.3
Compressors
There are many ways to distribute hydrogen, the most common forms are as a liqui-fied gas or a compressed gas. Because of the large energy requirements of liquification, the effects of compression on the system were examined. Existing hydrogen pipelines compress to - 7MPa for distribution. The production facility must compress hy-drogen to the distribution pressure in order to send it through these distribution networks. Two ways of compressing this hydrogen are to compress the water before it enters the electrolysis system (pre-compression), or to compress the hydrogen once
it has been separated (post-compression).
Pre-Compression
Compressing a liquid, such as water, is much less energy intensive then compressing a gas, such as hydrogen. Therefore precompressing the water before it enters the electrolysis system has certain energy advantages. Compressing water from 1 atm to 7 MPa requires a pumping power of approximately 7.5 kilojoules per kg water, or approximately 0.8 kilojoules per kg hydrogen. In addition to the energy advantage, increased pressure in the electrolysis system will also serve to decrease the volume of the components (pipes, heat exchangers, electrolysis cell, etc.) for the same flow rate.
Post-Compression
The disadvantage to the pre-compression idea, however, is that the pressure in the system will change the operating conditions, energy requirements, and material re-quirements in the electrolysis system. These effects are described in section 3.2.1. Compressing the hydrogen after it exits the electrolysis cell is a viable alternative, but requires a larger compression energy of approximately 48 kilojoules per kg hy-drogen for compression from 1 atm to 7 MPa.
3.2
Component Optimization
3.2.1
Pressure Effects on Component Design
By increasing the pressure within the system, there are important effects for the com-ponents operation within the system. First of all, the electrolysis cell properties will change because the Gibbs free energy of the reaction has increased due to the higher system pressure. Therefore the magnitude of the voltage required in the electroly-sis cell increases. This raises the total energy required for the electrolyelectroly-sis process, decreasing the system's efficiency.
This efficiency loss can be offset, however due to the positive relation between pressure and efficiency in the heat exchangers and compressor. Within the heat ex-changers the higher pressure increases the heat capacity of the fluids being fed through the exchangers, meaning that the fluids have more energy per mol to contribute. Ad-ditionally, since the fluids are also compressed, there are more mols per volume, and thus more energy per volume available for exchange.
The system pressure is very important for system compression, because where the compression occurs changes the type of compression that is needed. If the total system pressure is low, then the product gas must be compressed after exit before it is fed into the distribution system. Gas compression is very energy intensive, requiring a qualified compressor. However, if the system is run at a higher pressure, the water must be pumped into the system. Pumping this liquid is much less energy intensive, as discussed in the section on compression, requiring only a simple water pump.
3.3
System Optimization
3.3.1
Interface with Reactor
The proposed system set up receives all of its thermal and electrical energy require-ment from some sort of reactor. For that thermal requirerequire-ment, it is important to
3.3. SYSTEM OPTIMIZATION
consider where the thermal energy will be drawn from the power cycle. There are two main ways to divert this thermal energy, both illustrated in Figure 3.3.1. Draw-ing off any thermal energy will necessarily decrease the efficiency of the reactor power system, but its effect can be minimized by placing the heat exchanger after the power cycle, prior to the coolants entrance back to the reactor as illustrated in Figure 3-4(a). This way the maximum temperature will still be at the entrance to the power cycle turbines, delivering maximum efficiency through them, however this is only feasible it the temperature is still high enough for the thermal requirements of the HTSE sys-tem. This fact makes HTSE most feasible with a higher temperature reactor, where the temperature requirements of an additional electrolysis system would not be so
close to the operating temperatures of the reactor.
(a) High efficiency configuration (b) Split flow configuration
Maximizing the efficiency of the power cycle is important because the efficiency of HTSE is almost directly dependant upon the electrical efficiency of the reactor. This is because hydrogen production is proportional to the current provided in the electrolysis cell. Therefore an optimum reactor for this application would have very high base efficiency. The thermal energy drawn off of the reactor system will decrease this efficiency, but with a high enough initial efficiency, this drop should be acceptable. The reactor coolant temperatures have to be above the boiling temperature of the water in the electrolysis system. This means that is the HTSE is running at low pressure, even water cooled reactors can supply sufficient heat. However for these lower temperatures it is necessary to send the maximum temperature into the
HTSE system. This split flow type system is illustrated in Figure 3-4(b). It is very important to note though that this process is directly taking away thermal power from the reactor system, that would have instead gone to power conversion. Another benefit of the split flow system is the ability to regulate flow rates very easily. This ability is advantageous if adjustable production rates are desired (discussed in Chapter
5).
3.3.2
Pressure Effects on System Design and Efficiency
As discussed above, there are important energy requirement effects for the choice of system pressure. Increasing pressure increases the energy required in the electrolysis cell, but decreases the energy required for pumping and makes the heat exchangers more efficient. There is also an overall effect on system design to consider when choosing the optimum operating pressure. With increased pressure, the volume of all of the components of the system can be decreased while delivering the same pro-duction rate. This results in a significant change in the capital costs of each of these components. Smaller designs equate almost directly to lower capital costs.
Normally efficiency is calculated by dividing the resulting energy (AGH2, the low
heating value (LHV) for hydrogen is used in this work) by the energy input (AGreator, the total energy produced by the reactor). This can also be defined in terms of the
thermal and electrical energy requirements
(AGthermaland
AGeiectrical)along with
the efficiency of producing the electrical requirement (?lpoerc•ade). These relations are shown in Equation (3.1). The thermal and electrical requirements are based on Gibb's free energy of the reaction (illustrated in Figure 2-1) and the efficiency of the power cycle was calculated using the modeling of Dr. Dostal [31].
AGH2,LHV AGH2,LHV (3.1)
7H2producton AGreactor - AGtherma + AGoertri3al
By including the effects of compression costs and elpowercycle
3.3. SYSTEM OPTIMIZATION
usefulness of the efficiency calculation is increased. This can be done by calculating the work required by any pumping (Wp) or compression (Wc) in the system and incorporating it into the efficiency calculation (Equation (3.2)).
AGH2,LHV (3.2)
n AGthermal + AGeectriao+Wp+W c
77powercycle
The compression and pumping work can be calculated as a function of the com-pound :properties, shown in Equation (3.5). Compressor (Trc) and pump (7rp) efficien-cies used in this work were both 85%.
- WP,ideal _ rnH2OAh (33) rq rip We - _ =hHAh (3.4)
r/c
rlc
=1 H2
T
k
PH
2
,ot
k-/k
1(3.5)
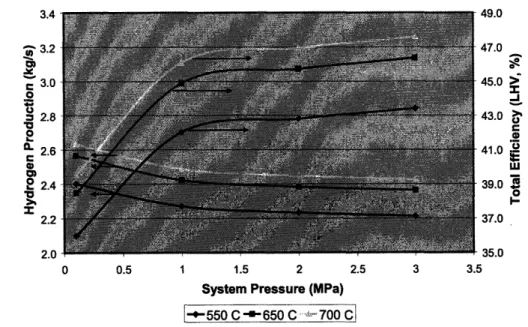
--cH 2RT k-l 1 PH, Pg , /The complete description of the mathematical method used to determine this efficiency has also been described in Yildiz [321, and the calculations are given in Appendix C. The same general correlation between electrical efficiency and production efficiency illustrated in Figure 3-4 holds for total efficiency, as the compression costs are the largest losses in the system, and the compressor is assumed to use electrical power from the plant. Figure 3-4 shows the effect of varying system pressures on the total efficiency and total hydrogen production at varying temperatures. The figure also assumes that the hydrogen is being compressed to a distribution pressure of 3MPa.
Due to the compression costs associated with the total efficiency, as the process pressure approaches the distribution pressure, efficiency is increased. However, higher system pressures also decrease the hydrogen production potential of the system be-cause of increasing energy requirements for electrolysis. Another factor that has to
49.0 47.0 45.0 > 43.0 • 41.0 * 1 39.0 . 0 I-37.0 35.0 0 0.5 1 1.5 2 2.5 3 3.5 System Pressure (MPa)
*- 550 C -650 C 700 C
Figure 3-4: Total hydrogen production efficiency and hydrogen production at varying system pressures
be considered is the capital cost involved with plant production. As the pressure is increased, the size of system components will be decreased, however, the strength of those components will also have to increase. Given all of these considerations, the operating condition of pressure is very important, but depends greatly on the relative value of efficiency versus capital cost of the system.
3.4
Model Corrections
The model that was used to calculate the efficiency and production of the system is described fully by Yildiz [32]. The power source for these calculations was further based upon the doctoral work of Dr. Dostal [31]. Dr. Dostal modeled a supercritical C02 reactor cycle. His model calculated, among other things, the efficiency of this
system. An additional heat exchanger was added to the model so that the enthalpy
3.4 -3.2 r 3.0 2.8 1-2.6 c
2
2.4
2.2 2.03.4. MODEL CORRECTIONS
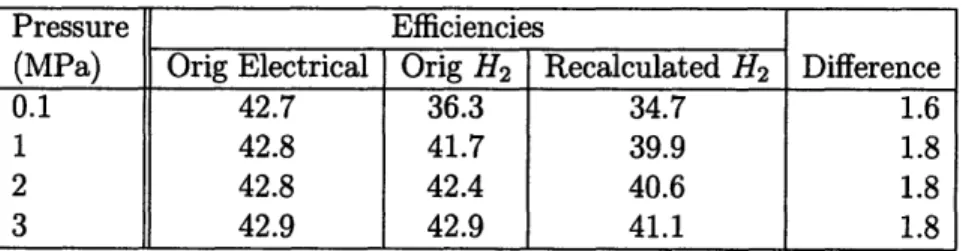
removed for the hydrogen production cycle could be included in the calculations. The efficiency reported as net efficiency in Dr. Dostal's model was used as the total net electrical production efficiency in the hydrogen production calculations. Dr. Dostal's reported net efficiency, however, did not include certain losses in the entire system, such as pipe losses, because the efficiencies were used as if they were a total net efficiency. The error from these assumptions propagates throughout the hydrogen production calculations. It has been determined that by including the additional losses, the total net efficiency is actually between 2% to 4% less than the efficiency reported. This was determined in a model, however, that does not include the addi-tional heat exchanger to model the enthalpy transferred into the hydrogen production system that necessarily lowers the electrical efficiency of the reactor system. Because the model has not been fully developed, the actual effect cannot yet be determined. In order to predict the sensitivity of the system to the efficiency change, the efficiency for hydrogen production has been recalculated. The efficiency was calculated for the different pressures and overpotentials previously used, changing only the net electrical efficiency used by 2% and the results are given in Table 3.1.
Pressure Efficiencies
(MPa) Orig Electrical Orig H2 Recalculated H2 Difference
0.1 42.7 36.3 34.7 1.6
1 42.8 41.7 39.9 1.8
2 42.8 42.4 40.6 1.8
3 42.9 42.9 41.1 1.8
Table 3.1: Sensitivity of hydrogen production efficiency to changes in net electrical efficiency
The table shows that overall efficiency increases with increasing pressure. This is because of the high energy demand from post-compression of hydrogen gas, discussed in Section 3.1.3. However, the higher pressures are more sensitive to a change in the net electrical efficiency. This is because at higher temperatures the voltage required through the electrolysis cell is higher. Combining this with lower compression energy requirements, the dominant energy demand in the system is the electrolysis cell, and
the hydrogen efficiency becomes almost directly correlated with the net electrical effi-ciency. Given this, we can safely assume that any decrease in net electrical efficiency will be closely followed by an equivalent decrease in hydrogen production efficiency.
Chapter 4
Hybrid Sulfur Cycle
4.1
Process Design
4.1.1
Basic Design
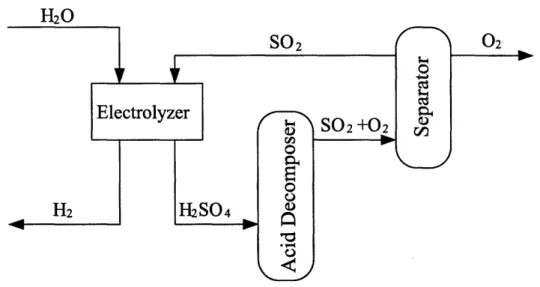
The Hybrid Sulfur Cycle is an alternative cycle that uses the sulfur compounds as transferring agents to produce hydrogen. Like all thermochemical cycles, the only chemical introduced into the system is water and the only substances extracted out are hydrogen and oxygen. This means that ideally the entirety of the sulfur within the system is recycled completely. The Hybrid Sulfur Cycle, illustrated in Figure 4-1, incorporates an electrolysis cell with this chemical process.
In its most basic form, the cycle has one electrolyzer that drives the production of hydrogen, used in Reaction (4.1).
S0
2+
2H
20 + e
-, H2S04 +
H2 1H
2S0
4-* SO2 + H
20 +
-0
2 2 E~,l = -0.17V 8500C(4.1)
(4.2)
H20
Figure 4-1: Conceptual design of hybrid sulfur cycle
After the electrolysis step, the resulting hydrogen is collected, and the sulfuric acid is recycled into the system. In order to complete Reaction (4.2), thermal energy from the reactor must be added to the acid decomposer, as shown in Figure 4-1. Once the sulfuric acid is decomposed, sulfur dioxide and oxygen exit the acid decomposer and are sent to a separator. The mixture is cooled so that the oxygen is still in gaseous form, and can be vented, and the sulfur dioxide has cooled into liquid phase, and can be separated and sent back into the electrolysis unit. Figure 4-1 shows the process diagram for a simplified version of this system.
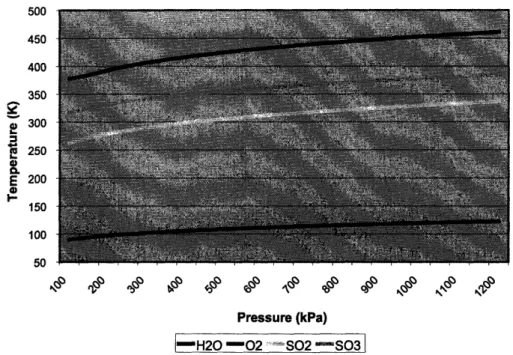
The various chemical compounds can be separated because of the difference in their boiling temperatures, illustrated in Figure 4-2. In order to separate chemical compounds, the mixture is cooled to a point where one compound condenses and the resulting liquid can be diverted from the mixture. This process is repeated until only an aqueous solution of sulfur dioxide can be sent back to the primary electrolyzer.
4.1. PROCESS DESIGN
Pressure (kPa)
-- H20 -02 .. SO.2 -S031
Figure 4-2: Boiling temperatures of chemical compounds in Hybrid Sulfur Cycle
4.1.2
Additional Electrolysis Design
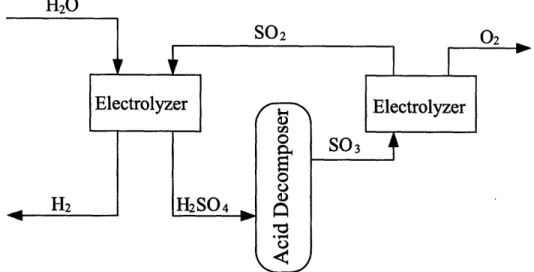
In order to overcome the extremely high temperature requirements of the acid de-composer, it has been proposed that a second electrolysis unit be added to assist in the decomposition of the sulfuric acid, shown here as Reaction (4.2b).
SO
2+ 2H
20 + e -- H
2S0
4+ H
2H
2S0
4--
*
S03
+
H
20
1SOs
+
H
20
+ e
-
SO2
+ H
20 +
20
2E.oei
=
-0.17V
(4.1)
> 4500C
(4.2a) Ecoe = -0.15V at 6000C (4.2b) As a consequence of this change, the first part of the decomposition (Reaction (4.2a)) can proceed at a much lower temperature, decomposing the sulfuric acid to sulfur trioxide. The high temperature requirement in the process is for the decompo-sition of this sulfur trioxide. By adding the electrolysis unit, the maximum requiredtemperature can be reduced to around 500 to 6000C, making the materials require-ments of the process much more feasible to provide. The electrolyzer also serves to separate the sulfur dioxide and oxygen streams. Figure 4-3 shows the process design for a simplified version of the system.
H20
SO
202
Figure 4-3: Conceptual design of hybrid sulfur cycle with dual electrolyzers
4.2
Component Design
4.2.1
Primary Electrolyzer
The primary electrolyzer used in the hybrid sulfur cycle is designed to evolve hydrogen as product and sulfuric acid for further use in the system. The basic set up is shown
in Figure 4-4.
The figure shows the flow paths in the cell. The flow path, cathode, and electrolyte work exactly the same as a basic water electrolysis cell. The difference in this cell is the chemical environment that the anode is exposed to. In the anode flow path, the oxygen combines with sulfur dioxide to produce sulfur trioxide, then further combining with water to produce the final product of sulfuric acid. As in a water electrolysis
4.2. COMPONENT DESIGN
H O I DCI
2e-I
H
20
1I
i H2
I ILI
.
-,...Figure 4-4: Primary electrolysis cell for hybrid sulfur cycle
cell, the excess electrons from the anode are driven by the voltage across the cell to the cathode to promote the water decomposition there.
4.2.2 Sulfur Trioxide Secondary Electrolyzer
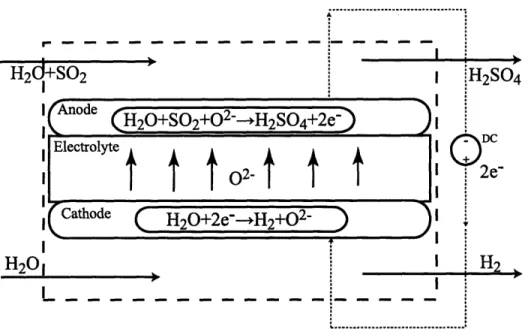
The secondary electrolysis unit has the advantage of being similar to a water elec-trolysis cell. By passing oxygen ions through the electrolyte, and evolving oxygen on the anode, the electrolyte and the anode are completely analogous to those used in a water electrolysis cell. Figure 4-5 shows the basic design of the decomposition electrolysis cell.
While research and experience with the anode can be transferred from water elec-trolysis research, the cathode for this system is very different. The decomposition of sulfur trioxide presents several unique challenges, including choosing a suitable elec-trode material that will be able to withstand the sulfur environment under desirable conditions, while maintaining a high decomposition efficiency. The electrolyte must also be tested to determine its ability to withstand the sulfur environment.
1ILV I I I I I I
I -I Anode
(
02--+ 20 2+2e" Electrolyte Cathode(
S03+2e--SO2+02-so03
02
I
DC2e-I
i!S02-- S02--S02--... ...
Figure 4-5: Conceptual design of sulfur dioxide decomposition electrolysis cell
4.3
System Optimization
The potential flow system for the sulfur hybrid cycle is much more complicated than previously described systems. A complete flow diagram is shown in Appendix B. The diagram is shown with strategically placed heat exchangers, compressors, and pumps. An extensive optimization for this single electrolyzer cycle was performed by Jeong et.al. [33].
4.3.1
Thermal Acid Decomposition
In this section, the contribution of operating conditions final percentage (in moles) of sulfur dioxide in the thermal acid decomposer will be presented. The work presented here was also used for the system modeling and optimization published by Jeong et. al. [33]. Modeling of the thermal acid decomposition in this cycle is also the subject of independent research [34].
4.3. SYSTEM OPTIMIZATION
Temperature
685 795 875 955 1025 1100
Equilibrium Temperature (K)
I*4H2SO4 -SO22 S03 *•O2 "-H201
Figure 4-6: Mole fraction of chemical components in the decomposition reaction as a function of temperature, at 90% H2S04 inlet concentration, with volume and pressure
(7 bar) held constant
Temperature has a large effect on the decomposition completed at equilibrium. At higher temperatures, the acid decomposition (Reaction (4.2)) is driven closer to completion. This trend is illustrated in Figure 4-6. These calculations were performed using the widely used chemical thermodynamics software CHEMKIN [Reaction De-sign Inc., 2004]. The figure clearly shows the decomposition progression. The first chemical to decompose is the sulfuric acid, decomposing into sulfur trioxide and wa-ter. This reaction begins at a lower temperature with the fraction of sulfur trioxide increasing with increasing temperature until its own decomposition becomes domi-nant. At higher temperatures, sulfur partially decomposes into sulfur dioxide and oxygen.
Inlet Acid Concentration 0.9 0.8 0.7 0.6 0.5 0.4 0.3 0.2 0.1 0 800 900 1000 1100 1200 1300 Temperature (K) -30% 160% 90% 1400
Figure 4-7: Mole fraction of sulfur dioxide in the decomposition reaction as a function of temperature and acid inlet concentration: assuming constant volume and pressure (1 bar)
Inlet acid concentration also plays a role in the total decomposition at equilibrium. At the inlet, aqueous sulfuric acid is fed into the decomposer. The effect of lower acid inlet concentrations on outlet mole fraction of sulfur dioxide is shown in Figure 4-7. The high inlet concentration of sulfuric acid leads to a higher outlet concentration of sulfur dioxide. Additionally, higher temperatures amplify the effect of the increased inlet concentration.
Pressure
Pressure is also important in the thermodynamics of decomposition. The equilibrium concentrations of all chemical components are calculated at a constant pressure, and Figure 4-8 illustrates the effect that this pressure has on the outlet fraction of sulfur
4.3. SYSTEM OPTIMIZATION
800 900 1000 1100 1200 1300 Temperature (K)
I"$l
bar "5 bar * 10 bar "*N15 bar 4120 bar!1400
Figure 4-8: Mole fraction of sulfur dioxide in the decomposition reaction as a function of temperature and acid inlet concentration, assuming constant volume and pressure
dioxide. As shown, the completion of decomposition is greatest at low decomposer pressures. Overall, neglecting other system considerations, the highest thermal de-composition in the decomposer occurs when temperature and inlet concentration of sulfuric acid are high and the pressure is low.
Oxygen Concentration
The effect of incomplete decomposition upon the chemical components remaining in the cycle, and therefore returning to the inlet of the decomposer, is also important. Figure 4-9 illustrates the relationship between the inlet concentration of oxygen fed into the decomposer (1%) on the reaction completion at different inlet acid concen-trations. Figure 4-9 also shows there is a very slight decrease in the decomposition completion inside the decomposer, but completion is virtually independent of acid inlet concentration with temperature.
0.9 0.8 0.7 0.6 0.5 0.4 0.3 0.2 0.1 0 800 900 1000 1100 1200 1300 Temperature (K)
-v 90% H2SO4 0% 02 ** 60% H2SO4 0% 02 " 30% H2SO4 0% 02
-- 90% H2SO4 1% 02 -60% H2SO4 1% 02 -- 30% H2SO4 1% 02 1400
Figure 4-9: Mole fraction of sulfur dioxide in the decomposition reaction as a func-tion of temperature, acid inlet concentrafunc-tion, and oxygen content, assuming constant volume and pressure (1 bar)
Figure 4-10 compares the decomposition completion with decomposer pressure. By varying decomposer pressure, a temperature dependant variation in decomposi-tion due to oxygen content can be seen. At low decomposer temperatures and high decomposer pressure, the oxygen inlet concentration begins to decrease the decom-position completion. This sensitivity of decomdecom-position to the additional chemical component at inlet reinforces the conclusion that the thermal decomposer should be operated at low pressures and high temperatures, thus avoiding this decrease in decomposition.
4.3. SYSTEM OPTIMIZATION
0.8 0.5 0.4 0.3 0-800 900 1000 1100 1200 1300 Temperature (K)$1 bar 0% 02 -5bar0%02 0020 bar 0% 02
-- 1 bar 1% 02 -- 5 bar 1% 02 20 bar 1% 02
Figure 4-10: Mole fraction of sulfur dioxide in the decomposition reaction as a function of temperature, decomposer pressure, oxygen content, assuming constant volume and pressure
Chapter 5
Load Requirements
5.1
Introduction
In addition to being used in transportation, hydrogen also shows promise as an energy storage medium. Much of the electric production capacity in the United States is used only part of the time. This large production capacity is necessary to meet periods of high demand, but wasted at lower demand times since actual consumption can be far below capacity. Electricity demand fluctuates on daily, weekly, and seasonal timeframes. Daily, demand has a prolonged peak during normal business, with a secondary peak after sunset. Demand is then very low in the very early hours of the morning. An example of this trend can be seen in Figure 5-1(a).
0:00 4:00 8:00 12:00 16:00 20:00
0:10
Time (Hour:minute)(a) Load Curve (Day)
3/11 571 771 9 11/1 12/31
Time (Month/Day)
On a weekly basis, electricity demand drops off on the weekends, when many businesses are closed. Similarly, on an annual basis, demand is highly dependant upon the region. For example, in regions where cooling is necessary, the yearly peaks are in the summertime, during the hottest months. In northern climates more electricity is demanded for lighting during the shorter days of the winter. Finally, the region's heating source is important. In most regions, heating oil or natural gas is relied on heavily for heating needs. However, electricity may also be used for heating, in which case there will also be a peak during the coldest months. An example of both the weekly and annual trends can be seen in Figure 5-1(b).
While the magnitude of the electricity demand can be predicted in a general way, unexpected increases in customer demand (due to inclimate weather for example) or unexpected losses of generating supply (due to equipment outages for example) make it impossible to accurately predict the amount of electricity production needed at all times. The electricity grid is therefore run with a buffer of excess supply. This buffer is called the capacity margin, and in the United States is approximately 15% on average [35]. This means that on average, the electricity generating stations in the United States can produce 15% more electricity than is used on the grid. Maintaining capacity margins is important, because if the demand were to suddenly exceed the supply, the grid may experience blackouts.
While the average capacity margin is only 15%, the capacity margins during low demand times of the day can be substantially higher. If this offpeak capacity could be used to produce hydrogen, the power infrastructure could be used much more efficiently. In particular, large nuclear and coal plants are not easily manipulated to vary their output hourly or even daily. They are better off working at a base load all the time. This chapter seeks to expand on the previous reports on the feasibility of hydrogen production coupled with a nuclear power plant by looking at the feasibility of variable hydrogen production. With a variable production system, hydrogen could be produced during offpeak hours. During high demand times, the plant could return
5.2. HYDROGEN / ELECTRICITY PRODUCTION
then to supplying electricity to the grid. The previous work discussed in Chapter 3 has examined full capacity hydrogen production potential. However, in order to model this system, the effect of lowering hydrogen production from maximum to low capacity production was looked at.
5.2
Hydrogen
/
Electricity Production
300 250 S200 S150 W 100 50. 0.0 1.0 2.0 3.0 4.0 5.0 6.0 7.0 8.0 9.0 % Reactor Power Used for H20 Preheating
*Total Electricity Produced n Electricity Used for H2 Production Grid Electricity
10.0
Figure 5-1: Electricity production broken into hydrogen process requirement and electricity distribution potential as a function of thermal energy extraction
Using the full energy potential of the reactor to produce hydrogen will leave no availability for the power producing potential of the power plant. For each of the configurations presented in Yildiz [32], approximately 9 to 10% of the reactor energy is diverted thermally to preheat the water for the hydrogen production system. By decreasing that thermal energy percentage, the production of hydrogen decreases, however energy is then available for excess electricity production that can be sold
to the grid. This can be accomplished by increasing the ratio of power system to heat exchanger flow rates, discussed in 3.3.1 and illustrated in Figure 3-4(b). Figure 5-1 shows the tradeoff between the maximum hydrogen production and maximum electricity production as a function of how much thermal energy is taken from the reactor stream.
Figure 5-1 shows that the total electricity produced decreases as hydrogen pro-duction increases. This relationship is caused by the fact that more and more thermal energy is being diverted from the reactor, decreasing the thermal energy being sup-plied to the turbine. This specific figure is for a reactor outlet of 5500C and system pressure of 0.1MPa, and the same trend is shown through all temperatures and pres-sures.
5.2.1
Cycle Efficiency
55.0 53.0 51.0 49.0 47.0 45.0 43.0 41.0 39.0 37.0 35.0 3.0 2.5 o 2.0 " 0 1.5 1.0 -0.5 0.0 0.0 1.0 2.0 3.0 4.0 5.0 6.0 7.0 8.0 9.0 10.0% Reactor Power used for H20 Preheating
4Electrical Efficiency --- Hydrogen Production Efficiency Hydrogen
Figure 5-2: Electrical and process efficiencies and hydrogen production as a function of thermal power extraction