commensals in IL-21 receptor deficiency reshapes
immune cell homeostasis and mucosal immunity
The MIT Faculty has made this article openly available.
Please share
how this access benefits you. Your story matters.
Citation
Cho, Hyeseon et al. "Defective IgA response to atypical intestinal
commensals in IL-21 receptor deficiency reshapes immune cell
homeostasis and mucosal immunity." Mucosal Immunology 12
(August 2018): 85–96 © 2018 The Author(s)
As Published
http://dx.doi.org/10.1038/s41385-018-0056-x
Publisher
Springer Science and Business Media
Version
Final published version
Citable link
https://hdl.handle.net/1721.1/122642
Terms of Use
Creative Commons Attribution 4.0 International license
ARTICLE
OPEN
Defective IgA response to atypical intestinal commensals in
IL-21 receptor de
ficiency reshapes immune cell homeostasis
and mucosal immunity
Hyeseon Cho1, Henrique Jaime2, Rafael Pires de Oliveira3, Byunghyun Kang1, Rosanne Spolski4, Tina Vaziri1, Timothy G. Myers5, Vishal Thovarai6, Zeli Shen7, James G. Fox7, Warren J. Leonard4and Brian L. Kelsall1
Despite studies indicating the effects of IL-21 signaling in intestinal inflammation, its roles in intestinal homeostasis and infection are not yet clear. Here, we report potent effects of commensal microbiota on the phenotypic manifestations of IL-21 receptor deficiency. IL-21 is produced highly in the small intestine and appears to be critical for mounting an IgA response against atypical commensals such as segmentedfilamentous bacteria and Helicobacter, but not to the majority of commensals. In the presence of these atypical commensals, IL-21R-deficient mice exhibit reduced numbers of germinal center and IgA+B cells and expression of activation-induced cytidine deaminase in Peyer’s patches as well as a significant decrease in small intestine IgA+plasmablasts and plasma cells, leading to higher bacterial burdens and subsequent expansion of Th17 and Treg cells. These microbiota-mediated secondary changes in turn enhance T cell responses to an oral antigen and strikingly dampen Citrobacter rodentium-induced immunopathology, demonstrating a complex interplay between IL-21-mediated mucosal immunity, microbiota, and pathogens.
Mucosal Immunology (2019) 12:85–96; https://doi.org/10.1038/s41385-018-0056-x
INTRODUCTION
Interleukin-21 (IL-21) is a pleotropic cytokine that regulates a wide range of innate and adaptive immune responses and exerts major effects on the development of autoimmune and inflammatory disorders.1 It is a member of the commonγ-chain (γ
c) cytokine
family that includes IL-2, IL-4, IL-7, IL-9, and IL-15, and signals via a receptor containing IL-21R and γc. IL-21 is predominantly
produced by T follicular helper (Tfh) and T helper 17 (Th17) cells and to a lesser extent by NKT, and other subsets of CD4 and CD8 T cells. IL-21R is widely expressed on myeloid and lymphoid immune cells as well as at low levels on intestinal epithelial cells.2 IL-21 and IL-21R deficiencies have been recently identified as novel causes of primary human immunodeficiency.3
IL-21 exerts complex effects on human and mouse B and T cell functions. In B cells, IL-21 promotes immunoglobulin (Ig) class switching, antibody affinity maturation, and generation of plasma cells and germinal center (GC) B cells following immunization or infection by regulating critical factors such as activation-induced cytidine deaminase (AID), BLIMP-1, and BCL6.1,4–7In T cells, IL-21 also has pleiotropic effects on the generation and maintenance of multiple CD4+ subsets. IL-21 contributes to Th17 and Tfh cell generation, but it impedes development of T helper 1 (Th1) and regulatory T (Treg) cells.3,8,9IL-21 stabilizes and expands the Th17
cell population by augmenting IL-23 receptor expression and inducing the expression of RORγt, a master regulator of Th17 differentiation.10 In addition, IL-21-mediated suppression of Treg
cell expansion is via inhibition of IL-2 production by conventional CD4 T cells.11IL-21 has also been reported to inhibit the expansion
of T follicular regulatory (Tfr) cells, which is associated with decreased expression of the IL-2 receptorα chain, CD25.12
Despite extensive studies on the role of IL-21 in immune cell development and systemic immunity, how it affects intestinal homeostasis, inflammation, and responses to infection is unclear. Polymorphisms in the human IL2–IL21 locus are associated with ulcerative colitis and Crohn’s disease as well as celiac disease,13 and high levels of IL-21 were found in mucosal biopsy samples of patients with ulcerative colitis, Crohn’s disease, or colon cancer.14,15 Furthermore, DSS-induced colitis and tumorigenesis studies using IL-21-deficient mice have shown a positive role for IL-21 in intestinal inflammatory disease14,16and resulted in clinical trials of anti-21 for treatment of IBD. In contrast, children with IL-21R mutations have gut-related pathology and show susceptibility to severe Cryptosporidium parvum infection.4IL-21 deficiency was also identified as a cause of early-onset inflammatory bowel disease17and IL-21R-deficient mice are more susceptible to DSS-induced18and T cell transfer colitis.19These conflicting data are
consistent with a complex and possibly microbiota-dependent role of IL-21 signaling in intestinal immune homeostasis.
One possibility in this regard is a role for IL-21 in generating intestinal IgA that controls the levels of commensal bacteria and their exposure to the intestinal epithelium. Prior studies have shown that IL-21 and IL-21R-deficient mice have low levels of
Received: 3 April 2018 Revised: 18 May 2018 Accepted: 31 May 2018 Published online: 7 August 2018
1
Mucosal Immunobiology Section, Laboratory of Molecular Immunology, National Institute of Allergy and Infectious Diseases, NIH, Bethesda, MD, USA;2Sidney Kimmel Medical College, Thomas Jefferson University, Philadelphia, PA, USA;3
Federal Institute of Parana, Palmas, Brazil;4
Laboratory of Molecular Immunology, National Heart, Lung and Blood Institute, NIH, Bethesda, MD, USA;5Research Technologies Branch, National Institute of Allergy and Infectious Diseases, NIH, Bethesda, MD, USA;6Basic Science Program, Leidos Biomedical Research, Inc., Frederick National Laboratory for Cancer Research, Fredrick, MD, USA and7
Department of Biological Engineering, Massachusetts Institute of Technology, Cambridge, MA, USA
intestinal IgA and that IL-21 can cooperate with TGFβ and retinoic acid to induce IgA class-switch recombination in vitro.20 In this study, we addressed the role of IL-21 in B cell and T cell responses in the intestine of mice with different intestinal microbiota. We found that IL-21R-deficient mice developed lower IgA responses in the small intestine in the presence of atypical commensals such as segmented filamentous bacteria (SFB) and Helicobacter spp. Furthermore, likely as a consequence of a poor T cell-dependent IgA response to these organisms and their subsequent over-growth and increased contact with the intestinal epithelium, Th17 and Treg cells were expanded in the small intestine of the IL-21R-deficient mice consistent with the known effects of these microbes on intestinal T cell homeostasis.21–23 These changes in turn affected mucosal immune responses to an orally adminis-tered protein (ovalbumin; OVA) and immunopathologic responses to Citrobacter rodentium infection. Together, our study elucidates the complex relationship between IgA B cell responses, micro-biota, and intestinal immune homeostasis and suggests that defective T cell-dependent IgA responses to atypical bacteria have broad physiological consequences such as enhanced T cell responses to food antigens and altered pathology in intestinal infection.
RESULTS
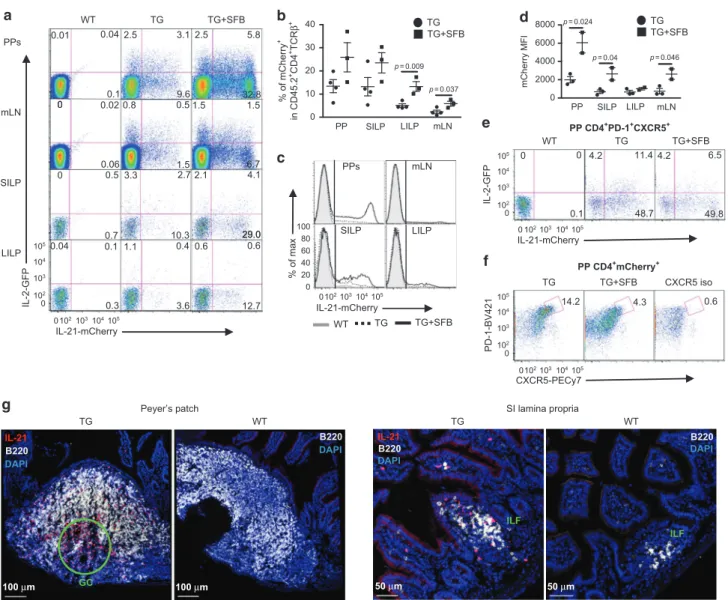
CD4 T cells are the main source of IL-21 production in the intestine To assess the role of IL-21 signaling in the intestine and gut-associated lymphoid tissues, wefirst examined the production of IL-21 using Il21-mCherry and Il2-emGFP BAC dual reporter transgenic (TG) mice.24 Approximately 13% of CD4+ T cells in Peyer’s patches (PPs) and the small intestine lamina propria (SILP) were IL-21-mCherry+, in contrast to ~2 and 5% in mesenteric lymph nodes (mLNs) and the large intestine (LI) LP, respectively (Fig.1a, b); whereas <2% of these cells were seen in liver, axillary, and cervical LNs, and lung in other studies.24,25 A prior report
demonstrated that an intestinal commensal SFB induced IL-21 mRNA expression in the terminal ileum of C57BL/6 mice.26Since
our reporter mice were not colonized with SFB, we cohoused these mice with Taconic Biosciences SFB+mice for 4–6 weeks to examine whether IL-21-mCherry+cells would increase in number. In organs examined, the mean frequency of IL-21-mCherry+cells increased 2–2.5 fold following SFB colonization (Fig. 1b, c), although the differences in the PPs and SILP were not statistically significant due to variability in the frequency in these organs. Furthermore, the mean fluorescence intensity of IL-21-mCherry was higher in the PPs than other tissues in SFB− mice and increased 3–4 fold in all but the LILP after cohousing with SFB+ mice (Fig. 1d). Almost no mCherry+ or GFP+ cells were detected in CD4−TCRβ+ or TCRβ−cells in the absence or presence of SFB (Supplementary Fig. 1a-b). Therefore, IL-21 is expressed by CD4 T cells in the intestine with higher numbers in the small intestine and PPs, and appears to be induced by SFB colonization.
Since Tfh cells are reported to produce the highest amounts of IL-21,27 we used the cell surface markers, PD-1 and CXCR5 to
assess the frequency of IL-21-producing Tfh cells within the PPs. Approximately 60% of PP Tfh cells were IL-21-mCherry+, which appeared not to be affected by the cohousing (Fig.1e). However, ~14% of mCherry+cells expressed PD-1 and CXCR5 (Fig.1f), which is significantly lower than previously reported.28This discrepancy may be due to the use of different mouse strains, since the prior study used IL-21-eGFP TG mice on the BALB/c background. Interestingly, the frequency of mCherry+ Tfh cells was reduced following cohousing with SFB+mice (Fig.1f), indicating that the majority of cells in the PP-producing IL-21 are not Tfh, but likely Th17 cells, another known high producer of IL-21.1 Finally, we examined the location of IL-21 producing cells by immunofluor-escence staining to determine where these cells resided within
the PPs and SI. While more of IL-21-mCherry+cells were localized within the GC of PP as seen previously,28 they also resided throughout the other areas of PP including B and T cell zones as well as the subepithelial dome (Fig.1g). In the small intestine, IL-21-mCherry+ cells appeared associated more with isolated lymphoid follicles (ILFs) with sparse distribution in the LP (Fig.1g). Together, our results indicate that IL-21 is produced highly in the PPs and SILP, especially within the PP GC and SI ILFs during homeostasis and that SFB colonization selectively increases IL-21-production by non-Tfh CD4+T cells.
IL-21 signaling is necessary for optimal generation of intestinal IgA+B cells in a microbiota-dependent manner
IgA is the most abundant antibody isotype in mammals, produced mainly in the intestine, and plays a critical role in immune homeostasis and mucosal immunity.29To examine the role of
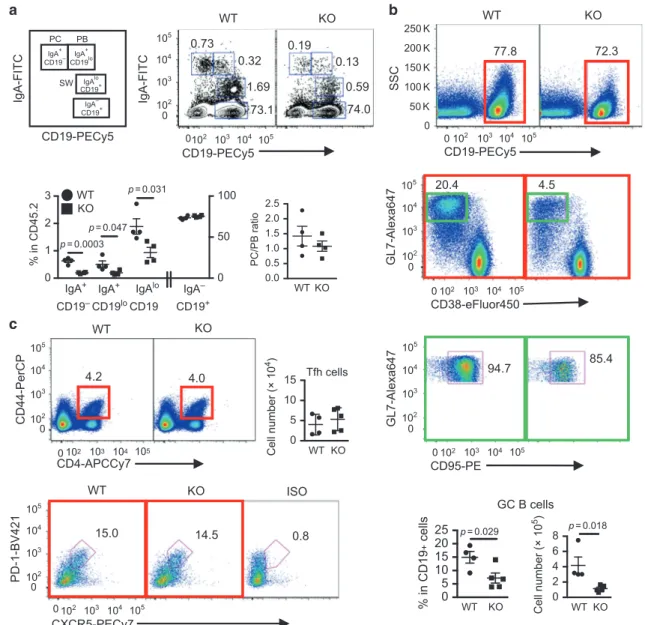
IL-21 signaling in intestinal B cell homeostasis, we compared various IgA+B cell populations in the PPs, the main IgA inductive site and in the small and large intestine LP containing ILFs. The IgA+B cell populations evaluated include IgAloCD19+ B cells that have
undergone class switch recombination (CSR), IgA+CD19lo plasma-blasts (PBs), and IgA+CD19−plasma cells (PCs) (Fig.2a). Since prior studies indicated that SFB induced IgA production and Th17 cell differentiation and function in the small intestine,26,30 we examined both SFB+and SFB−IL21R KO mice and their littermate controls. PPs of SFB+IL-21R KO mice had a significant reduction in all three IgA+B cell populations (post-switched B cells, PBs, and PCs), compared to their WT littermates (Fig.2a). However, the ratio of PC/PB remained unaltered (Fig.2a), suggesting little effect of IL-21 on PB to PC maturation during the steady state. In addition, quantitative PCR (qPCR) analysis revealed significantly lower AID mRNA expression by pre-switched IgA−CD19+cells in IL-21R KO than WT littermates (Supplementary Fig. 2a), consistent with the reduced post-switched IgA+ B cell number observed in the KO PPs. Furthermore, there was approximately a fourfold decrease in the number of germinal center B cells (CD19+CD38−GL7+CD95+) in the PPs of IL-21R KO mice compared to WT littermates, whereas the number of Tfh cells remained unchanged (Fig.2b, c). These results indicate that IL-21 signaling plays a critical role in intestinal IgA CSR in vivo, consistent with a prior report showing an effect of IL-21 on IgA B cell class switching in the presence of exogenous TGFβ in vitro.20Finally, we addressed a prior study suggesting that IL-21 signaling may be important for IgA B cell generation in PPs because of its ability to inhibit IgG2b+B cell CSR in the presence of TGFβ.31 However, we did not observe differences in post-switched IgG2bloCD19+ B cells, IgG2b+CD19lo PBs, or CD19−IgG2b+ PCs in PPs of IL-21R KO mice (Supplementary Fig. 2b), indicating that the reduction in IgA B cells in IL-21R KO mice was not due to a deviation towards IgG2b+B cell switching/ differentiation. Finally, in contrast to PPs, IgA+B cell populations in the mLNs, a minor IgA inductive site were similar between IL-21R KO mice and WT littermates (Supplementary Fig. 2c).
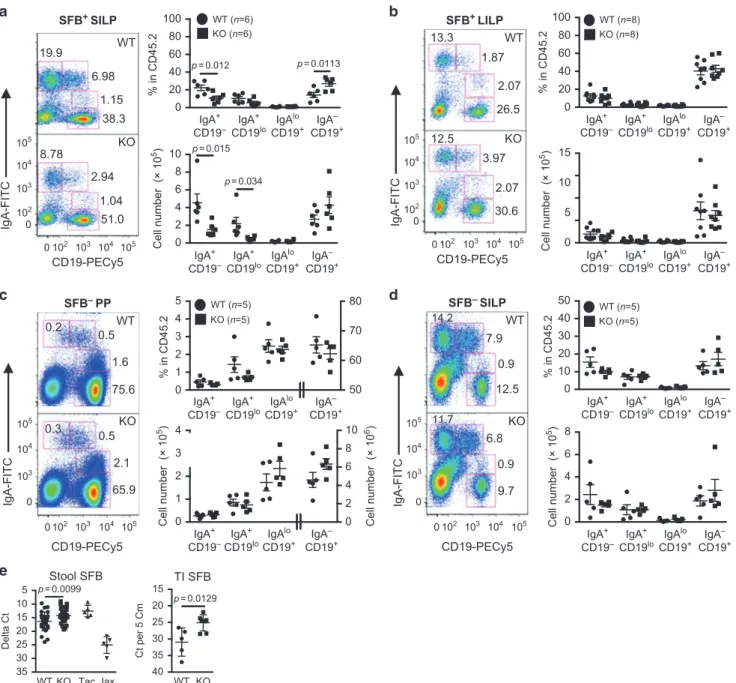
Next, we examined the IgA+B cell populations in the SILP and LILP of SFB+mice. The number of PBs and PCs were significantly decreased in the SILP of IL-21R KO mice compared to WT mice (Fig.3a). However, in contrast to PPs, the number of post-switched IgA+B cells was unaffected in the KO mice. The PC/PB ratio of the KO mice was again similar to that of WT mice (data not shown), consistent with the minor effect of IL-21 on IgA plasma cell differentiation observed in PPs. No differences in IgA+ B cell populations were detected in the LILP of IL-21R KO mice (Fig.3b). In addition, mRNA expression of the T cell-independent CSR factors, BAFF and APRIL were similar in the PPs, SILP, and LILP of WT and KO mice (Supplementary Fig. 2d).
Finally, to understand the interplay between IL-21 signaling, IgA, and SFB, we examined intestinal IgA+B cells isolated from SFB− mice. Surprisingly, SFB− IL-21R KO mice had similar numbers of IgA+B cell populations both in the PPs and SILP compared to 86
1234567
SFB− WT littermates (Fig. 3c, d). In addition, we measured SFB levels to determine whether the reduction in IgA+ B cells described above as well as the low stool IgA levels20 observed
with SFB+IL-21R KO mice had any effect on SFB growth. We found that SFB levels were significantly higher in both the feces and the terminal ileal tissue of IL-21R KO mice compared to SFB+ WT littermates (Fig.3e). Together, our data indicate a role for IL-21 in homeostatic IgA B cell responses to atypical commensal bacteria such as SFB by affecting IgA B cell switching in PPs and with localized effects on IgA levels in the small intestine. Since IgA+B cells were unaffected in mice in the absence of SFB, IL-21 signaling does not appear to be required for IgA responses to the majority of intestinal microbiota. Furthermore, these data are consistent with the prior studies describing a critical role of T cell-dependent high-affinity IgA responses in controlling the overgrowth of atypical commensals such as SFB.30,32
Microbiota-dependent increase of Th17 and Treg cells in the small intestine of IL-21R KO mice
We next investigated the consequence of IL-21R deficiency and the associated microbiota-dependent defective IgA response on intestinal T cell homeostasis. Wefirst compared T cell populations between SFB+IL-21R KO and WT littermates. Numbers of TCRβ+ CD4 T cells were higher by approximately fourfold in the KO SILP (Fig. 4a). This expansion was due to increases in Foxp3+ Tregs including both RORγt+ and RORγt− (Helios+) Tregs as well as Foxp3−RORγt+ Th17 cells (Fig. 4a and Supplementary Fig. 3a). Furthermore, the expansion of SILP Th17 cells in IL21R KO mice was also reflected in increased TCRαβ+T cells producing IL-17 and IL-22 (Fig.4b). However, RORγt+ILC3 cells33remained unchanged in the KO SILP (Fig.4c). Unlike SILP, we observed no differences in TCRβ+CD4 T cells, Tregs (both RORγt+and Helios+), Th17 cells,
and ILC3s (Supplementary Fig. 3b-c) as well as TCRβ+ T cells 6.7 0.6 29.0 g Peyer’s patch WT 100 μm B220 DAPI TG IL-21 B220 DAPI 100 μm GC SI lamina propria WT ILF B220 DAPI 50 μm TG ILF 50 μm IL-21 B220 DAPI IL-21-mCherry a PPs mLN SILP IL-2-GFP LILP TG+SFB 32.8 5.8 2.5 1.5 TG 2.5 0.8 3.1 9.6 0.5 1.5 WT 0.1 0.01 0.04 0.02 0.06 0 2.1 4.1 0.6 3.3 1.1 2.7 10.3 0.4 0 0.5 0.7 0.04 0.1 29.0 12.7 3.6 0.3 0 0 0 102 102 103 103 104 104 105 0 102 103 104 105 105 0 102103104105 0102103104105 0 10 20 30 40 PP SILP LILP p = 0.009 p = 0.024 p = 0.04 p = 0.046 p = 0.037 % of mCherry + in CD45.2 +CD4 +TCR β + b TG TG+SFB 0 2000 4000 6000 8000 mCherry MFI PP SILP LILP mLN TG TG+SFB d WT TG TG+SFB % of max c IL-21-mCherry PPs mLN SILP LILP 0 20 40 60 80 100 CXCR5-PECy7 PD-1-BV421 f 4.3 14.2 TG TG+SFB PP CD4+mCherry+ 0.6 CXCR5 iso IL-21-mCherry IL-2-GFP TG+SFB WT PP CD4+PD-1+CXCR5+ TG 48.7 49.8 0.1 0 11.4 0 4.2 4.2 6.5 e 0 102103104105 0 102 103 104 105 1.5 mLN
Fig. 1 21 production in the intestine and gut-associated lymphoid tissues. a Representative flow cytometry plots for 21-mCherry and
IL-2-GFP expression in live CD45.2+CD4+TCRβ+cells isolated from Peyer’s patches (PPs), mesenteric lymph nodes (mLN), small intestine lamina
propria (SILP), and large intestine lamina propria (LILP) of SFB−wild-type littermates (WT), hemizygous Il21-mCherry and Il2-emGFP Tg mice
(TG). Cells were also harvested from the Tg mice co-housed with SFB+mice for 4–6 weeks (TG + SFB). b Frequency of mCherry single positive
and mCherry/GFP double positive cells in CD45.2+CD4+TCRβ+gate. Data are represented as mean ± SEM (TG; n= 4, TG + SFB; n = 3). c Flow
cytometry histograms showing IL-21-mCherry expression in CD45.2+CD4+TCRβ+cells. Wild type (shaded gray), TG (dashed), and co-housed
TG (solid black). d mCherry meanfluorescence intensity (MFI) values of mCherry+CD45.2+CD4+TCRβ+cells. Data are represented as mean ±
SEM (TG; n= 3, TG + SFB; n = 2). e Expression of IL-21-mCherry in PP Tfh cells. CD4+PD-1+CXCR5+cells were plotted for IL-2-GFP versus
IL-21-mCherry. f PD-1+CXCR5+cells were gated on PP CD4+mCherry+cells. Data summarize two independent experiments. g Confocal microscopy
images of cells expressing IL-21-mCherry in TG and WT PPs and SILP containing ILFs. Tissues were stained with anti-B220 antibody and DAPI
making IL-17 and IL-22 (Supplementary Fig. 3d) in the LILP of SFB+ KO mice compared to WT mice. In addition, the numbers of IL-17+ and IL-22+ILCs (TCR−CD90+) and Tγδ cells as well as IFNγ+ILCs and T cells in the KO SILP and LILP were comparable to those of WT littermates (Supplementary Fig. 4a-b). Finally, while the frequencies of TCRβ+CD4 T cells and Foxp3+Tregs were similar between WT and KO PPs and mLNs, approximately twofold increases in the percentage of Foxp3−RORγt+ Th17 cells were observed in these KO tissues (Supplementary Fig. 4c).
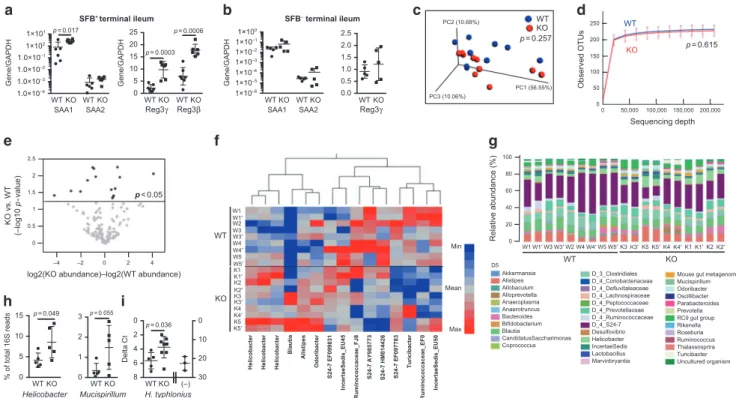
As discussed above, we found an enhanced SFB burden in the stool and the terminal ileum of IL-21R KO mice compared to WT littermates (Fig.3e), suggesting that enhanced SFB contact with the epithelium may contribute to the enhanced Th17 responses in the SILP seen in these mice. To further address this possibility, we examined the expression of genes known to be induced by SFB in the ileal tissue.26 Higher levels of mRNA for serum amyloid A protein 1 (SAA1) and strikingly higher levels of mRNA for Reg3β
and Reg3γ were found in the terminal ileum of KO mice compared to WT littermates (Fig.5a). In contrast, levels of mRNA for Reg3β and Reg3γ in the distal colon were similar between IL-21R KO and WT littermates (Supplementary Fig. 4d). Together, these results indicate that in the small intestine of IL-21R KO mice, SFB is poorly controlled by IL-17 contrary to a previous study34and support the hypothesis that an IL-21-driven high affinity T cell-dependent IgA response is essential for controlling SFB levels and contact with the intestinal epithelium.30,32
Next, to ascertain the effect of SFB-containing microbiota on the T cell phenotype observed in the SILP of IL-21R KO mice, we evaluated T cells in SFB−IL-21R KO mice. These SFB−KO mice had similar numbers of CD4+T cells, Th17, and Treg cells (both RORγt+ and Helios+) as well as ILC3 in the SILP, LILP, PPs, and mLNs to those of WT littermates (Supplementary Fig. 5). Furthermore, equivalent levels of SAA1, SAA2, and Reg3γ were observed in the terminal ileum of SFB−IL-21R KO and WT littermates (Fig. 5b).
IgA-FITC a IgA+ CD19– IgA+ CD19lo IgAlo CD19+ IgA– CD19+ IgA-FITC CD19-PECy5 PC SW WT 0.0 0.5 1.0 1.5 2.0 2.5 PC/PB ratio KO WT 1.69 0.32 0.73 73.1 74.0 0.59 0.13 0.19 0 102 103 104 105 102 103 104 105 0 CD19-PECy5 0 1 2 3 0 50 100 % in CD45.2 WT KO IgA+ CD19– IgA+ CD19lo IgAlo CD19 IgA– CD19+ p = 0.0003 p = 0.047 p = 0.031 KO WT 77.8 SSC 72.3 b CD19-PECy5 0 50 K 100 K 150 K 200 K 250 K 102 103 104 105 0 4.5 CD38-eFluor450 GL7-Alexa647 20.4 102 103 104 105 0 0 102 103 104 105 CD95-PE GL7-Alexa647 94.7 85.4 102 103 104 105 0 0 102 103 104 105 0 5 10 15 20 25 % in CD19 + cells p = 0.029 GC B cells Cell number (× 10 5) p = 0.018 2 4 6 8 0 Cell number (× 10 4) Tfh cells 5 0 10 15 c WT KO CD4-APCCy7 CD44-PerCP 4.2 4.0 0 102 103 104 105 102 103 104 105 0 102 103 104 105 0 0 102 103 104 105 15.0 CXCR5-PECy7 PD-1-BV421 WT 14.5 ISO 0.8 KO KO WT KO WT KO WT KO PB
Fig. 2 Defective generation of IgA+B cells and GC B cells in the Peyer’s patches of IL-21R KO mice. a Schematic drawing and representative
flow cytometry plots of intracellular IgA staining of PP B cells gated on CD45.2+. PC plasma cells, PB plasmablasts, and SW post-switched B
cells. The graphs indicate the frequency of various IgA B cells and the ratio of IgA+PC over PB. Data are represented as mean ± SEM (n= 4).
bPP GC B cells defined as CD19+GL7+CD38−CD95+. CD19+cells (red square) were gated on CD45.2+and then CD38−GL7+cells (green
square) on CD19+followed by gating for CD95+. The cell number and frequency are shown as mean ± SEM (WT; n= 4, KO; n = 5). c PP Tfh
cells defined as CD44+CD4+PD-1+CXCR5+. CD44+CD4+cells are gated on CD45.2+and then PD-1+CXCR5+cells on CD44+CD4+. The cell
number is shown as mean ± SEM (WT; n= 4, KO; n = 5). Data were compiled from 2 to 4 independent experiments
Therefore, both Th17 and Treg cells are only expanded in the IL-21R KO mice harboring SFB-containing microbiota.
To address the ability of SFB or other co-colonizing microbiota to drive Treg induction, SFB−IL-21R KO mice and WT littermates were cohoused for 4 weeks with SFB+mice from either Taconic Farms or our NIH colonies and examined for any changes in Foxp3−RORγt+Th17 cells and Foxp3+Tregs. SFB−IL-21R KO mice cohoused with Taconic SFB+ mice had significantly higher numbers of Th17 cells in the SILP than cohoused SFB−WT littermates, whereas cohoused SFB− WT and KO mice showed similar Treg numbers (Supplementary Fig. 6a, upper panel). In contrast, cohousing with the NIH SFB+mice resulted in increased numbers of both Th17 and Treg cells in the SILP of cohoused SFB−IL-21R KO mice compared to cohoused SFB−WT littermates
(Supplementary Fig. 6b, upper panel). Although the expansion of neither Th17 nor Treg cells in the colon was seen during the steady state in SFB+IL-21R KO mice from our colony, co-housing of SFB− IL-21R KO mice with Taconic SFB+ WT mice or our NIH SFB+ mice led to increases in these cells in the colon, indicating distinct host responses in the colon to acute vs chronic exposure to commensals (Supplementary Fig. 6a-b, bottom panels). Consistently, broad distribution of RORγt+Th17 cells was observed when SFB was acutely introduced.22 Taken together, our results suggest that Th17 cell expansion observed in the SILP of IL-21R KO mice is likely due to higher levels of SFB and increased epithelial contact with these bacteria, whereas bacteria other than SFB appear to enhance Treg cell expansion. 1 0 2 3 4 2 0 4 6 10 8 0 20 40 60 80 100 % in CD45.2 p = 0.012 p = 0.0113 IgA+ CD19– IgA+ CD19lo IgAlo CD19+ IgA– CD19+ IgA+ CD19– IgA+ CD19lo IgAlo CD19+ IgA– CD19+ IgA+ CD19– IgA+ CD19lo IgAlo CD19+ IgA– CD19+ IgA+ CD19– IgA+ CD19lo IgAlo CD19+ IgA– CD19+ IgA+ CD19– IgA+ CD19lo IgAlo CD19+ IgA– CD19+ IgA+ CD19– IgA+ CD19lo IgAlo CD19+ IgA– CD19+ IgA+ CD19– IgA+ CD19lo IgAlo CD19+ IgA– CD19+ IgA+ CD19– IgA+ CD19lo IgAlo CD19+ IgA– CD19+ WT (n=6) KO (n=6) WT (n=5) KO (n=5) WT (n=8) KO (n=8) WT (n=5) KO (n=5) Cell number (× 10 5) Cell number (× 10 5) Cell number (× 10 6) Cell number (× 10 5) Cell number (× 10 5) 2 4 6 8 10 0 p = 0.015 p = 0.0099 p = 0.0129 p = 0.034 CD19-PECy5 IgA-FITC a WT 1.15 38.3 6.98 19.9 51.0 1.04 2.94 8.78 KO SFB+ SILP SFB– PP SFB– SILP SFB+ LILP 102 103 104 105 0 102 103 104 105 0 0102 103 104 105 102 103 104 105 0 0 102 103 104 105 0 103 104 105 0 103 104 105 0 102 103 104 105 0 20 40 60 80 100 % in CD45.2 5 10 15 0 IgA-FITC CD19-PECy5 13.3 1.87 2.07 26.5 12.5 3.97 2.07 30.6 KO WT b 0 10 20 30 40 50 % in CD45.2 2 0 4 6 8 IgA-FITC d 0.9 7.9 14.2 12.5 11.7 6.8 0.9 9.7 CD19-PECy5 WT KO 0 1 2 3 4 5 50 60 70 80 % in CD45.2 CD19-PECy5 IgA-FITC WT 1.6 0.5 0.2 75.6 KO 2.1 65.9 0.3 0.5 c Stool SFB e TI SFB WT 15 20 25 30 35 40 Ct per 5 Cm WT 5 10 15 20 25 30 35 Delta Ct KO Tac Jax KO
Fig. 3 Reduction in IgA+plasmablasts and plasma cells in the small intestine of SFB+IL-21R KO mice. a, b Intracellular IgA B cell staining in
SILP (a) and LILP (b) of SFB+WT and IL-21R KO mice. c, d Intracellular IgA B cell staining in PP (c) and SILP (d) of SFB−WT and IL-21R KO mice.
Gated on CD45.2+ cells. The graphs indicate the frequency and cell number of various IgA B cell populations. Data summarize 3−4
independent experiments and are represented as mean ± SEM. e Comparison of SFB levels in the stool (WT; n= 27, KO; n = 28) and the
terminal ileum (TI, n= 5) of WT versus IL-21R KO mice. Tac, stool samples from SFB+Taconic C57BL/6 mice and Jax, stool samples from SFB−
Jackson C57BL/6 mice
To assess the effects of IL-21R deficiency on the intestinal microbiota, we performed 16S rRNA gene sequencing on stool samples from SFB+ IL-21R KO and WT littermates that were individually housed for 4 weeks immediately after weaning. Weighted UniFrac principal coordinates analysis (PCoA) for beta diversity and rarefaction analysis for alpha diversity revealed no statistically significant differences in the global bacterial composi-tion and species richness between WT and KO stool samples, respectively (Fig.5c, d). Significance tests were conducted using
the permutational multivariate analysis of variance for beta diversity and a nonparametric two sample t-test for alpha diversity. To determine whether the abundance of any specific bacterial taxa was different between WT and KO mice, we performed volcano-plot analysis of de novo OTUs (Fig. 5e). 15 OTUs showed statistically significant increases or decreases in relative abundance between IL-21R KO and WT littermates, suggesting an effect of IL-21 on certain bacterial microbiota (Fig. 5e, f). However, a significant increase in bacteria previously identified to drive Treg induction such as Clostridium and Lactobacillus spp.35 was not seen in the stool of IL-21R KO mice (Fig. 5f). Since 16S rRNA gene sequencing is inadequate to delineate the differences at the species level, we did not compare the SFB levels. Of the differences, 3 OTUs identified as the genus Helicobacter were significantly higher in the stools from the individually housed IL-21R KO mice compared to WT littermates (Fig. 5f–h). To identify the species of Helicobacter present in our
colony, PCR analysis on the stool DNA samples was performed, which confirmed the presence of H. typhlonius and the absence of
H. rodentium, H. bilis, H. hepaticus, and H. muridarum (data not shown). Furthermore, real-time PCR analysis of stool DNA samples demonstrated significantly higher levels of H. typhlonius in IL-21R KO mice compared to WT littermates (Fig. 5i). These data are consistent with prior studies indicating a possible role for IgA in controlling the levels of Helicobacter as well as the ability of Helicobacter to induce Treg cell expansion under certain circumstances.21,23,36–38Finally, the levels of Mucispirillum reported to induce T cell-dependent IgA also trended higher in the feces of individually housed IL-21R KO mice compared to WT littermates (Fig.5h).39
IL-21R deficiency alters the mucosal CD4+T cell response to an oral antigen in a microbiota-dependent manner
We next determined whether the lack of IL-21R signaling and the microbiota-mediated changes in the small intestine of SFB+ Helicobacter+ IL-21R KO mice could influence mucosal immune responses to an oral antigen by examining the phenotype of adoptively transferred CD45.1 OT-II/Rag-1−/−T cells. After 5 days of OVA feeding, the number of OT-II cells was dramatically higher in the KO SILP compared to WT littermates, which included both Foxp3+Tregs and Foxp3−RORγt+Th17 cells (Fig.6a–c). However, expansion was skewed toward Th17 cells (35-fold increase, Fig.6c) vs Treg cells (5-fold increase, Fig.6b). In addition, OT-II Th17, but not Treg cells were increased 20–25 fold in the PPs and mLNs of IL-21R KO mice compared to WT littermates. The expansion of OT-II Th17 cells in the mLNs of OVA-fed IL-21R KO mice suggests that the increased exposure to atypical commensals resulted in
4.8 SILP CD45.2+ SILP CD45.2+ WT KO 16.9 CD4-APCCy7 TCR β -eFluor450 a 0 102 103 104 105 0 102 103 104 105 0 102 103 104 105 0 102 103 104 105 0 102 103 104 105 0 102 103 104 105 102 103 104105 0 102103104105 0 0102103 104105 0102103 104105 102103 104105 0 0102103 104105 WT Cell number (× 10 5) Cell number (× 10 6) Cell number (× 10 4) Cell number (× 10 5) 0 0.5 2.0 1.5 1.0 WT 0 10 20 30 40 50 % in CD45.2
CD4+TCRβ+ CD4+TCRβ+ Foxp3+ Foxp3– Foxp3– RORγt+
CD90+ RORγt+ p = 0.0012 p = 0.0012 p = 0.0022 WT 0 1 2 3 Cell number (× 10 4) Cell number (× 10 5) WT 0 10 20 30 40 50 % in CD4 TCR β 9.8 83.8 CD4-APCCy7 FoxP3-APC 14.2 80.0 WT 0 0.5 1.5 1.0 WT 0 20 40 60 80 100 * % in CD4 Foxp3 – 29.1 71.0 CD4-APCCy7 RORγt-PE p = 0.029 p = 0.0002 IL-17 * 2.0 1.5 1.0 0.5 0 WT 0 10 20 30 40 50 ** % in CD90 TCR β 2 0 4 6 8 10 p = 0.0067 IL-22 0 1 2 3 4 5 % in CD90 TCR β 0 1 2 4 3 5 0 20 40 60 80 100 % in Lin –NK1.1 – 35.6 Lin–NK1.1– 33.2 CD90-PECy5 ROR γ t-PE c WT 59.3 NK1.1-BV421 Lin-FITC KO 60.7 WT KO b 31.3 0.3 0.2 IL-22 isotype 0 0 0.6 IL-17 isotype IL-17A-APC WT KO 1.7 0.7 3.6 0.8 17.3 32.4 IL-22-PE SILP CD45.2+CD90+TCRβ+ p = 0.0053 p = 0.0128 KO KO KO KO KO KO KO WT KO WT KO WT KO WT KO WT KO
Fig. 4 Increased Th17 and Treg cells in the small intestine of SFB+IL-21R KO mice. Representativeflow cytometry plots of various T cell
populations in SILP. a CD4+TCRβ+cells (red square) were gated on CD45.2+and then plotted CD4 versus Foxp3. Foxp3−cells (green square)
were further plotted CD4 versus RORγt. The graphs indicate the frequency (n = 4 or 8) and cell number (n = 4) of various T cell populations.
bCD45.2+CD90+TCRβ+cells were plotted IL-17 versus IL-22 following in vitro PMA and ionomycin stimulation for 4 h (a pool of two mice).
Isotype controls for IL-17 and IL-22 are shown. IL-22+includes both IL-22 single-positive and IL-17/IL-22 double-positive cells (IL-17; n= 4 and
IL-22; n= 3). Ratio paired t-test was used for comparison of cells numbers. c Lin−(CD3e−CD11b−TCRγδ−) NK1.1−cells (red square) were gated
on CD45.2+and then plotted RORγt versus CD90 for RORγt+ILC3s (n= 4). Data summarize 2–4 independent experiments and are shown as
mean ± SEM
enhanced priming of Th17 cells not only to bacteria such as SFB22 but also to unrelated oral antigens. These primed OT-II Th17 cells then migrated to other organs such as PPs and SILP and possibly underwent further expansion in the SILP.40In contrast, the effect on Treg cells is likely to involve enhanced proliferation, survival or retention within the SILP.40,41 These data indicate that in the setting of IL-21 signaling deficiency and the presence of atypical commensal bacteria, T cell responses to soluble oral antigens are significantly enhanced.
IL-21R deficiency alters the inflammatory response to Citrobacter rodentium infection in a microbiota-dependent manner
Although we observed no differences in colon B or T cell populations between IL-21R KO mice and WT littermates during homeostasis, acute exposure of SFB−Helicobacter−IL-21KO mice to SFB and Helicobacter-containing microbiota by cohousing elicited expansion of Tregs and Th17 cells in the colon (Supplementary Fig. 6), suggesting that pathogenic bacterial signals could affect colonic T cell responses. Therefore, we challenged IL-21R KO mice with the murine attaching and effacing pathogen, Citrobacter rodentium that infects cecum and colon.42 First, we examined whether C. rodentium could induce IL-21 in the colon by RT-PCR. While little IL-21 mRNA was present in the distal colon of all uninfected mice, there was a significant induction of IL-21 in both SFB+Helicobacter+and SFB−Helicobacter−WT mice following C. rodentium infection (Fig. 7a and Supplementary Fig. 7a). Interestingly, this induction was significantly abrogated in SFB+Helicobacter+IL-21R KO mice, but not in SFB−Helicobacter− IL-21R KO. The induced IL-21 had little effect on control of C.
rodentium over thefirst 2 weeks, as burdens were similar in the feces and the colon and spleen tissues of SFB+as well as SFB− IL-21R KO mice and their WT littermates (Fig. 7b, c and Supplementary Fig. 7b-c). These data are consistent with a prior study showing only minimal differences in bacterial burden in IL-21 KO and WT mice over this time frame.43
In contrast to the minor effects on bacterial clearance, IL-21 significantly affected the inflammatory response to C. rodentium in SFB+Helicobacter+mice, as there was a significant reduction in inflammation in the colons of IL-21R KO mice compared to WT littermates (Fig.7d–f). None of the SFB+Helicobacter+IL-21R KO mice showed severe colon shortening, an indicator of inflamma-tion, as seen in some WT littermates (Fig.7d). More importantly, the majority of KO mice exhibited strikingly reduced tissue pathology as indicated by reduced epithelial cell hyperplasia and less infiltration of inflammatory cells (Fig. 7e, f). In contrast, SFB−Helicobacter−IL-21R KO mice were not protected from the severe pathological changes seen in their WT littermates (Supplementary Fig. 7e-f).
To understand the mechanisms involved in the reduced tissue pathology in SFB+Helicobacter+IL-21R KO mice, we determined the expression of mRNA for cytokines known to promote immunopathology during C. rodentium infection such as IFNγ, IL-12, and IL-1β in colon tissue following infection.44,45 In addition, we assessed the mRNA expression of markers for regulatory Th17 cells such as IL-1RA and IL-10 as well as those of pathogenic Th17 cells such as Csf2 and IL-23 receptor, since IL-21-mediated signaling is also reported to promote the generation and stabilization of pathogenic Th17 cells in a murine experimental
d WT KO 0 50,000 100,000 150,000200,000 250 50 150 200 100 0 Observed OTUs Sequencing depth p = 0.615 SFB– terminal ileum b WT KO WT KO 1×10⁻⁶ 1×10⁻⁵ 1×10⁻⁴ 1×10⁻³ 1×10⁻² 1×10⁻¹ 1×100 Gene/GAPDH SAA1 SAA2 0.0 0.5 1.0 1.5 2.0 2.5 Reg3γ PC2 (10.68%) PC3 (10.06%) PC1 (56.55%) WT KO c p = 0.257 SFB+terminal ileum WT KO WT KO 1.0×10⁻⁴ 1.0×10⁻³ 1.0×10⁻² 1.0×10⁻¹ 1×10² 1×101 Gene/GAPDH SAA1 SAA2 a WT KO WT KO 0 5 10 15 20 25 Gene/GAPDH Reg3β Reg3γ p = 0.017 p = 0.0006 p = 0.0003
log2(KO abundance)–log2(WT abundance)
KO vs. WT (–log10 p -value) e –2 0 2 4 –4 0 2.5 2 1.5 1 0.5 p < 0.05 WT KO Relative abundance (%) 0 20 40 60 80 100 W1 W2 W4 W5 Allobaculum Alloprevotella Akkermansia Alistipes Anaeroplasma Anaerotruncus Bacteroides Bifidobacterium Coprococcus Blautia CandidatusSaccharimonas D5 D_4_Coriobacteriaceae D_4_Defluvitaleaceae D_4_Lachnospiraceae D_4_Peptococcaceae D_4_Prevotellaceae D_4_Ruminococcaceae D_4_S24-7 Desulfovibrio D_3_Clostridiales Helicobacter IncertaeSedis Lactobacillus Marvinbryantia
Mouse gut metagenome Mucispirillum Odoribacter Oscillibacter Parabacteroides Prevotella RC9 gut group Rikenella Roseburia Ruminococcus Thalassosprira Turicibacter Uncultured organism KO WT f g W1 W1′ W2 W3 W3′ W1′W3W3′ W4′ W5′K3K3′K5K5′K4K4′K1K1′K2K2′ W4 W4′ W5 W5′ K1 K1′ K3 K3′ K4 K4′ K5 K5′ K2 K2′
Helicobacter Helicobacter Helicobacter
Blautia Alistipes Odoribacter S24-7 EF099831 IncertaeSedis_EU45 Ruminococcaceae_FJ8 S24-7 AY985773 S24-7 HM814426 S24-7 EF097783 Turicibacter IncertaeSedis_EU50 Ruminococcaceae_EF0 WT 0 1 2 3 p = 0.055 Mucispirillum Helicobacter WT 0 5 10 15 % of total 16S reads h WT 0 2 4 6 8 0 10 20 30 Delta Ct H. typhlonius i p = 0.049 p = 0.036 WT KO Min Mean Max KO KO KO (–)
Fig. 5 Augmented SAA and antimicrobial peptide expression in the terminal ileum of IL-21R-deficient mice and microbiome analysis of stool
samples. a, b Expression of SAA1, SAA2, Reg3γ, and Reg3β mRNAs in the terminal ileum of SFB+mice (a) compared to SFB−mice (b) by
real-time RT-PCR (n= 5–7). Data summarize 2–3 independent experiments and are represented as mean ± SEM. c-g Stool microbiome analysis.
Duplicate stool DNA samples were collected from individually housed mice and data from both duplicate samples are shown. c Three-dimensional PCoA plot based on the weighted UniFrac distance matrix. Percentage of the diversity distribution explained by each axis is
indicated on thefigure. d Alpha rarefaction plot. Shown are the average numbers of different OTUs at increasing sequencing depth. e Volcano
plot of de novo OTUs indicating taxa that are significantly increased or decreased in the pairwise comparisons using moderated t-test models.
fHeatmap of 15 OTUs identified by Volcano plot. g Relative bacterial abundance shown at the levels of order (D3), family (D4), and genus (D5).
hRelative abundance of genus Helicobacter and Mucispirillum shown as % of total 16S read counts (n= 5). i Real-time PCR analysis to compare
the levels of H. typhlonius in the stools of WT and IL-21R KO mice (WT; n= 5, KO; n = 8). (−), stool samples from Jackson C57BL/6 mice known
to be Helicobacter-negative. Data are represented as mean ± SEM.
autoimmune encephalitis model.46 Colon tissues collected from
SFB+ Helicobacter+ IL-21R KO mice at day 14 post-infection showed a striking reduction of IFNγ, IL-12, and IL-1β mRNA, which was not observed with SFB−Helicobacter−IL-21R KO mice (Fig.7g, h and Supplementary Fig. 7g-h). While 1RA, 10, Csf2, and IL-23 receptor mRNA levels in infected SFB+Helicobacter+IL-21R KO mice were comparable to those of WT littermates, KO mice showed a small, but statistically significant increase in mRNA for IL-23 (Fig. 7g). In contrast, SFB− Helicobacter− IL-21R KO mice showed higher Csf-2 and IL-17 mRNA expression than their WT littermates, which may result from higher C. rodentium burdens seen in these mice (Supplementary Fig. 7g-h). Together with the results described earlier, the most likely explanation for the striking reduction in immunopathology seen in SFB+Helicobacter+ IL-21R KO mice is that the microbiota present at higher levels in these KO mice protect against intestinal immune pathology by altering host immune responses to C. rodentium. In particular, higher levels of microbiota-driven IL-23 may inhibit IL-12 production, which in turn dampens IFNγ-mediated immune pathology, as previously demonstrated in this model.44
Finally, the similar levels of IL-22, an essential cytokine for C. rodentium clearance43 in SFB+ as well as SFB− IL-21R KO and WT mice (Fig. 7g and Supplementary Fig. 7g) are consistent with the minimal differences in bacterial clearance as discussed above.
DISCUSSION
A primary function of IgA in the gut is to maintain homeostasis with the intestinal microbiota at mucosal surfaces by limiting microbial contact with the intestinal epithelium.29 However, mechanisms for the generation of IgA against commensal bacteria are complex and not well-understood regarding the extent to which anti-commensal IgA is dependent on T cells, the nature of
the T cell populations and their signals, and the requirement of T cells for somatic hyper-mutation and selection.47Recent studies
have begun to answer these questions, reporting that homeo-static IgA responses predominantly target small intestine com-mensals, but not indigenous colonic bacteria in a T cell-independent manner39and that such antibodies are polyreactive with broad reactivity to a diverse, but defined subset of microbiota.48 In contrast, “atypical” commensal bacteria such as SFB and Mucispirillum that mainly reside in the small intestine elicit T cell-dependent IgA responses.39 Helicobacter also appears to elicit a T cell-dependent IgA response, as it is highly coated with IgA in WT, but not in TCR-deficient mice.38
In this study, we addressed the role of IL-21 in IgA and T cell responses in mice with different intestinal microbiota. We observed a reduction in IgA+ PBs and PCs in the SILP of SFB+ Helicobacter+ IL-21R KO mice compared to WT littermates, consistent with a prior study showing decreased IgA levels in the feces of both IL-21- and IL-21R-deficient mice.20Furthermore,
we found ~50% fewer post-switched IgA+ and GC B cells and reduced expression of AID in the PPs of IL-21RKO, indicating a defect in IgA CSR in these mice as previously observed in vitro.20
In contrast, PP Tfh cell numbers were similar between IL-21R KO and WT littermates indicating that in steady-state PPs, IL-21 is not required for Tfh development, as the requirement is known to be context dependent.7–9 After gaining the gut-homing markers CCR9 andα4β7, IgA+PBs generated in PPs rapidly traffic to the SILP where they differentiate to PCs.29,49 Approximately 50% decreases in both IgA+PBs and PCs without altered PB/PC ratios in the SILP of SFB+ Helicobacter+IL-21R KO mice are likely the reflection of the defective PP CSR, since post-switched IgA+B cell numbers in the SILP were similar between IL-21R KO and WT littermates. These results indicate that IL-21 is necessary neither for T cell-independent IgA CSR that occurs in small intestine ILFs nor for PC differentiation in the SILP during homeostasis.
Fox p3-APC 23.5 6.1 0.2 WT KO Isotype CD4-APCCy7 a 0.99 KO 0.06 WT SILP CD45.1-PECy5 C D 4 5 .2 -FITC 102 103 104105 0 102 103 104 105 0 0 102 103 104 105 0 102 103 104 105 15.4 77.0 0 WT KO Isotype CD4-APCCy7 RO R γ t-PE CD45.1+CD4+Foxp3–RORγt+ WT KO SI WT KO mLN WT KO PP 1×101 1×10² 1×10³ 1×10⁴ 1×10⁵ C e ll number c WT KO SI WT KOmLN WT KOPP 1×101 1×10² 1×10³ 1×10⁴ CD45.1+CD4+Foxp3+ Ce ll nu mbe r b p=0.009p=0.017 p=0.0004 p=0.01 0 102 103 104 105 102 103 104 105 0
Fig. 6 Adoptive transfer of RAG-1 OT-II naive T cells. a Representative flow cytometry plots of various CD45.1+cell populations in the SILP.
CD45.1+cells (red square) were gated on live single cells and then plotted CD4 versus Foxp3. Foxp3−cells (green square) were further gated
based on RORγt expression. b, c CD45.1+Treg (b) and Th17 cell numbers (c) in the SILP, mLNs, and PPs. Data summarize two independent
experiments (WT; n= 5, KO; n = 4) and are represented as mean ± SEM
Importantly, we found no evidence for any defects in IgA B cell generation in SFB−Helicobacter−IL-21R KO mice compared to WT. This microbiota-dependent effect of IL-21 on IgA responses is most consistent with a role in T cell-dependent IgA B cell switching in response to certain“atypical” intestinal microbiota. Therefore, the higher burdens of SFB and Helicobacter in IL-21R KO mice likely increased their contact with the intestinal epithelium due to the loss of high-affinity IgA-mediated control of commensals. Furthermore, the feces of IL-21R KO mice appeared to have higher levels of Mucispirillum, another commensal that preferentially elicits T cell-dependent IgA responses.39 Together,
our results suggest that IL-21 plays a critical role in limiting growth of atypical commensal bacteria such as SFB, Helicobacter, and Mucispirillum via enhancing T cell-dependent IgA responses to these bacteria, but plays a minimal role in controlling the majority of commensal microbiota that is targeted by T cell-independent IgA.
Another well-known function of IL-21 is its role in T cell homeostasis, especially in amplifying/maintaining Th17 cells1and suppressing Treg proliferation.11 We found that IL-21 signaling had no measurable effect on the numbers of Th17 and Treg cells in the intestine of SFB−Helicobacter−mice indicating that IL-21 is not required for intestinal Th17 or Treg cell homeostasis. Furthermore, in the presence of SFB and Helicobacter, IL-21R KO mice actually had higher numbers of Th17 cells in the small intestine, the later contrary to the established positive role for IL-21 on Th17 cell expansion via promoting IL-23R and RORγt
expression.1This Th17 cell expansion is likely the consequence of enhanced well-established effects of SFB22and possibly those of Helicobacter spp.21,23,50and other bacteria due to the decreased IgA-response and enhanced exposure to these bacteria, which overrides any potentially negative effect of IL-21 signaling deficiency on Th17 differentiation. Supporting this notion, ileal levels of SAA1, Reg3γ and Reg3β known to be induced by SFB were dramatically higher only in SFB+ Helicobacter+ IL-21R KO mice. This result also suggests that a higher level of Reg3γ is not sufficient to control SFB, consistent with a prior study demonstrat-ing the presence of multiple mechanisms in limitdemonstrat-ing SFB growth.34
Of note, it is possible that IL-21 may directly act on the IEC and contribute to control SFB as seen with IL-17 and IL-22.
The enhanced numbers of Treg cells seen only in the SILP of SFB+Helicobacter+IL-21R KO mice also indicate that IL-21 is not required for Treg cell homeostasis, but limits Treg cell expansion in the setting of exposure to atypical commensals. Together with prior studies indicating that SFB does not induce Treg cell expansion in C57BL/6 mice,26,51 our cohousing experiments showing no increased Treg cells in IL-21RKO mice cohoused with Taconic SFB+Helicobacter− mice indicate that SFB may not be responsible for driving Treg cell expansion. Since Helicobacter species are a major driver of bacteria-specific Treg cell responses in mice,21,23their enhanced presence or epithelial cell contact may be the cause of Treg cell expansion observed in SFB+ Helicobacter+IL-21R KO mice. Interestingly, in prior studies, while naive IL-21R KO mice showed a similar number of Treg cells
h 0 1 2 3 4 0 0.1 0.2 0.3 0.4 IL-1β IL-12p35 2 3 1 0 4 0.005 0 0.010 0.015 IL-10 IL-1RA Csf2 IL-23R 0 0.5 1.0 1.5 b D7 c d Colon 5 6 7 8 9 10 Colon length (Cm) 0 2 4 6 8 10
Log10 CFU/g feces 0 2 4 6 8 10
Log10 CFU/g tissues
8NC 7NC 3NC 3NC a WT KO WT KO WT KO WT KO WT KO WT KO WT KO Gene/GAPDH (×10 –4 ) 0.5 1.0 1.5 2.5 0 2.0 Naive p = 0.013p = 0.0015 p = 0.002 p = 0.0002 Infected D14 Spleen WT WT 0 3 6 9 12 Histology score e f p = 0.008 KO KO WT KO WT KO WT KO WT KO WT KO WT KO * Gene/GAPDH (×10 3) Gene/GAPDH (×10 3) Gene/GAPDH (×10 3) Gene/GAPDH (×10 –2 ) 0 1 2 3 0 0.05 0.15 0.2 0.1 IFNγ IL-17a g p = 0.002 WT KO WT KO WT KO WT KO IL-22 IL-23
Fig. 7 Strikingly reduced tissue pathology following Citrobacter rodentium infection in SFB+IL-21R deficient mice. a IL-21 mRNA levels in the
distal colon of naive mice and mice orally inoculated with C. rodentium (~2 × 10⁹CFU) at day 14 post-infection (pi). b C. rodentium burden in
the feces on day 7 (D7) and 14 (D14) pi. c C. rodentium burden in the distal colon and spleen on D14 pi. NC stands for no colonies observed.
dColon length on D14 pi. e Histology score of distal colon on D14 pi. f A representative H& E staining of distal colon. g, h Expression of various
cytokine mRNAs by real-time RT-PCR in the distal colon on D14 pi. Data were compiled from two independent experiments (n= 8) and
represented as mean ± SEM
compared to WT mice, Treg cells expanded to a greater extent in the absence of IL-21 signaling following lymphocytic choriome-ningitis virus infection or sheep RBC immunization.12,52 Further-more, Foxp3+Tregs cells were also increased in the blood of IL-21R-deficient individuals who are susceptible to chronic infec-tions.3,12 Together, IL-21 appears to play a critical role in suppressing infection- or immunization-induced Treg cell expan-sion and this may extend to conditions of exposure to certain intestinal commensal like Helicobacter.
Another important finding from our current study is that changes in the local tissue milieu that may arise from defective IgA responses to SFB and Helicobacter appear to alter mucosal Th17 and Treg responses to soluble oral antigens. Despite the fact that most Th17 cells in SFB-colonized mice were reported to recognize antigens encoded by SFB,53we observed a striking expansion of OT-II-specific Th17 cells in all tissues examined following adoptive transfer of naive OT-II cells and OVA feeding in SFB+Helicobacter+ IL-21R KO mice. Heightened SFB-mediated changes in the mLNs of these mice appear to support enhanced differentiation of naive OT-II CD4 T cells to RORγt-expressing Th17 cells which subse-quently migrate to other organs such as small intestine as proposed by Sano T et al.22 Treg induction in response to oral antigens is proposed to be stepwise processes, comprising the generation of Treg cells in the mLNs, migration into the gut, and subsequent expansion of Treg cells in the SILP.40 In contrast to Th17 cells, OT-II Foxp3+Treg cells were expanded only in the SILP, suggesting that the conversion of naive OT-II T cells to Treg cells in the mLNs is not affected by the absence of IL-21 signaling. Instead, the local SILP milieu may promote OT-II Treg cell proliferation or enhance survival. Although the mechanisms involved need to be determined, this largely Th17-skewed T cell responses may have implications for understanding food allergies, particularly IgE-independent food allergies that occur almost exclusively in non-breastfed babies. The lack of breast milk IgA may predispose these non-breastfed neonates to enhanced pathogenic T cell responses to oral antigens in the presence of particular atypical commensal microbiota. Interestingly, infant microbiota associated with allergies has been reported to promote Th17 responses in the intestine of germ-free mice.54
Finally, we addressed the effect of these microbiota-induced changes on reshaping mucosal immunity to an intestinal infection. It has been previously reported that neutralization of IL-12 or IFNγ, or a CD103+CD11b− DC-specific deficiency of IL-12 protects C. rodentium infected animals from IFNγ-mediated pathology and lethality.44Furthermore, IL-12 production is repressed by myeloid cell-derived IL-23, which is also required for host protection by inducing IL-22 and thus anti-microbial peptides. Tbet+ ILC3 can also produce IFNγ in response to IL-1β during C. rodentium infection.45 In agreement with these studies, we observed dramatically reduced IFNγ as well as IL-12 and IL-1β, but a modest increase in IL-23 in SFB+ Helicobacter+ IL-21R KO mice that showed strikingly attenuated pathology. IL-21 production was also strikingly dampened in these mice, suggesting microbiota-mediated global repression of pro-inflammatory cytokine produc-tion. Future studies will be required to understand the molecular mechanism of how microbiota-mediated changes affect responses to oral antigens and C. rodentium infection.
In conclusion, our study demonstrates microbiota-dependent, region-specific effects of IL-21 on the intestinal immune cell homeostasis and infection. IL-21 signaling appears to be critical for controlling atypical intestinal commensals/pathobionts such as SFB and Helicobacter spp. most likely by enhancing T cell-dependent IgA responses, but not for T-cell incell-dependent IgA responses to the majority of commensals. Overgrowth of these atypical commensals profoundly alters the local molecular and cellular environment, reshaping mucosal immune responses to oral antigens and intestinal infection. Finally, ourfindings may be of clinical importance regarding IL-21 or anti-IL-21 therapies in
human diseases highlighting a previously unrecognized effect of IL-21 on intestinal microbiota and possibly for the pathogenesis of food allergies in absence of breastfeeding.
METHODS Mice
Il21r−/− and Il21-mCherry and Il2-emGFP BAC dual reporter transgenic (TG) mice have been described previously.6,24Il21r−/− mice were also purchased from the Jackson laboratory. The knock-out and littermate control mice with 6 to 12 weeks of age were used. Mice were housed under specific pathogen-free conditions and used in accordance to the guidelines of the Animal Care and Use Committee at the National Institute of Allergy and Infectious Diseases.
Cell isolation, in vitro stimulation, andflow cytometry
Cells from intestinal lamina propria, Peyer’s patches, and mesenteric lymph nodes were isolated as described previously.55
For intracellular cytokine staining, LP cells (1 × 10⁶/ml) were
stimulated with 50 ng/ml of phorbol 12-myristate 13-acetate (PMA) and 500 ng/ml of ionomycin in the presence of protein transport inhibitor cocktail (eBioscience) in complete RPMI 1640 media for 4 h. Forflow cytometry, cells were pre-incubated with anti-CD16/CD32 mAb to block FcγRII/III receptors and Live/Dead-conjugated dye (Invitrogen) to gate out dead cells and then stained with variousfluorochrome-conjugated antibodies against cell surface markers on ice for 15 min. For intracellular staining, cells were fixed with BD Cytofix/Cytoperm™ (BD Biosciences) or Foxp3 fixation/permeabilization kit (eBioscience). For flow cyto-metry analysis with Il21-mCherry and Il2-emGFP Tg mice, cells were notfixed before data acquisition and calibration beads for mCherry (Takara/Clontech) and GFP single-positive cells were used for compensation. The antibodies and isotype controls were purchased from BD Biosciences, eBiosciences Inc., or Biolegend. Data were acquired using an LSR II flow cytometer with FACSDiva 6.2 software (BD Biosciences) and analyzed using the FlowJo software after gating out dead cells and non-singlets (Tree Star).
Immunohistochemistry and confocal microscopy
Tissues were harvested after perfusing Il21-mCherry/Il2-emGFP TG mice with 4% paraformaldehyde (PFA, pH 7.4 at 4 °C), furtherfixed in 4% PFA at 4 °C for 2 h, placed in 30% sucrose for 24 h, and embedded in OCT compound (Tissue-Tek) for freezing. Frozen tissue sections of 10-µm-thickness were rehydrated, blocked with 10% rat serum in 0.1% Tween-20/PBS (PBST) for 1 h at room temperature, and stained with the Alexa Fluor 647 anti-mouse B220 antibody (clone RA3-6B2, Biolegend) in 1% rat serum/ 0.1% PBST overnight at 4 °C. Nuclei were stained with 4′,6-diamidin-2-fenilindolo (DAPI). Images were acquired using a Leica TCS SP5 microscope (Leica Microsystems, Mannheim, Germany) using a ×20 objective NA .7, zoom ×1 and processed with Imaris software 9.0.0 (Bitplane AG, Zurich Switzerland).
Quantitative RT-PCR
Mouse tissues were homogenized with Lysing Matrix D (MP Biomedicals) using a Precellys homogenizer. B cells were sorted using a BD FACSAria cell sorter (BD Biosciences). Total RNA was extracted from homogenized tissues or sorted cells using RNeasy Kit (Qiagen) and cDNA was generated with qScript cDNA Synthesis Kit (Quanta Biosciences). Real-time PCR was performed on a 7900HT Sequence Detection System (Applied Biosystems) using PerfeCta FastMix II or PerfeCta SYBR Green FastMix (Quanta Biosciences). TaqMan probes were purchased from Applied Biosystems. For SAA mRNA expression, primers were synthesized and melting curve analysis was performed to ensure a single product. Quantitative expression was normalized to transcript 94
levels of GAPDH using the equation 1/2ΔCt, whereΔCt = CtTarget−
CtGAPDH.
To assess the levels of various bacteria in fecal pellets, DNA was purified using QIAamp Fast DNA Stool Kit (Qiagen). For Helicobacter typhlonius qPCR, stool samples were collected from mice housed only with the same genotype, since these bacteria were present in strikingly high levels. Primer sequences used in this study are following. SFB (forward, 5 ′-gacgctgaggcatgagagcat-3′; reverse, gacggcacggattgttattca-3′), H. typhlonius (forward, 5′-agggactcttaaatatgctcctagagt-3′; reverse, 5 ′-attcatcgtgttt-gaatgcgtca-3′), and eubacteria (forward, 5′-actcctacgggaggcag-cagt-3′; reverse, 5′-attaccgcggctgctggc-3′). ΔCt = CtSFB/Helicobacter–
CtEubacteria. To compare SFB levels in the terminal ileum, 5 cm of
tissue was homogenized after removing the luminal contents and DNA was purified using QIAamp Fast DNA Stool Kit and Genomic DNA clean & Concentrator (Zymo Research). Again, melting curve analyses were performed to ensure a single product.
Stool microbiome analysis
Stool samples were collected from littermates that were separated at weaning and then individually housed for 4 weeks. Bacterial DNA was extracted using QIAamp DNA stool kit (Qiagen) and further purified using Genomic DNA clean & Concentrator (Zymo Research). Isolated DNA was subjected to 16S rRNA gene profiling with Illumina library targeting the V3–V4 region sequenced using a miSeq sequencer. After quality control filtering, a total of 5,699,868 reads were processed with an average of 280,496 reads per sample. The de-multiplexed FASTQ files containing the 16S rRNA gene sequences werefiltered for chimeric sequences using the USEARCH (version 8.1.1831) utility’s UCHIME implementa-tion56,57 and the “gold” database (version microbiomeutil-r20110519) or CLC-bio Genomics workbench software. The reads were then binned into operational taxonomic units (OTUs) at 97% similarity using USEARCH’s cluster_otus command. The OTUs thus obtained were classified and aligned using QIIME (1.9.1) scripts.58
The assign_taxonomy.py script was used to assign taxonomy using the default RDP method59 and the Silva taxonomy
database.60 The beta-diversity measures were calculated using UniFrac61 and plotted into three-dimensional PCoA plots using Emperor.62 One wild-type duplicate sample was excluded from these analyses, because extremely low read count associated with that sample.
Adoptive transfer of RAG-1 OT-II T cells
CD4+CD3ε+CD25−T cells were sorted from the spleen of CD45.1 RAG-1−/− OT-II transgenic mice and adoptively transferred into CD45.2 wild type and IL-21R KO littermates. Individual mice were injected with 106sorted T cells intraperitoneally. 1.5% OVA (grade V; Sigma-Aldrich) in drinking water was then administered for 5 days ad libitum. On day 6, cells were isolated forflow cytometry analysis.
Citrobacter rodentium infection
Citrobacter rodentium strain DBS100 was purchased from ATCC and used for all inoculations. 6–8-week-old mice were orally gavaged with ~1–2 × 10⁹CFU in a total volume of 200 µl of PBS. To assess bacterial burdens, feces and tissues (first 0.5 cm of distal colon and spleen) in PBS were homogenized with Lysing Matrix D (MP Biomedicals) using a Precellys homogenizer. Serially diluted homogenates were then plated on MacConkey agar (HiMedia Laboratories). For histology scoring, the second 0.5 cm pieces of distal colon werefixed in 10% formalin, stained with hematoxylin and eosin, and scored as described previously (http://www.jove.
com/video/50222/the-citrobacter-rodentium-mouse-model-studying-pathogen-host). To measure cytokine levels, the third 0.5
cm of distal colon was homogenized as described above in RLT lysis buffer of RNeasy Kit (Qiagen).
Statistical analysis
Statistical analyses were performed using unpaired two-tailed Student’s t-test using Prism 7 (GraphPad Software) unless stated otherwise. Differences with p value < 0.05 were considered statistically significant. Results are presented as mean ± SEM.
ACKNOWLEDGEMENTS
This work was supported by the Division of Intramural Research, NIAID, NIH. We thank Drs. Warren Strober and Ivan Fuss (NIAID, NIH) for their critical reading of our manuscript.
AUTHOR CONTRIBUTIONS
H.C. designed and performed the experiments, interpreted the results and prepared the manuscript. H.J., R.P.O., B.K., R.S., and T.V. assisted with the experiments. T.G.M. and V.T. analyzed the microbiome data. Z.S. and J.G.F confirmed Helicobacter species by sequencing and provided valuable discussion. R.S. and W.J.L. provided IL-21R KO and IL-21mCherry transgenic mice and other reagents, valuable discussion, and critical reading of the manuscript. B.L.K supervised the research and prepared the manuscript.
ADDITIONAL INFORMATION
The online version of this article (https://doi.org/10.1038/s41385-018-0056-x) contains supplementary material, which is available to authorized users.
Competing interests: The authors declare no competing interests.
REFERENCES
1. Spolski, R. & Leonard, W. J. Interleukin-21: a double-edged sword with therapeutic potential. Nat. Rev. Drug Discov. 13, 379–395 (2014).
2. Caruso, R. et al. A functional role for interleukin-21 in promoting the synthesis of the T-cell chemoattractant, MIP-3alpha, by gut epithelial cells. Gastroenterology 132, 166–175 (2007).
3. Tangye, S. G. Advances in IL-21 biology - enhancing our understanding of human disease. Curr. Opin. Immunol. 34, 107–115 (2015).
4. Kotlarz, D. et al. Loss-of-function mutations in the IL-21 receptor gene cause a primary immunodeficiency syndrome. J. Exp. Med. 210, 433–443 (2013). 5. Linterman, M. A. et al. IL-21 acts directly on B cells to regulate Bcl-6 expression
and germinal center responses. J. Exp. Med. 207, 353–363 (2010).
6. Ozaki, K. et al. A critical role for IL-21 in regulating immunoglobulin production. Science 298, 1630–1634 (2002).
7. Zotos, D. et al. IL-21 regulates germinal center B cell differentiation and pro-liferation through a B cell-intrinsic mechanism. J. Exp. Med. 207, 365–378 (2010). 8. Nurieva, R. I. et al. Generation of T follicular helper cells is mediated by interleukin-21 but independent of T helper 1, 2, or 17 cell lineages. Immunity 29, 138–149 (2008).
9. Vogelzang, A. et al. A fundamental role for interleukin-21 in the generation of T follicular helper cells. Immunity 29, 127–137 (2008).
10. Ivanov, I. I., Zhou, L. & Littman, D. R. Transcriptional regulation of Th17 cell differentiation. Semin Immunol. 19, 409–417 (2007).
11. Attridge, K. et al. IL-21 inhibits T cell IL-2 production and impairs Treg home-ostasis. Blood 119, 4656–4664 (2012).
12. Jandl, C. et al. IL-21 restricts T follicular regulatory T cell proliferation through Bcl-6 mediated inhibition of responsiveness to IL-2. Nat. Commun. 8, 14Bcl-647 (2017). 13. Festen, E. A. et al. Genetic variants in the region harbouring IL2/IL21 associated
with ulcerative colitis. Gut 58, 799–804 (2009).
14. Stolfi, C. et al. Involvement of interleukin-21 in the regulation of colitis-associated colon cancer. J. Exp. Med. 208, 2279–2290 (2011).
15. Zorzi, F. et al. Distinct profiles of effector cytokines mark the different phases of Crohn’s disease. PLoS ONE 8, e54562 (2013).
16. Fina, D. et al. Regulation of gut inflammation and th17 cell response by interleukin-21. Gastroenterology 134, 1038–1048 (2008).
17. Salzer, E. et al. Early-onset inflammatory bowel disease and common variable immunodeficiency-like disease caused by IL-21 deficiency. J. Allergy Clin. Immu-nol. 133, 1651–1659.e12 (2014).
18. Wang, Y. et al. IL-21/IL-21R signaling suppresses intestinal inflammation induced by DSS through regulation of Th responses in lamina propria in mice. Sci. Rep. 6, 31881 (2016).
19. Wan, C. K. et al. The cytokines IL-21 and GM-CSF have opposing regulatory roles in the apoptosis of conventional dendritic cells. Immunity 38, 514–527 (2013).
20. Cao, A. T. et al. Interleukin (IL)-21 promotes intestinal IgA response to microbiota. Mucosal. Immunol. 8, 1072–1082 (2015).
21. Chai, J. N. et al. Helicobacter species are potent drivers of colonic T cell responses in homeostasis and inflammation. Sci. Immunol. 2, eaal5068 (2017).
22. Sano, T. et al. An IL-23R/IL-22 circuit regulates epithelial serum amyloid A to promote local effector Th17 responses. Cell 163, 381–393 (2015).
23. Xu, M. et al. c-MAF-dependent regulatory T cells mediate immunological toler-ance to a gut pathobiont. Nature 554, 373–377 (2018).
24. Wang, L. et al. Key role for IL-21 in experimental autoimmune uveitis. Proc. Natl Acad. Sci. USA 108, 9542–9547 (2011).
25. Ballesteros-Tato, A. et al. T follicular helper cell plasticity shapes pathogenic T helper 2 cell-mediated immunity to inhaled house dust mite. Immunity 44, 259–273 (2016).
26. Ivanov, I. I. et al. Induction of intestinal Th17 cells by segmentedfilamentous bacteria. Cell 139, 485–498 (2009).
27. Liu, S. M. & King, C. IL-21-producing Th cells in immunity and autoimmunity. J. Immunol. 191, 3501–3506 (2013).
28. Jones, L. et al. A subpopulation of high IL-21-producing CD4(+ ) T cells in Peyer’s Patches is induced by the microbiota and regulates germinal centers. Sci. Rep. 6, 30784 (2016).
29. Pabst, O. New concepts in the generation and functions of IgA. Nat. Rev. Immunol. 12, 821–832 (2012).
30. Lecuyer, E. et al. Segmentedfilamentous bacterium uses secondary and tertiary lymphoid tissues to induce gut IgA and specific T helper 17 cell responses. Immunity 40, 608–620 (2014).
31. Seo, G. Y., Youn, J. & Kim, P. H. IL-21 ensures TGF-beta 1-induced IgA isotype expression in mouse Peyer’s patches. J. Leukoc. Biol. 85, 744–750 (2009). 32. Suzuki, K. et al. Aberrant expansion of segmentedfilamentous bacteria in
IgA-deficient gut. Proc. Natl Acad. Sci. USA 101, 1981–1986 (2004).
33. Longman, R. S. et al. CX(3)CR1(+ ) mononuclear phagocytes support colitis-associated innate lymphoid cell production of IL-22. J. Exp. Med. 211, 1571–1583 (2014).
34. Kumar, P. et al. Intestinal interleukin-17 receptor signaling mediates reciprocal control of the gut microbiota and autoimmune inflammation. Immunity 44, 659–671 (2016).
35. Tanoue, T., Atarashi, K. & Honda, K. Development and maintenance of intestinal regulatory T cells. Nat. Rev. Immunol. 16, 295–309 (2016).
36. Kullberg, M. C. et al. Bacteria-triggered CD4(+ ) T regulatory cells suppress Helicobacter hepaticus-induced colitis. J. Exp. Med. 196, 505–515 (2002). 37. Schiering, C. et al. The alarmin IL-33 promotes regulatory T-cell function in the
intestine. Nature 513, 564–568 (2014).
38. Palm, N. W. et al. Immunoglobulin A coating identifies colitogenic bacteria in inflammatory bowel disease. Cell 158, 1000–1010 (2014).
39. Bunker, J. J. et al. Innate and adaptive humoral responses coat distinct com-mensal bacteria with immunoglobulin A. Immunity 43, 541–553 (2015). 40. Hadis, U. et al. Intestinal tolerance requires gut homing and expansion of FoxP3
+ regulatory T cells in the lamina propria. Immunity 34, 237–246 (2011). 41. Konkel, J. E. et al. Transforming growth factor-beta signaling in regulatory T cells
controls T helper-17 cells and tissue-specific immune responses. Immunity 46, 660–674 (2017).
42. Silberger, D. J., Zindl, C. L. & Weaver, C. T. Citrobacter rodentium: a model enteropathogen for understanding the interplay of innate and adaptive com-ponents of type 3 immunity. Mucosal Immunol. 10, 1108–1117 (2017). 43. Basu, R. et al. Th22 cells are an important source of IL-22 for host protection
against enteropathogenic bacteria. Immunity 37, 1061–1075 (2012).
44. Aychek, T. et al. IL-23-mediated mononuclear phagocyte crosstalk protects mice from Citrobacter rodentium-induced colon immunopathology. Nat. Commun. 6, 6525 (2015).
45. Seo, S. U. et al. Intestinal macrophages arising from CCR2(+ ) monocytes control pathogen infection by activating innate lymphoid cells. Nat. Commun. 6, 8010 (2015).
46. Lee, Y. et al. IL-21R signaling is critical for induction of spontaneous experimental autoimmune encephalomyelitis. J. Clin. Invest. 125, 4011–4020 (2015). 47. Lycke, N. Y. & Bemark, M. The regulation of gut mucosal IgA B−cell responses:
recent developments. Mucosal Immunol. 10, 1361–1374 (2017).
48. Bunker, J. J. et al. Natural polyreactive IgA antibodies coat the intestinal micro-biota. Science 358, eaan6619 (2017).
49. Masahata, K. et al. Generation of colonic IgA-secreting cells in the caecal patch. Nat. Commun. 5, 3704 (2014).
50. Morrison, P. J. et al. Th17-cell plasticity in Helicobacter hepaticus-induced intestinal inflammation. Mucosal Immunol. 6, 1143–1156 (2013).
51. Atarashi K et al. Science. 331, 337–341 (2011).
52. Schmitz, I. et al. IL-21 restricts virus-driven Treg cell expansion in chronic LCMV infection. PLoS Pathog. 9, e1003362 (2013).
53. Yang, Y. et al. Focused specificity of intestinal TH17 cells towards commensal bacterial antigens. Nature 510, 152–156 (2014).
54. Petursdottir, D. H. et al. Early-life human microbiota associated with childhood allergy promotes the T helper 17 axis in mice. Front Immunol. 8, 1699 (2017).
55. Kole, A. et al. Type I IFNs regulate effector and regulatory T cell accumulation and anti-inflammatory cytokine production during T cell-mediated colitis. J. Immunol. 191, 2771–2779 (2013).
56. Edgar, R. C. Search and clustering orders of magnitude faster than BLAST. Bioinformatics 26, 2460–2461 (2010).
57. Edgar, R. C., Haas, B. J., Clemente, J. C., Quince, C. & Knight, R. UCHIME improves sensitivity and speed of chimera detection. Bioinformatics 27, 2194–2200 (2011).
58. Caporaso, J. G. et al. QIIME allows analysis of high-throughput community sequencing data. Nat. Methods 7, 335–336 (2010).
59. Wang, Q., Garrity, G. M., Tiedje, J. M. & Cole, J. R. Naive Bayesian classifier for rapid assignment of rRNA sequences into the new bacterial taxonomy. Appl. Environ. Microbiol 73, 5261–5267 (2007).
60. Quast, C. et al. The SILVA ribosomal RNA gene database project: improved data processing and web-based tools. Nucleic Acids Res. 41, D590–D596 (2013).
61. Lozupone, C. & Knight, R. UniFrac: a new phylogenetic method for comparing microbial communities. Appl. Environ. Microbiol. 71, 8228–8235 (2005). 62. Vazquez-Baeza, Y., Pirrung, M., Gonzalez, A. & Knight, R. EMPeror: a tool for
visualizing high-throughput microbial community data. Gigascience 2, 16 (2013).
Open Access This article is licensed under a Creative Commons Attribution 4.0 International License, which permits use, sharing, adaptation, distribution and reproduction in any medium or format, as long as you give appropriate credit to the original author(s) and the source, provide a link to the Creative Commons license, and indicate if changes were made. The images or other third party material in this article are included in the article’s Creative Commons license, unless indicated otherwise in a credit line to the material. If material is not included in the article’s Creative Commons license and your intended use is not permitted by statutory regulation or exceeds the permitted use, you will need to obtain permission directly from the copyright holder. To view a copy of this license, visithttp://creativecommons. org/licenses/by/4.0/.
© The Author(s) 2018