Publisher’s version / Version de l'éditeur:
Journal of Structural Engineering, 142, 9, 2016-06-02
READ THESE TERMS AND CONDITIONS CAREFULLY BEFORE USING THIS WEBSITE. https://nrc-publications.canada.ca/eng/copyright
Questions? Contact the NRC Publications Archive team at
[email protected]. If you wish to email the authors directly, please see the first page of the publication for their contact information.
NRC Publications Archive
Archives des publications du CNRC
This publication could be one of several versions: author’s original, accepted manuscript or the publisher’s version. / La version de cette publication peut être l’une des suivantes : la version prépublication de l’auteur, la version acceptée du manuscrit ou la version de l’éditeur.
For the publisher’s version, please access the DOI link below./ Pour consulter la version de l’éditeur, utilisez le lien DOI ci-dessous.
https://doi.org/10.1061/(ASCE)ST.1943-541X.0001545#sthash.3xdbK88L.dpuf
Access and use of this website and the material on it are subject to the Terms and Conditions set forth at
Risk-based decision making for sustainable and resilient infrastructure
systems
Lounis, Zoubir; McAllister, Therese P.
https://publications-cnrc.canada.ca/fra/droits
L’accès à ce site Web et l’utilisation de son contenu sont assujettis aux conditions présentées dans le site LISEZ CES CONDITIONS ATTENTIVEMENT AVANT D’UTILISER CE SITE WEB.
NRC Publications Record / Notice d'Archives des publications de CNRC:
https://nrc-publications.canada.ca/eng/view/object/?id=8b2bceaa-5a38-4c47-82c0-4c960717dee8 https://publications-cnrc.canada.ca/fra/voir/objet/?id=8b2bceaa-5a38-4c47-82c0-4c960717dee8
Risk-Based Decision Making for Sustainable and Resilient Infrastructure Systems
Zoubir Lounis1and Therese P. McAllister2
Abstract: The development of infrastructure systems that are sustainable and resilient is a
challenging task that involves a broad range of performance indicators over the system life cycle that affect system functionality and recovery. Sustainability indicators address economic, social, and environmental performance metrics and resilient indicators address strength, functionality, and recovery time metrics following a hazard event. Sustainable systems consider environmental impact and conservation of non-renewable resources over the life of the system. Resilient systems consider performance levels relative to potential damage levels and recovery times from events. Both concepts address adequate system performance and life cycle costs, but put a different emphasis on other indicators. Numerous sources of uncertainties associated with the life cycle performance of infrastructure systems require the use of a risk-informed decision making approach to properly account for uncertainties and to identify cost-effective strategies to manage risk. A framework for risk-informed decision-making for the life cycle performance of infrastructure facilities that includes consideration of sustainability and resilience is presented. Separate examples are provided for the same highway bridge deck system to illustrate sustainable and resilient performance objectives with the design and rehabilitation of highway bridge decks. The sustainability assessment considers the effect of corrosion degradation mechanisms on life cycle costs, environmental impact (CO2 and waste), and social impacts (accidents and user time) while maintaining service life and structural safety. The resilience assessment considers the effect of seismic hazard events on structural damage levels, and recovery time while maintaining system functionality and structural safety.
Introduction
Structural systems constitute the backbone of several infrastructure systems, such as bridges, buildings, tunnels, power plants, dams and power plants, which enable transportation of people and goods, provide shelter, water and energy, and are critical to the economic growth and sustainability of communities. Structural systems are designed and maintained to withstand demands imposed by (1) their service requirements, (2) hazards, such as wind, earthquake, flood, and impact, and (3) deterioration effects from corrosion, cracking, and fatigue. In addition to criteria for strength, stiffness, and serviceability, design choices may include factors related to sustainability and resilience of systems.
Sustainability is broadly defined as meeting needs of the present without compromising the future. Sustainable development practices are a response to concern for environmental protection, reduction of consumption of non-renewable resources, climate change adaptation,
1Senior Research Officer, MASCE, Civil Engineering Infrastructure, National Research Council Canada, Ottawa,
ON K1A0R6 (Corresponding Author). Email: [email protected].
2Research Structural Engineer, FASCE, Materials and Structural Systems Division, National Institute of Standards
and the consideration of social equity and economic development for infrastructures and communities. Sustainable or “green” systems consider environmental impacts for the initial design and subsequent rehabilitation choices; such as whether a construction material, structural system, construction method or maintenance plans have a beneficial or neutral impact on the environment.
Resilience of communities is a concept that has arisen from observing repeated severe damage to communities and regions from hazards. Resilience is broadly defined as “the ability to prepare for and adapt to changing conditions and withstand and recover rapidly from disruptions” (PPD-21 2013). There is a growing recognition by communities and designers that the extent of damage and loss of functionality in the built environment following a hazard event needs to be reduced. At a minimum, functionality of essential systems should be maintained or rapidly restored.
Both of these concepts need to be applied at a community level to determine appropriate performance criteria of all infrastructure systems in a community. This paper does not address the community performance criteria, but focuses on the application of sustainability and resilience concepts to infrastructure systems with the assumption that the performance goals are based on established community needs.
A large portion of North America’s infrastructure is located in zones susceptible to natural hazards (e.g., along coastlines, in the wild land-urban interface, and in earthquake-prone regions). The primary performance goals of adequate system strength, stiffness, and serviceability are addressed in sustainable and resilient designs. Additionally, exposed infrastructure systems (e.g., bridges) address system degradation effects on the performance goals. Considerable uncertainties are associated with the life cycle performance of infrastructure, which requires the use of a risk-informed decision making approach to properly account for the uncertainties and to identify cost-effective strategies to manage risk.
This paper presents a framework for risk-informed decision-making for the life cycle performance of infrastructure facilities that includes consideration of sustainability and resilience. A highway bridge deck, which is a component of a bridge system, is used as a simple example to demonstrate the proposed methodology for the purposes of this paper. First, sustainability and resilience issues are reviewed, and then a comparison of performance goals and metrics is presented. The sustainability example is based on Canadian data sources provided by the first author. The resilience example uses U.S. seismic data provided by the second author. Since construction practices for reinforced concrete bridges are consistent between Canada and the U.S., the findings are applicable for Canada and the U.S.
Overview of Infrastructure Sustainability
Sustainable development became an important issue after the release of Bruntland’s Report, World Commission on Environment and Development (WCED 1987), often referred to as “Our
Common Future”. It defined sustainable development as the “Development that meets the needs of the present without compromising the ability of future generations to meet their own needs."
considered in the design, construction and long term operation and maintenance of infrastructure systems.
Fig. 1 has a simple schematic that compares two designs of an infrastructure system. Performance is a generic term that can refer to performance measures at serviceability or ultimate limit states. The end of life is reached when performance reaches the limit state. Fig. 1 illustrates a structure with an initial design that had a high rate of degradation and short service life identified as “service life 1”. At the end of service life 1, a repair, or rehabilitation or replacement is done for the structure that provides a service life 2, which is much longer than service life 1. It can be stated that the second design of the structure is more sustainable than the initial design. The longer service life better meets ‘sustainable’ criteria relative to the intended life cycle.
For example, in North America, highway bridges built in the 1950’s to 1970’s were intended to have design lives of 50 to 100 years; however many showed signs of degradation after only 20 to 30 years. It was found that many bridges had insufficient redundancy and were fracture critical, where failure of tension members could result in bridge collapse (Barsom and Rolfe 1999, Agrawal et al 2010). This led to an increase in inspection and development of condition rating systems as required by the U.S. Federal-Aid Highway Act of 1968, and similar requirements in provincial and federal jurisdictions in Canada. As a result, considerable funds were spent on the inspection, repair, rehabilitation and replacement of bridges in order to reduce their risk of failure. In some instances, posting (or load restriction) of bridge capacity limits was required due to a lack of funds to repair structurally deficient bridges.
Sustainable infrastructure can be achieved through three performance measures, namely: (i) Economic measures that address a long service life with minimum maintenance and life cycle costs; (ii) Environmental measures that address appropriate materials and construction with minimal impact on environment during the construction, maintenance, and demolition; and (iii) Social measures that address public safety, health, security and social equity.
The construction, operation and maintenance of buildings and infrastructure systems consume considerable amounts of energy, materials, water and land, which have large impacts on the environment, including greenhouse gas emissions, smog, water contamination, etc. There is a need to protect the natural environment by developing design and rehabilitation strategies that minimize the impact on the natural environment, including air, water, soil, flora and fauna. It is also imperative to ensure that buildings and infrastructure systems contribute to the socio-economic development of communities by ensuring public safety, health and security, reliability of service, access to service, and low long term operation and maintenance costs.
Seven performance measures that address the social, economic and environmental sustainability criteria were identified in a new framework for the sustainable design and performance assessment of public infrastructure namely: public safety, public health, public security, mobility, environment quality, social equity and the economy (NRC 2009). These measures are adapted from the Elkington’s popular metaphor of the “Triple Bottom Line” evaluation approach or so-called pillars of sustainability as shown in Fig.2, i.e. social development/equity, environmental protection, and economic prosperity (Elkington 1997).
Overview of Infrastructure Resilience
Many definitions for the term resilience are found in the literature, with distinctions depending on the intended scope or application. Broad definitions address many aspects of a resilient community—security, protection, emergency response, business continuity, and social issues related to human health, safety, and general welfare, as well as integrity of physical infrastructure systems. In this paper, infrastructure resilience refers to the capacity of physical systems to resist hazards, minimize loss of functionality, and reduce recovery times and costs. Both discrete hazard events and long-term degradation mechanisms, such as corrosion and fatigue that reduce structural capacity, are referred to generally as ‘hazards’ in the following sections.
The resilience of an infrastructure system depends on the role of the system within the community. For example, essential facilities and the infrastructure systems that serve them, such as power, transportation, and communication systems, need to have similar performance criteria for continuity of operation, acceptable damage levels for a hazard event, and rapid recovery to full functionality. A hospital should continue to provide essential medical functions after an event, but some damage may be tolerable if functionality is not impaired. Local damage to the building envelope, structural frame, or utilities that can be rapidly repaired and does not endanger the occupants might be considered acceptable. Similarly, if a bridge is required for access to the hospital, the bridge needs to remain functional.
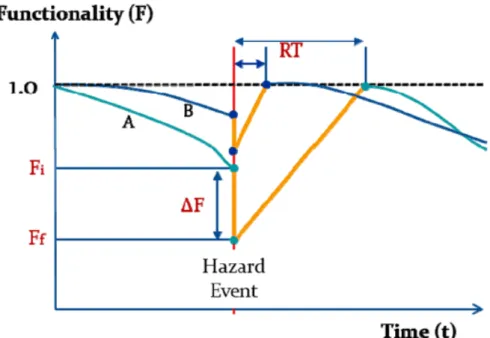
Fig. 3 illustrates the concepts of functionality and recovery time on the resilience of an infrastructure system. Lost functionality is the cumulative effect of damage on the ability of the system to operate and meet its intended purpose. The recovery time typically depend on the condition of the infrastructure system when a hazard event occurs, including its design criteria, degree of degradation, and level of maintenance. As communities are comprised of new and existing buildings and infrastructure systems, only a fraction of the built environment is recently constructed or maintained to current codes and standards. Recovery time depends on the type of construction, extent of damage, damage to other infrastructure systems that support the recovery process, and availability of equipment and materials. Proactive mitigation steps taken to improve the performance of the infrastructure system prior to disruptive events may considerably shorten the time to full recovery. Systems may be rehabilitated to perform at a higher level of performance, or they may not be able to reach pre-event levels of performance within acceptable costs or time periods. However, recovery of infrastructure systems following disruptive hazard events is rarely planned, resulting in highly uncertain times to full recovery and economic impacts to the community. The uncertainty is compounded by interdependencies between damaged infrastructure systems.
McAllister (2013) summarized the development of resilience concepts through a history of government and private organization responses to disaster events, starting with Hurricane Andrew in 1992. Research needs were identified, based on the input of leaders of engineering practice, the research community, and the standards development community during workshops in 2011. Research needs identified include development of: risk-based performance goals for resilient communities; tools and metrics to support quantitative technical assessment, policy development, and decision making; and guidelines on risk-based performance goals and criteria for inclusion in standards for voluntary reference.
Several researchers have proposed quantifiable metrics for resilience, but such metrics are still being developed for general use. Cimellaro, Reinhorn, and Bruneau (2010) examined the probability of damage and recovery time for hospitals following a seismic event to illustrate a quantitative definition of resilience for technical and organizational use. Frangopol and Bocchini (2011) used an optimization criterion for rehabilitation schedules of a network of bridges subject to earthquake events. Bocchini and Frangopol (2012) presented a general framework for optimizing rehabilitation levels and cost-based prioritization of bridges within a highway segment after a hazard event. Francis and Bekera (2014) presented resilience metrics for infrastructure systems based on the speed of recovery and performance levels prior to and immediately after an event, as well as final recovery levels, with an example for electric power. Comparison of Sustainability and Resilience Concepts
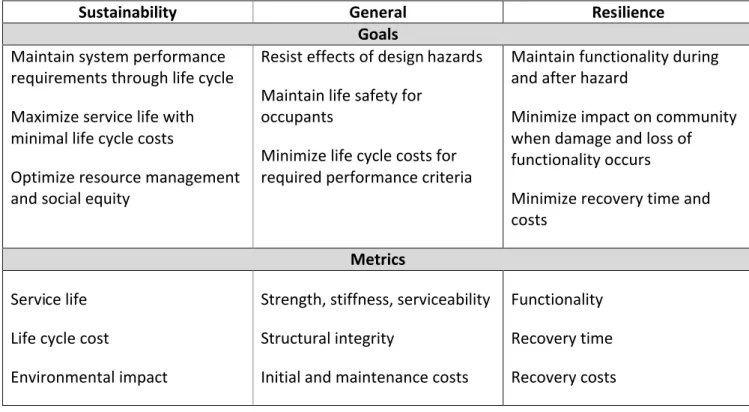
Sustainability and resilience concepts have evolved in a mostly parallel fashion to meet the cited concerns. There are some commonalities between the two concepts in terms of performance goals, and some distinct differences. A comparison of general performance goals and metrics for sustainability and resilience is shown in Table 1. Both concepts are based on general
performance goals for all infrastructure systems: resist the effects of specified hazards (both discrete hazard events and ongoing degradation effects), maintain life safety for occupants, and minimize life cycle costs. These goals are achieved by ensuring adequate strength, stiffness, and structural integrity of the structural system, as well as meeting required serviceability criteria. Life cycle costs for designs that meet the performance goals are evaluated by considering initial construction costs and long term maintenance costs.
Sustainability and resilience concepts have evolved in a mostly parallel fashion with the following viewpoints and performance goals:
Sustainability considers economic, social, and environmental impacts, such as reduced energy consumption and minimizing the waste stream over the life cycle of the structure. Design solutions tend to optimize structural designs for a long service life with minimal maintenance costs and social and environmental impacts. Recovery from hazard events is typically not explicitly considered.
Resilience considers economic, social, and community impacts, as well as system performance and recovery of system functionality. Design solutions tend to optimize structural designs for minimal loss of function and damage during hazard events, as well as minimal recovery times. Environmental impacts beyond those currently required, such as potential releases of hazardous materials, are not explicitly considered.
There are some commonalities between the two concepts in terms of performance goals, and some distinct differences. A comparison of general performance goals and metrics for sustainability and resilience is shown in Table 1. Both concepts are based on general performance goals for all infrastructure systems: resist the effects of specified hazards (both discrete hazard events and ongoing degradation effects), maintain life safety for occupants, and minimize life cycle costs. These goals are achieved by ensuring adequate strength, stiffness, service life and structural integrity of the structural system, as well as meeting required serviceability criteria. Life cycle costs for designs that meet the performance goals are evaluated by initial and life cycle maintenance costs.
Fig. 4 illustrates the potential interdependence of sustainability and resilience concepts for a system. The loss of functionality during a discrete hazard event depends on the initial structural design and performance. The degree of resistance depends on the system capacity at the time of the hazard event, as indicated by the more and less sustainable systems in Fig. 4, which indicate relative rates of degradation in system performance based on initial design decisions. Recovery time to previous levels of functionality also depend on the condition of the system when the event occurs. The minimum acceptable performance level is the point where the system no longer can meet its intended purpose or function, and maintenance or rehabilitation is required.
Risk-Based Decision Making Framework for Sustainable and Resilient Structures Risk-based decision making
Risk-based decision making, also referred to as risk informed decision making (RIDM), is a framework that facilitates a rational, balanced approach to evaluating the effect of hazards on systems, possible failure modes, and associated consequences. This approach has been used for decades for nuclear power plants (INSAG 2011), dams (Bureau of Reclamation 2011), aerospace systems (NASA 2010), and infrastructure systems (Ellingwood 2005) to identify acceptable designs for low probability, high consequence events with significant uncertainties.
A risk-based decision making framework for engineered systems has four basic steps (JCCS 2008, NASA 2010, RIMS 2011):
i. Identify failure modes for an engineered system subject to identified hazards; ii. Analyze the probability of failure for all relevant limit states;
iii. Evaluate the consequence of failure through loss of life, property and business losses, indirect economic impacts, etc.; and
iv. Select risk mitigation and treatment and/or system design.
The first two steps evaluate the proposed system design, which is based on the sustainable or resilience goals that are considered. The degree to which the general sustainability or resilience goals are met is indicated by evaluation of the consequences of failure to meet the specified limit states.
Risk mitigation assessment methods may include cost-benefit analysis, a performance-based approach, or multi-objective or multi-criteria decision analysis. In multi-criteria decision analysis, it is possible to determine the most effective solution when considering multiple and conflicting criteria where a solution is optimal for the economic criterion, a different solution can be optimal for the environmental criterion and another one is optimal for the social criterion. Several approaches have been developed to solve multi-criteria decision-making problems, including multi-attribute utility theory, weighted sum approach, compromise programming, constraint approach, and sequential optimization (Koski 1984; Lounis and Cohn 1995; Frangopol et al. 2005). In multi-criteria decision-making problems, the notion of optimality is not that obvious because of the presence of multiple, incommensurable and conflicting criteria. In general, there is no single optimal (non-dominated or superior) solution that simultaneously yields a minimum (or maximum) for all performance criteria. The Pareto optimality concept has been introduced as the solution to multi-criteria optimization problems (Koski 1984). A solution is said to be a Pareto optimum if and only if there exists no design option in the feasible set of
alternatives that may yield an improvement of some criterion without worsening at least one other criterion. In general, there are several Pareto optimal solutions (also called non-dominated solutions) for a multi-criteria optimization problem. Once the set of Pareto optima is generated, the “best” solution that achieves the best compromise between all competing objectives is sought. Such a solution is referred to as “satisficing” solution in the multi-criteria optimization literature (Koski 1984; Lounis & Cohn 1995, Frangopol et al. 2005). In goal setting and compromise programming, the concept of “satisficing” solution is introduced as a solution to a multi-criteria optimization problem where decision-makers identify a set of satisficing solutions. In addition the concept of ideal solution is introduced, which is defined as the solution that yields minimum (or maximum) values for all criteria. Such a solution does not exist, but is introduced in compromise programming as a target or a goal to get close to, although impossible to reach. The final optimal solution can then be determined as the solution that minimizes the distance from the so-called “ideal solution”.
When risk-based decision making is used to design or evaluate design alternatives or mitigation strategies, it is often coupled with a performance-based design methodology, to allow explicit evaluation of failure modes and limit states of interest. Risk mitigation strategies may include inspection and maintenance schedules or repair/renovation options for existing structures. Consideration of sustainability and resilience goals, such as those shown in Table 1, can also be addressed through performance goals and associated acceptance criteria and/or limit states.
Hazards
A hazard is any event or condition that imposes load effects on a system, affects the system strength or serviceability, or impairs the intended performance of a system. Hazards are often described as natural hazards or human-made hazards. Examples of natural hazards include wind (e.g., derecho, hurricanes, and tornadoes), earthquake, snow, ice, riverine flooding, storm surge, tsunamis, ocean waves, wildfire, liquefaction, and landslides. Human-made events include blast, impact, arson fires, chemically induced degradation, and load cycling from vehicles. Note that many of these events are discrete events relative to the life of the system. Additionally, degradation mechanisms also affect structural resistance through progressive cumulative damage over the life of the system through corrosion, fatigue, cracking, spalling, etc.
Some hazards have well established design criteria based on probabilistic models and reliability criteria founded on engineering design practice, engineering mechanics, and historical records of hazard events, including wind, earthquake, snow, ice, and flood loads. Similarly, well established design criteria have been developed for fatigue and corrosion based on validated models of degradation mechanisms. Hazards that do not have established design criteria often use a scenario-based format, where the hazard effect is evaluated using assessments conditional upon the postulated hazard scenario. Hazards that are treated in this fashion include extraordinary events, such as fire following earthquakes, tsunamis, tornadoes, blast, and impact events.
Probability of failure
The probability of failure, or exceedance of a limit state, is evaluated for a period of time. The period of time can be the expected life of the system, or it can be annualized to provide a uniform basis for comparison. For a particular hazard, the probability of failure, Pf or [ ] , or the probability of failure given a hazard scenario H, [ | ], can be determined with the following equations assuming that the limit states are disjoint or mutually exclusive (Ellingwood 2001, 2011):
[ ] = ∑ ∑ [ | ] [ ] (1)
[ | ] = ∑ [ | ] (2)
where P[H] is the probability of the occurrence of the hazard level H and P[LS|H] is the conditional probability of reaching a limit state LS for hazard H. The total probability of failure is found by summing all failure probabilities for each hazard and limit state. P[LS|H] provides a conditional probability of failure for a selected hazard scenario, H.
Consequences of failure
Consequences provide context of limit state failures by examining the potential impact on the community, stakeholders, occupants, and users. With regards to the three measures of sustainability, the consequences of failure can be grouped as:
Social consequences: fatalities, injuries, illnesses, psychological trauma, reputation damage, reduction/ loss of service, public fear, loss of political support
Economic consequences: deterioration of structural system, damage to contents, loss of income, loss of productivity, delays in service delivery, users’ costs
Environmental consequences: irreversible environmental damage (depletion of resources, extinction) and reversible environmental damage (pollution, oxygen depletion in bays). With regards to resilience, there may be similar social and economic consequences of failure. Additional resilience consequences may include:
Functionality consequences: loss of community service, loss of facility use for its intended function, loss of other systems or services due to dependence on damaged systems.
Recovery consequences: time to restore system functionality results in delays and losses in restoration of other systems, costs to restore system reduce or delay funding for other services and systems
Consequences for risk assessment purposes are often expressed probabilistically as losses. The probability of losses due to failure is obtained by multiplying the probability of failure in Equation (1) or (2) by the probability of losses which is obtained by one of the following equations based on the familiar theorem of total probability (Ellingwood 2011):
[ > ] = ∑ ∑ [ > | ] [ | ] [ ] (3a)
in which P(H) = probability of occurrence of hazard H; P[LSH]=conditional probability of the limit state LS given the occurrence of H; and P[Loss>LLS]= probability of loss exceeding L given the limit state LS; and L= loss metric based on the performance goals and acceptable risk levels. Loss metrics provide quantitative criteria for evaluating consequences and often include public safety, property protection, business continuity, or economic losses. Assuming that D is independent of H conditional to LS and event (Loss>L) is independent of LS and H conditional to D, if the hazard is defined in terms of a scenario (or set of scenarios) Hs, the probability of loss given scenario Hsbecomes:
[ > | ] = ∑ [ > | ] [ | ] (3b) Some analysis methods determine degrees of damage when a limit state is exceeded. When such an approach is used, damage states are included in the risk assessment and Eq.(3a) becomes:
[ > ] = ∑ ∑ ∑ [ > | ] [ | ] [ | ] [ ] (4a)
[ > | ] = ∑ ∑ [ > | ] [ | ] [ | ] (4b)
where D is a damage state (e.g., slight, moderate, severe).
Challenges for sustainability and resilience in risk-based decision making
Two challenges for addressing sustainable and resilient alternatives in a risk-based analysis are developing criteria to assess the performance and consequences of failure and quantifying uncertainties in the risk analysis. Criteria may need to address emergency response, the ability to shelter in place, functionality of critical facilities and infrastructure, rapid return to work by the community population following disaster events, environmental protection, and minimizing waste to landfills. Significant sources of uncertainty may exist in the definition of hazards, simulating system response beyond first yield, determining the degree of damage due to events or degradation effects, environmental impacts, and costs for initial construction, maintenance, and repairs.
The following sections present risk-informed decision-making for sustainability and resilience concepts in the design and rehabilitation of highway bridge decks. The sustainability assessment considers the effect of corrosion degradation mechanisms on life cycle costs, environmental impact (CO2and waste), and social impacts (accidents and user time) while maintaining service life and structural safety. The resilience assessment considers the effect of seismic hazard events on structural damage levels, and recovery time while maintaining system functionality and structural safety.
Example 1: Risk-Based Design and Management of Sustainable Highway Bridge Decks
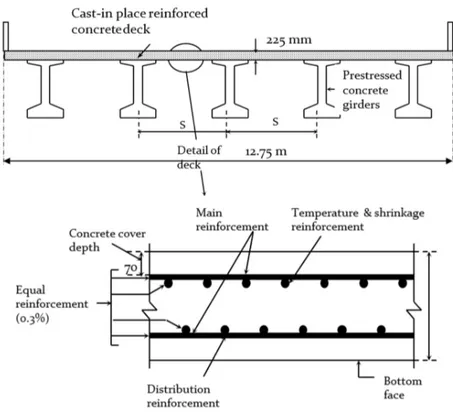
In North America, a significant ‘hazard’ for highway bridge decks is deterioration by chloride-induced corrosion of the reinforcement. The primary source of chlorides is de-icing salts applied to roadways and bridges for effective vehicle mobility and public safety during winter. For this hazard, most reinforced concrete (RC) bridge deck failures are due to loss of serviceability and functionality. The probability of collapse of bridge decks is rather low due the considerable reserve strength against punching failure, which is due to the compressive membrane arching action. The simplified bridge deck design method of the Canadian bridge design standard (CSA 2006) is used, which requires only a nominal isotropic reinforcement of 0.3% for both top and bottom layers of reinforcements in both transverse and longitudinal directions.
Several alternatives have been used to build long life bridge decks, including high performance concrete, corrosion-resistant reinforcement (stainless steel, galvanized steel, epoxy-coated steel),
protective membranes, fiber-reinforced polymers, etc. In this example, the focus will be on comparing the life cycle performance of highway bridge decks designed with high-performance concrete and normal performance concrete, in terms of the three measures of sustainability defined above, including service life, life cycle cost, and environmental and social impacts. The high performance concrete (HPC) contains 25% of fly as replacement for cement, and has a 28-day compressive strength of 45 MPa. The normal performance concrete (NPC) has a water/cement ratio of 0.4 and a 28-day compressive strength of 30 MPa. The deck reinforcement consists of #10 (metric or #3) conventional carbon steel rebars with yield strength of 400 MPa for both NPC and HPC bridge decks. Bridge dimensions and traffic data are presented in Fig. 5 and Table 2.
Sustainability performance goals
The performance goals for this sustainability analysis are to minimize life cycle costs, environmental impact (CO2and construction materials waste), and social impact (accidents and user time) and maximize service life, while maintaining structural safety.
Hazards and consequences of failure
The primary hazard considered here is corrosion of the reinforcement induced by de-icing salts used during winter for public safety. The consequences include:
Social impacts: time lost by vehicle drivers due to traffic delays and increased accident costs due to use of detours during inspection, repair and rehabilitation of bridge decks; Environmental: CO2 emissions and potential for climate change and waste generated
during repair and rehabilitation of bridge decks; and
Economic: life cycle costs for bridge owner and road users.
Modeling of time-varying probability of failure of bridge decks in corrosive environments
The service life of RC decks subjected to de-icing salts can be predicted using reliability-based analytical models that predict the time it will take before chloride ingress and subsequent corrosion-induced damage of the concrete cover reduce the serviceability of the deck to an unacceptable level. These models take into account the variability of the main physical parameters and the different types of uncertainties associated with the modeling of these complex processes. The chloride ingress into concrete is modeled using Crank's solution of Fick's second law of diffusion (Crank 1979), which is given by:
( , ) = [1 − erf( )] (5a)
where C (x,t) = chloride concentration at depth x after time t; Cs = chloride concentration at the deck surface; Dc= coefficient of diffusion of chloride ions into concrete; and erf = error function, which is related to the cumulative normal distribution Φ as follows:
The time to corrosion initiation (ti) is determined as the time at which the chloride concentration at level of the outer steel reinforcement layer reaches the chloride threshold value (Cth). Replacing C(x,t) by Cthand x by c, Equation (5a) then becomes:
= (6)
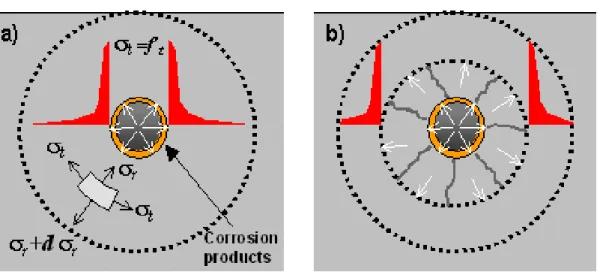
The times to reach different limit states of corrosion-induced damage (see Fig. 6 and Fig. 7) are estimated based on the thick-wall cylinder model (Timoshenko 1956). The accumulation of corrosion products over time generates contact pressures between the rebar and the surrounding concrete, which initiate cracks when the tensile stresses in the concrete cover reaches the tensile strength (f’t). The mechanical behaviour of the corroding rebar and surrounding concrete system and its stress analysis can be simplified by modelling the rebar-concrete cover system as a thick-walled cylinder, which is subjected to the action of uniformly distributed pressure assuming that concrete is an homogeneous elastic material (Bažant 1979; Lounis et al. 2006). The external radius and internal radius of the thick-walled concrete cylinder are defined by the concrete cover depth (c) and rebar diameter (d). The deformation is assumed symmetrical with respect to the cylinder axis and consists of a radial displacement of all points in the wall of the cylinder. Radial compressive stresses (r) and tangential tensile stresses (t) are generated in the concrete cover by the internal pressure (pi) due to the expansion of the corrosion products.
After the propagation of an internal crack through the entire concrete cover, the stresses generated by the accumulation of corrosion products around the reinforcing bar will be sustained until part of the cover spalls off or delaminates. The corresponding propagation times to onset of spalling is given by the following equation:
c
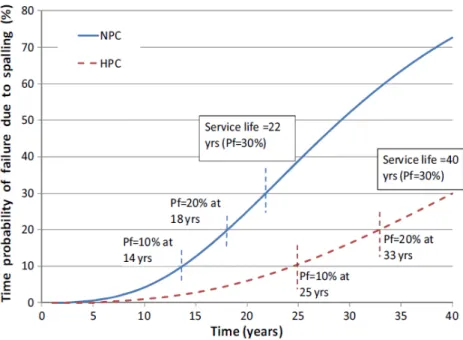
t s r r sp p E f d cd d c c d Sj t ' 2 2 ) ( 2 2 1 1 2 (7)where S is the rebar spacing; ρris the density of corrosion products (assumed at 3600 kg/m3for Fe(OH)3); ρsis the density of steel (7860 kg/m3); α is the molecular weight ratio of metal iron to the corrosion product (assumed at 0.52); and jr is the corrosion production rate per unit area (Bažant 1979). This model allows determination of the rebar diameter increase related to the different corrosion-induced damage limit states. For this example, it is considered that the end of service life or serviceability limit state of RC decks in corrosive environments is reached when an estimated 30% of the deck area is spalled. Using the models briefly described above, it is estimated that this condition is reached after 22 years for the NPC deck and after 40 years for the HPC deck, as illustrated in Fig. 8. The data for the service life parameters of both replacement alternatives are given in Table 3.
The performance functions that describe the above failure modes or limit states are complex nonlinear functions of several parameters. The uncertainty in the models and parameters is taken into account by modeling all governing parameters as random variables. These
performance functions depend on several variables (e.g. concrete cover, diffusion coefficient, corrosion rate, bar diameter, bar spacing, etc.). The generalized performance function of an RC bridge deck is defined as follows:
g (X)= g (X1, X2,…,Xn) (8a)
where X= (X1, X2,…,Xn) is the vector of the performance variables of the deck, and the function g(X) defines the performance, and consequently the service life of the deck. As discussed in the previous sections, the considerable variability and uncertainty of the parameters that govern the chloride ingress into concrete, corrosion initiation, rate of corrosion and accumulation of corrosion products, cracking, spalling and delamination (concrete cover, chloride threshold, diffusion coefficient, surface chloride concentration, rate of corrosion) require the use of probabilistic models in which all governing parameters are modelled as random variables to provide reliable and meaningful predictions of the life cycle performance of RC bridge decks, as shown in Table 3.
The time-dependent probability of failure Pf(t) is the probability that (Pf=P[g(X)≤ 0]) at a given time. The time-dependent probability of failure, in which failure can be defined as reaching critical chloride concentration, or onset of corrosion, or onset of cracking, or spalling or delamination, can be formulated as follows:
( ) = ( < ) (8b)
( ) = + < (8c)
The determination of the time-dependent probability of failure is a complex problem due to the high level of nonlinearity of the performance functions. In this paper, the advanced first-order reliability method (FORM) is used to determine the probability of failure for the above
performance functions. Hasofer and Lind (1974) proposed a non-homogenous linear mapping of the set of basic variables into a set of normalized and uncorrelated variables. The determination of the probability of failure can be formulated as a nonlinear optimization problem, in which the solution that minimizes the distance from the origin to the failure surface in the standard normal space, subject to the constraint g(X) =0 is sought. This minimum distance was defined as a measure of the reliability index by Hasofer and Lind (1974). FORM requires the gradient of the limit state function. Different numerical algorithms have been proposed to determine the
reliability index. In this paper, Rackwitz and Fiessler’s algorithm (1978) was used to determine the reliability index. Once the reliability index (β) is determined, the probability of failure can be estimated as follows:
( ) = 1 − Φ( ) (8d)
For the failure mode of spalling of the concrete bridge deck, the time-dependent probabilities of failure for the normal concrete deck and high performance concrete deck are shown in Fig. 8.
Assessment of maintenance, repair and rehabilitation costs
Once the time-varying probability of failure is determined, where failure is defined as spalling of the concrete bridge deck, different maintenance, repair and replacement actions can be
implemented. Different Departments of Transportation in North America use different failure criteria to implement various maintenance, repair, rehabilitation, and replacement strategies. To simplify the process and illustrate the capabilities of a risk-based decision-making approach, the following maximum probabilities of failure are used as criteria for patch repair and replacement of the deck: (i) Patch repair the deck when the spalling area reaches 10% and 20%; (ii) Replace the deck when the spalling area reaches 30%, which defines the end of life of the deck.
The life cycle (or planning horizon) is taken as 40 years and the discount rate used is 3%, which represents an estimate of the average rate of return on private investment, before taxes and after inflation. There is a strong debate on how to discount future social and environmental costs and if some costs need to be discounted at all (Corotis 2003). The components of the agency or owner’s costs include labour, equipment, material of the initial construction and all required maintenance, repair, rehabilitation and replacement (MR&R) activities throughout the bridge deck life cycle. The in-place costs of materials (in Canadian dollars) are: $460/m3for normal concrete (NPC); $520/m3 for high performance concrete; and $1800 per ton for carbon reinforcing steel. The cost and time data presented in this example are taken or assumed from various sources referenced in Lounis and Daigle (2008).
With the above data, the times corresponding to these damage states are predicted using the probabilistic service life models mentioned above. From Fig. 8, it is found that for the NPC bridge deck, the times at which the probability of spalling reaches 10% and 20% are 14 and 18 years, respectively at which patch repairs are performed. For the HPC bridge deck, the times at which the probability of spalling reaches 10% and 20% are 25 and 33 years, respectively at which patch repairs are performed. From Fig.8, it is found that the maximum probability of spalling of 30% (or service life) is reached after 22 years for the NPC deck and 40 years for the HPC deck.
After 22 years, the NPC deck is replaced with a similar type of NPC deck. The replacement cost includes the initial construction cost and the costs of demolition and disposal that were assumed equal to $70/m2. Since the end of life of the HPC deck is equal to the assumed life cycle or analysis period, its replacement is not included in the life cycle cost analysis. At the end of the analysis period, the NPC deck will have a four-year residual life and a residual value calculated as 18% (remaining service life over predicted service life) of the replacement cost, while the HPC alternative will have no residual service life or value as shown in Fig. 9. For the NPC deck, the schedules of maintenance, rehabilitation, and replacement activities for the deck replacement (year 22 and after) are similar to those of the initial deck construction (up to year 22).
Social and economic consequences
The social and economic consequences include the costs incurred by the road users, which include:
Time lost by vehicle drivers due to traffic delays;
Increased accident costs due to use of detours during inspection, maintenance, repair, rehabilitation, and replacement of bridge decks; and
Increased vehicle operating costs due to traffic delays and use of detours of lower quality than the original highway.
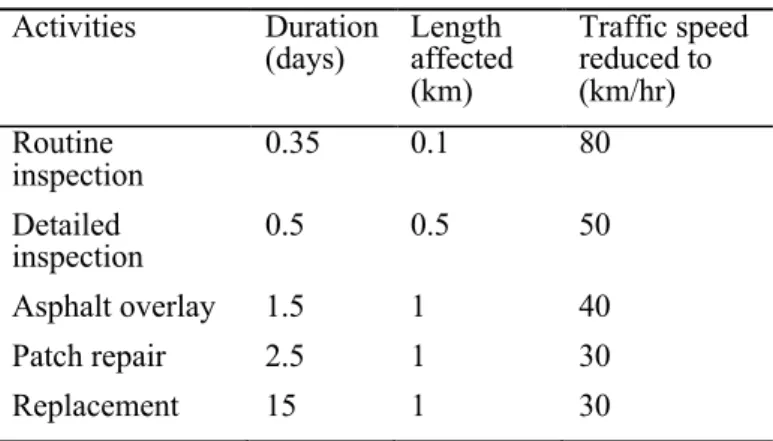
The duration of each maintenance, repair, rehabilitation, and replacement (MR&R) activity (average for both ways), the length of affected road during the activity (average for both ways), and reduced traffic speed during the MR&R activity (Table 4) are used to estimate the life cycle costs to the road users . These values are considered to be the same for both deck alternatives except for the replacement, which is used only on the NPC deck. The average value of driver’s time is estimated at $12/hour for a car driver and $20/hour for a truck driver. The vehicle operating costs are estimated as $8.85/hour (Walls and Smith 1998).
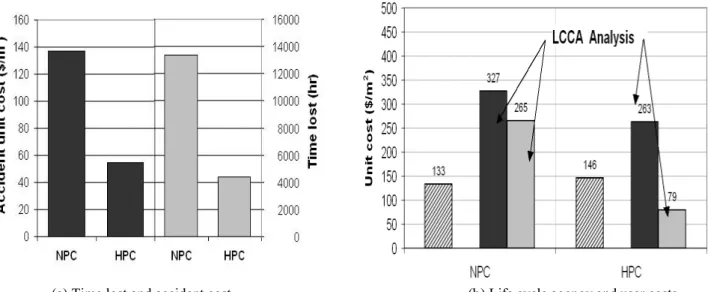
The normal accident rate on the highway is 2.1 per million vehicle.km. In the construction zone and during repair and rehabilitation work, the accident rate is 6 per million vehicle.km and the average accident cost is estimated at $33,000 (Transport Canada 1994, 2006; Statistics Canada 2003; Walls & Smith 1998). Fig. 10(a) shows the accident cost per deck area for both deck alternatives, as well as the total time lost by drivers due MR&R activities.
As for environmental impacts, the shorter service life of the NPC deck and its required replacement after 22 years, leads to an increase in traffic disruption, which in turn greatly affects the sustainability of the NPC deck.
Fig. 10(b) illustrates the results of the life cycle cost analysis (LCCA) that was undertaken using the Present Value Life Cycle Cost (PVLCC) approach detailed in Equation 9 (Hawk 2003):
= + ∑ ( ( )) −( ( )) (9)
where C0 = Initial construction cost (including design costs); Ci(ti) = ith expenditure at time ti (e.g. inspection, maintenance, repair, demolition, disposal, etc.); r = discount rate; T = life cycle;
Rv= residual (or salvage) value at the end of the life cycle; Cf=cost of failure; and Pf=probability of failure.
Fig. 10 illustrates the merits of the HPC bridge deck alternative as it yields lower life cycle costs for both owner (or agency) cost and users’ costs. The HPC deck alternative is 20% more cost-effective than the NPC deck alternative. In addition, the HPC deck yields 70% reduction in life cycle users’ costs compared to the NPC deck alternative. This example illustrates the fact that despite the HPC deck solution is about 10% more expensive than the NPC deck in terms of initial construction costs, the HPC deck is more cost-effective than the NPC deck in terms of life cycle costs.
Assessment of environmental consequences
The environmental consequences considered herein include:
CO2emissions associated with : (i) cement production; (ii) transportation of construction materials and components to the site, including the SCMs; and (iii) CO2 emitted by cars and trucks due to traffic delays during repair and replacement of the bridge decks The CO2released by the production of reinforcing steel is not considered but would typically be the same for both deck alternatives
Construction materials waste generated as a result of repair, rehabilitation and replacement activities.
In this example, it is found that the CO2emissions for the normal concrete (NPC) deck alternative are almost three times higher than those of the HPC deck alternative as shown in Fig. 11(a). This difference is mainly due to two factors:
(i) The lower cement consumption of the HPC mix that uses fly ash as a replacement material for a portion of the cement;
(ii) The shorter service life of the normal concrete deck, which leads to an increase in traffic disruption due to earlier replacement, also accounts for the higher CO2 emissions of the NPC deck.
A comparison of the construction material waste produced and ending up in a landfill for the two bridge deck alternatives is shown in Fig. 11(b), which includes the volume of waste material produced during the replacement of asphalt overlay, patch repairs, and replacement.
Sustainability summary
Based on a risk assessment that considered life cycle costs, social impacts, and environmental impacts, while maintaining structural safety, the high performance concrete (HPC) deck
alternative seems to be a slightly better choice. The limit state of bridge deck degradation due to corrosion and spalling also addresses resilience concerns, as a degraded bridge deck will reduce the serviceability (functionality) of the bridge, but does not cause structural safety concerns.
Example 2: Assessment of Resilient Highway Bridge Decks
As stated in the introduction, sustainability and resilience criteria are typically applied to an entire system, not a component of a system. However, a bridge deck example is used to demonstrate the proposed methodology.
The bridge deck alternatives evaluated for sustainable performance objectives may also be subject to extreme events during their service life, as depicted in Fig. 12. To assess the resilience of bridge designs to seismic events, fragility curves were used to estimate loss of functionality ΔF, also expressed as damage levels, and recovery time, RT, for a given peak ground acceleration (PGA) and time-dependent structural degradation. Repair and recovery costs, both direct and indirect, are also important to evaluate when assessing consequences for alternate design options. However, repair and recovery costs are not considered here, as life cycle costs were addressed under the sustainability assessment.
As illustrated, the loss of functionality depends on the type of construction and level of degradation, Fi, at the time of the event. Larger losses of functionality generally result in longer recovery durations.
Resilience performance goals
The performance goals for this resilience analysis are to minimize damage during hazard events and recovery time after the event while maintaining functionality and structural safety.
Hazards and consequences of failure
The primary hazard considered is a seismic event resulting in loss of structural deck support or loss of deck integrity. However, the degradation effects of corrosion and spalling were also
included, as they affect the system performance when a discrete seismic event occurs. The resilience consequences have social impacts, where the level of bridge damage will affect public safety and impact the community functionality with traffic delays due to time for repair and recovery.
Probabilistic assessment of loss of functionality for seismic performance of degrading bridge decks
Seismic fragility curves for bridges in this paper were adopted from Nielson and DesRoches (2007). The seismic behavior of nine common classes of bridge construction in the central and southeastern United States was represented with system-level fragility curves. Nielson and DesRoches (2007) computed the seismic structural response with three dimensional models of the bridge classes that included variability in material properties, construction features, and loading direction with a Latin Hypercube sampling technique. Limit states were developed for bridge components and grouped into four damage states due to seismic load effects: slight, moderate, extensive, and complete damage, similar to damage classifications for HAZUS (FEMA 2003).
Probabilistic models for bridge components are based on lognormal distributions, so that the fragility curve is expressed as (Nielson and DesRoches 2007):
[ > | ] = /( + ) . (10)
Where SD is the seismic demand, C is the capacity, Sd is the median estimate of the seismic demand as a function of PGA, Sc is the median estimate of the capacity as a function of PGA, and d and c are the logarithmic standard deviations of the seismic demand and capacity functions, respectively. The parameter Sd was defined as a power function of PGA, Sd =
a(PGA)b, where a and b are regression parameters (Nielson and DesRoches 2007).
Nielson and DesRoches (2007) found that the calculated logarithmic standard deviation from one damage state to the next was essentially constant for any bridge type. Bridge-level fragility curves, based on a joint probabilistic seismic demand model that incorporated component fragilities (Padgett, Ghosh, and Dennemann 2010), are expressed with a median PGA value (medi) and an associated standard deviation (ζi):
[ | ] = [( ( ) – ( )) / ] (11)
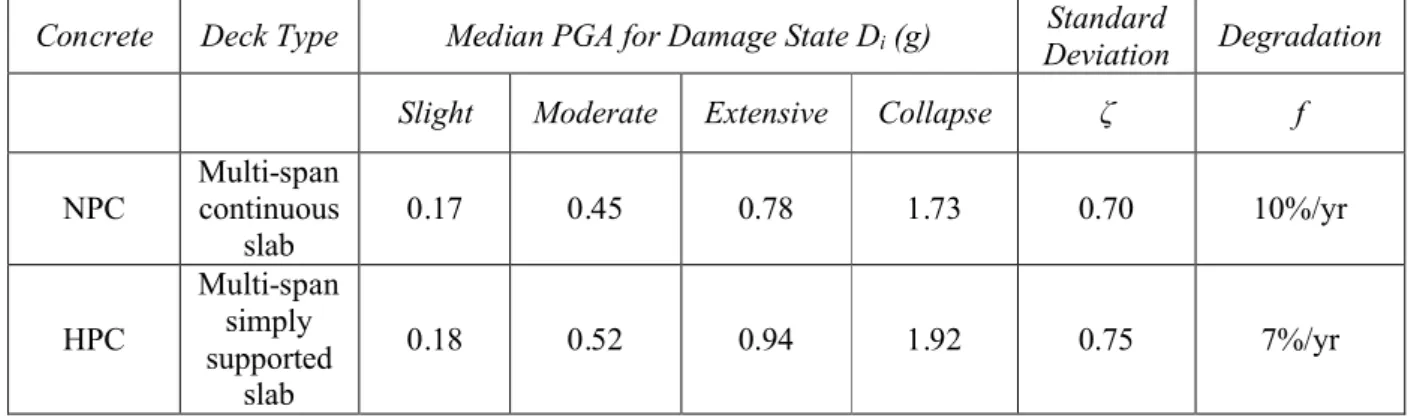
where P[Di|PGA] is the probability that a damage state i (slight, moderate, etc.) will be exceeded for a given PGA value. For this example, two of the bridge class fragilities were selected that had similar standard deviations, but different median PGA levels for the same damage category. The fragility parameters are shown in Table 5. The two types of concrete, HPC and NPC, were assigned to a bridge deck type for this example for illustration purposes.
The cumulative effects of corrosion and spalling degradation also need to be included in the fragility curves. Dong, Frangopol, and Saydam (2013) included degradation from corrosion and spalling in their time-dependent seismic fragility curves:
[ | ] = [ ( )( ) / ( ( ) + ( )) . ] (12)
The time dependent fragility curves can also be expressed in the format adopted in equation (11):
[ | ] = [( ( ) – ( ( ) ) ( )⁄ ] (13)
where the bridge capacity is a function of time and is represented by med(t) and ζ(t). For this example, a simplistic linear decay rate, f, was assumed that reduced the median PGA for the damage states as a function of time to demonstrate the resilience concepts.
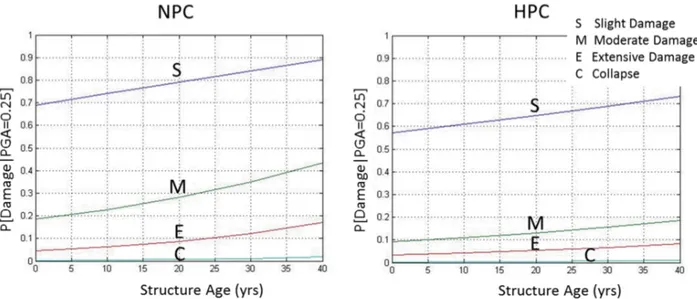
Figs. 13 and 14 plot the probability of damage when an earthquake with a given PGA occurs and the bridge has time-dependent degradation. Fig. 13 plots the fragility curves for the two bridge types in 10 year increments that include time-dependent degradation effects for meeting or exceeding slight, moderate, extensive, and collapse damage states. There is considerable difference in the expected levels of damage between the two bridge models. For instance, for 0.5g PGA, a NPC bridge deck has a 50 to 80% probability of moderate damage, 25 to 55% probability of extensive damage, and 5 to 15% probability of complete damage over a 40 year service period. In comparison, a HPC bridge deck has a 35 to 55% probability of moderate damage, 20 to 35% probability of extensive damage, and 5 to 10% probability of complete damage over a 40 year service period.
Fig. 14 shows the expected damage levels versus time for a 0.25g PGA. At this lower peak ground acceleration, there is a high probability of slight damage in both bridge types, with a 70 to 90% probability in the NPC bridge deck and a 58 to 72% probability in the HPC bridge deck. The NPC bridge deck has a 20 to 43% probability of moderate damage and a 5 to 18% probability of extensive damage, whereas the HPC bridge deck has less than a 20% chance of moderate or greater damage states.
Probabilistic assessment of recovery time consequences
The fragilities for damage states can also be used to estimate the expected recovery time, Ri, to full functionality. The representative mean values listed in Table 6 do not include degradation effects. The expected time-dependent recovery time, RT(t), can be computed according to Dong, Frangopol, and Saydam (2013) as
( ) = ∑ [ ( )| ] (14)
Fig. 15 plots the expected recovery times for a range of PGA values for the fragilities in Fig. 13. For 0.25 and 0.5 PGA values, expected recovery times for the NPC bridge deck range from 20 to 50 days and 70 to 150 days, respectively, and from 15 to 30 days and 50 to 100 days, respectively, for the HPC bridge deck range.
Resilience summary
Based on a risk assessment that considered levels of damage and loss of functionality following a hazard event and recovery times of system functionality, the HPC deck alternative seems to be a slightly better choice. The use of high performance concrete resulted in a more resilient bridge
deck with reduced levels of damage and recovery times when compared to conventional normal concrete bridge decks
SUMMARY AND CONCLUSIONS
There is a growing interest in sustainability and resilience concepts for infrastructure systems and neighbouring communities. Both of these concepts need to be applied at a community level to determine appropriate performance criteria of all infrastructure systems in a community. This paper does not address the community performance criteria, but focuses on the application of sustainability and resilience concepts to infrastructure systems.
Sustainability and resilience concepts were illustrated by applying a risk-informed decision making approach to a highway bridge deck of a bridge system. The sustainability and resilience performance goals were evaluated for design alternatives through assessment of performance goals and associated consequences, as part of the risk-based analysis.
The sustainability example considered environmental impacts, such as whether a construction material, structural system, construction method and maintenance plan have beneficial or neutral impacts on the environment. The resilience example considered levels of damage and loss of functionality following a hazard event, and recovery times of system functionality. Both examples found that the use of high performance concrete improved the sustainability and resilience of the highway bridge deck.
The first example showed that the implementation of a sustainable design approach would lead to the construction of high performance highway bridges that satisfy the safety and serviceability requirements and minimize the environmental impacts, users’ costs and total life cycle costs. The use of high performance concrete containing fly ash resulted in a more sustainable bridge deck with a longer service life, lower life cycle costs, and lower environmental and social consequences when compared to conventional normal concrete bridge decks.
The second example showed that the implementation of a resilient design approach would lead to the construction of high performance highway bridges that satisfy the safety and serviceability requirements and minimize damage during hazard events and recovery time after the event. To evaluate the resilience of bridge designs for a given peak ground acceleration, fragility curves were used to estimate the loss of functionality in terms of damage levels and recovery time while accounting for time-dependent structural degradation. The use of high performance concrete resulted in a more resilient bridge deck with reduced levels of damage and recovery times when compared to conventional normal concrete bridge decks.
REFERENCES
Agrawal, A.K., A. Kawaguchi, Z. Chen (2010). “Deterioration Rates of Typical Bridge Elements in New York.” Journal of Bridge Engineering. 15(4), 419-429.
Astaneh-Asl, A. (2008). “Progressive Collapse of Steel Truss Bridges, the Case of I-35W Collapse”,
Barsom, J.M. and S.T. Rolfe (1999) Fracture and fatigue control in structures: applications of fracture mechanics, American Society for Testing and Materials, West Conshohocken, PA.
Bažant, Z.P.(1979). “Physical model for steel corrosion in concrete sea structures – theory”, Journal of
the Structural Division, 105(ST6), , 1137-1153.
Bocchini, P., and D.M. Frangopol (2012). "Optimal resilience- and cost-based post-disaster intervention prioritization for bridges along a highway segment", Journal of Bridge Engineering, 17(1), 117-129. Bruneau, M., S.E. Chang, R.T. Eguchi, G.C. Lee, T.D. O’Rourke, A.M. Reinhorn, M. Shinozuka, K. Tierney, W.A. Wallace, D. Winterfeldt (2003). A Framework to Quantitatively Assess and Enhance the Seismic Resilience of Communities. Earthquake Spectra, Volume 19, No. 4, pages 733–752, November 2003.
Bureau of Reclamation (2011) Interim Dam Safety Public Protection Guidelines, A Risk Framework to
Support Dam Safety Decision Making, U.S. Department of the Interior, Bureau of Reclamation, Dam
Safety Office, Denver, CO, August 2011.
Canisius, G.T.D. editor (2011). Structural Robustness Design For Practicing Engineers, COST Action TU0601- Robustness of Structures.
Cimellaro, G. P., Reinhorn, A. M., and Bruneau, M. (2010). “Seismic resilience of a hospital system”,
Structure and Infrastructure Engineering, Taylor and Francis, 6(1), 127-144.
Corotis, R.B. (2003). Risk-setting policy strategies for hazards. In Life Cycle Performance of
Deteriorating Structures, Frangopol, D.M. et al. (eds.), pp. 1-8, ASCE.
Crank, J. (1979) The Mathematics of Diffusion, Oxford University Press.
CSA (2006). Canadian Highway Bridge Design Code (CHBDC), CAN/CSA-S6-06, Canadian Standards Association.
Dong, Y., D.M. Frangopol, and D. Saydam (2013). “Time-variant sustainability assessment of seismically vulnerable bridges subjected to multiple hazards”, Earthquake Engineering & Structural Dynamics, 42(10), 1451-1467.
Elkington, J. (1997). Cannibals with Forks, The Triple Bottom Line of 21stCentury Business, Capstone
Publishing Ltd., Oxford.
Ellingwood, B.R. (2011). Public perception and acceptance of risk in buildings and other structures. In
Structural Robustness Design for Practising Engineers, Canisius, T.D.G (ed.), pp. C.31-C.40.
Ellingwood, B.R. (2005). “Risk-informed condition assessment of civil infrastructure: state of practice and research issues”, J. Struct Infrast. Engrg, 1(1), 7-18.
Ellingwood, B.R. (2001). “Earthquake risk assessment for building structures”, Reliability Engineering
and System Safety, 74, 251-262.
Eurocode EN 11991-1-1(2006). Actions on Structures, Part 1-7, General Actions- Accidental Actions. FEMA (2003). HAZUS-MH MR1: Technical Manual, Federal Emergency Management Agency, Washington, D.C.
Francis, R. and B. Bekera (2014) A metric and frameworks for resilience analysis of engineered and
infrastructure systems, Reliability Engineering & System Safety, 121, 90–103,
Frangopol, D.M., and Bocchini, P. (2011). “Resilience as optimization criterion for the bridge rehabilitation of a transportation network subject to earthquake,” Proceedings of ASCE Structures
Congress, Las Vegas, NV, April 14-16; in Structures Congress 2011, D. Ames, D., T.L. Droessler, and
M. Hoit, M., eds., 2044-2055.
Frangopol, D.M., and Liu, M., Multiobjective optimization for risk-based maintenance and life-cycle cost of civil infrastructure systems. J. System Modelling and Optimization, 2005, 123-137
Hasofer, A.M. and Lind, N.C. (1974). “Exact and invariant second-moment code format”, J. Engrg.
Mech. Div., ASCE, 100(EM1), 111-121.
Hawk, H. (2003). Bridge Life-Cycle Cost Analysis. NCHRP Report 483, Transportation Research Board, Washington, D.C.
INSAG (2011). A framework for an integrated risk informed decision making process, A report by the
International Nuclear Safety Group, INSAG-25, International Atomic Energy Agency, Vienna.
JCSS (2008). Risk Assessment in Engineering Principles, System Representation & Risk Criteria. Joint Committee on Structural Safety, Faber, M.H. (Editor).
Koski, J., Multi-objective optimization in structural design. In new directions in optimum structural design, 484-503. Edited by Atrek et al. 1984, John Wiley & Sons, New York, NY.
Lounis, Z. and Daigle, L. (2008). “Reliability-based decision support tool for life cycle design and management of highway bridge decks”, Annual Conf. of the Trans. Assoc. of Canada, Toronto, ON, pp. 1-19.
Lounis, Z., Martin-Perez, B., Daigle, L, and Zhang, J. (2006). Decision Support Tool for Service Life Prediction and Rehabilitation of Concrete Bridge Decks. NRC Report B53118.2.
Lounis, Z., and Cohn, M.Z., An engineering approach to multi-criteria optimization of bridge structures. Journal of Computer-Aided Civil. & Infrastructure Engrg., 10(4), 1995, 253-238
McAllister, T.P. (2013). Developing Guidelines and Standards for Disaster Resilience of the Built
Environment: A Research Needs Assessment, National Institute of Standards and Technology,
Gaithersburg, MD 20899, http://dx.doi.org/10.6028/NIST.TN.1795
McDaniels, T., S. Chang, D. Cole, J. Mikawoz, H. Longstaff (2008). “ Fostering resilience to extreme events within infrastructure systems: Characterizing decision contexts for mitigation and adaptation.”
Global Environmental Change, Volume 18, pages 310– 318.
NASA (2010). NASA Risk-Informed Decision Making Handbook, Office of Safety and Mission Assurance, NASA Headquarters, NASA/SP-2010-576, Version 1.0, April 2010
Nielson, B.G. and R. DesRoches (2007). “Analytical Seismic Fragility Curves for Typical Bridges in the Central and Southeastern United States”, Earthquake Spectra, Vol. 23, No. 3, pp. 615-633.
NIST (2008). Best Practice Guidelines for Structural Fire Resistance Design of Concrete and Steel
Buildings, NIST Technical Note 1681, National Institute of Standards and Technology, Gaithersburg, MD
20899.
NRC (2009). NRC-NRTSI Model Framework for the Assessment of Performance of Canada’s Core
Public Infrastructure, Report for Infrastructure Canada,
Padgett, J., Dennemann, K., and Ghosh, J. (2010). Risk-based seismic life-cycle cost-benefit (LCC-B) analysis for bridge retrofit assessment”, Structural Safety, 32, 165–173,
doi:10.1016/j.strusafe.2009.10.003.
PPD-21 (2013) Presidential Policy Directive/PPD-21, The White House, March 30, 2011.
http://www.whitehouse.gov/the-press-office/2013/02/12/presidential-policy-directive-critical-infrastructure-security-and-resil
Rackwitz, R., and Fiessler, B. (1978). “Structural reliability under combined random load sequences.” J. Computers & Structures, (9), 489-494.
RIMS (2011). An Overview of Widely Used Risk Management Standards and Guidelines, RIMS
Executive Report, Risk and Insurance Management Society, Inc. (RIMS), www.RIMS.org
Statistics Canada (2003). Canadian Vehicle Survey, Cat. No. 53-223-XIE.
Timoshenko, S.P. (1956). Strength of Materials. Part II: Advanced Theory and Problems, Princeton, NJ. Transport Canada (1994). Guide to Benefit-Cost Analysis in Transport Canada.
Transport Canada (2006). Road Safety in Canada – 2003, TP 13951E.
Walls, J., and M.R. Smith (1998). Life Cycle Cost Analysis in Pavement Design, Interim Technical Bulletin, Publication No. FHWA-SA-98-079, 107 p
World Commission on Environment and Development (WCED) (1987). Our Common Future, Oxford University Press, NY.
LIST OF TABLES
Table 1. Typical Performance Goals and Metrics for Sustainable snd Resilient Infrastructure
Systems.
Table 2. General Information for Highway Bridge Example. Table 3. Material, Structure and Environmental Load Data. Table 4. Data Related to User Costs Estimation.
Table 5. PGA Values for Seismic Damage.
Table 1. Typical Performance Goals and Metrics for Sustainable and Resilient Infrastructure Systems.
Sustainability General Resilience
Goals
Maintain system performance requirements through life cycle Maximize service life with minimal life cycle costs
Optimize resource management and social equity
Resist effects of design hazards Maintain life safety for
occupants
Minimize life cycle costs for required performance criteria
Maintain functionality during and after hazard
Minimize impact on community when damage and loss of functionality occurs
Minimize recovery time and costs
Metrics
Service life Life cycle cost
Environmental impact
Strength, stiffness, serviceability Structural integrity
Initial and maintenance costs
Functionality Recovery time Recovery costs
Table 2. General Information for Highway Bridge Example.
Bridge width 12.75 m
Bridge length 47.5 m
Deck thickness 225 mm
Isotropic reinforcement percentage for both mats 0.3%
Annual Average Daily Traffic (AADT) 22000
Annual Average Daily Truck Traffic (AADTT) 4500
Table 3. Material, Structure and Environmental Load Data.
Parameter Distribution
type Mean value COV
*
Concrete cover depth (mm) Bar spacing (mm) Bar diameter (mm) Normal Normal Deterministic 70 150 9.5 25 5
-Surface chloride content (kg/m3)
Apparent chloride coefficient of diffusion (cm2/year) - NPC
Apparent chloride coefficient of diffusion (cm2/year) – HPC
Threshold chloride content (kg/m3)
Normal Normal Normal Normal 6 0.40 0.20 0.70 25 25 25 20
Corrosion rate (A/cm2) Normal 0.5 20
* COV = coefficient of variation (%)
Table 4. Data for Estimation of User Costs
Activities Duration
(days) Length affected
(km) Traffic speed reduced to (km/hr) Routine inspection 0.35 0.1 80 Detailed inspection 0.5 0.5 50 Asphalt overlay 1.5 1 40 Patch repair 2.5 1 30 Replacement 15 1 30
Table 5. PGA Values for Seismic Damage (Nielson and DesRoches 2007)
Concrete Deck Type Median PGA for Damage State Di(g) Standard
Deviation Degradation
Slight Moderate Extensive Collapse ζ f
NPC Multi-span continuous slab 0.17 0.45 0.78 1.73 0.70 10%/yr HPC Multi-span simply supported slab 0.18 0.52 0.94 1.92 0.75 7%/yr
Table 6. Expected Recovery Time (Padgett, Ghosh, and Dennemann 2009) Recovery (days) Slight Damage Moderate
Damage Extensive Damage Complete Damage Ri 7 30 120 400