Artificial Recharge for Conjunctive Use in Irrigation:
The San Joaquin Valley, California
by
Virat Chatdarong
B.S., Civil Engineering (2000)Chulalongkorn University
Submitted to the Department of Civil and Environmental Engineering In Partial Fulfillment of the Requirements for the Degree of
Master of Engineering
in Civil and Environmental Engineering at the
Massachusetts Institute of Technology
June 2001© 2001 Virat Chatdarong. All rights reserved
The author hereby grants to MIT permission to reproduce and distribute publicly paper and electronic copies of this thesis document in whole or in part.
A uthor... : .. ... ... ... t.. . ...
Departm't of Civil and Environmental Engineering May 11, 2001 Certified by ... ... . ... ...
Dennis B. McLaughlin H.M. King Bhumibol Professor of Water Resource Management Thesis Supervisor
Accepted by ... .... ... .. ... ... ...
Oral Buyukozturk Chairman, Department Committee on Graduate Students
MASSACHUSETTS INSTITUI'E OF TECHNOLOGY
JUN 0 4 2001
LIBRARIES ARCHIVES---Artificial Recharge for Conjunctive Use in Irrigation:
The San Joaquin Valley, Califoriia
by
Virat Chatdarong
Submitted to the Department of Civil and Environmental Engineering on May 11, 2001 in partial fulfillment of the
Requirements for the Degree of
Master of Engineering in Civil and Environmental Engineering
Abstract
One classical solution for dealing with surface water fluctuation is to construct a surface reservoir. However, because a surface reservoir requires too much land and has high negative impact on the environment, the use of a natural aquifer as a subsurface reservoir is proposed. In this solution, restoration of water to an aquifer requires an artificial recharge method. It is deduced that for irrigation purposes, a direct surface recharge is the most appropriate method to use because of its low cost of construction, operation and maintenance.
To store water for agriculture, the capacity to recharge water within a limited time is the most important characteristic determining the feasibility of artificial recharge. Regarding a direct surface method, this capability is mainly governed by soil properties, depth to groundwater table, and spacing between two adjacent recharge areas. Under proper conditions, sufficient amounts of recharge water can store for agricultural purposes within a region.
This study shows that total costs to construct, operate and maintain artificial recharge facilities are relatively low compared to the benefits that are expected from the recharge project. This implies th, - an artificial recharge scheme is a practical way to restore water to an aquifer, and use it in conjunction with surface water for irrigation.
Thesis Supervirsor: Dennis B. McLauglin
Acknowledgments
First of all, I would like to thank my thesis supervisor, Professor Dennis McLaughlin, for giving me the opportunity to deal with this interesting project and for his guidance and support over the past year. His encouragement and simulating advice were crucial for the accomplishment of my thesis.
I am grateful to Dr. Eric Adam for providing useful information and taking good care of the Master of Engineering students. Also, many thanks to Daniel Sheehan for helping me with ArcView GIS. Without his help, I would have spent a whole semester struggling with this program.
I would like to thank professors, the staff, and my colleagues in the Parsons Lab and in the Master of Engineering Program for providing information and many useful suggestions for my thesis. Thank Sutapa and Julie for valuable suggestions and useful resources.
I would like to thank the Ananda Mahidol Foundation for its supporting and for the chance to contribute my knowledge to our beloved country. Thanks to A. Chaiyuth Suksri and professors in the department of Civil Engineering and the department of Water Resources Engineering, Chulalongkom University for their supports, encouragement and many valuable suggestions.
Special thanks to Linda, my dear girlfriend for your love and encouragement: Narongsak, Paisam, Wutthiphon, Warit, and my TSMIT friends for making my experience at MIT so enjoyable and memorable.
Finally, I would like to deeply thank my father, mother, and my lovely sister for their endless care, love and warm support throughout my entire life. They have given me that ambition and strength to conquer all difficulties in my life.
Contents
LIST OF FIGURES ... 6
LIST OF TABLES ... CHAPTER 1 INTRODUCTION ... 8
1.1 OBJECTIVES AND RESEARCH ISSUES ... 8
1.2 CONJUNCTIVE USE AND AQUIFER AS A VIEW OF SUBSURFACE STORAGE ... 9
1.3 STUDY AREA: THE SAN JOAQUIN VALLEY ... 11
1.3.1 General Characteristic of the San Joaquin Valley ... ... 12
1.3.2 Conjunctive Use in the San Joaquin Valley ... 13
CHAPTER 2 ARTIFICIAL RECHARGE ... 15
2.1 GROUNDWATER RECHARGE ... 15
2.1.1 Natural Recharge ... 15
2.1.2 Artificial Recharge ... 16
2.2 METHODS OF ARTIFICIAL RECHARGE... 16
2.2.1 Direct Surface Methods ... 17
2.2.2 Direct Subsurface Methods ... 17
2.2.3 Combination Surface-Subsurface Methods ... 18
2.2.4 Indirect Methods ... 18
2.3 FACTORS AFFECTING RECHARGE METHODS ... 21
2.3.1 Hydro-Geologic Characteristics... 21
2.3.2 Topography and Stream Flow ... 22
2.3.3 Water Supply Characteristics ... 22
2.3.4 Miscellaneous Factors ... 23
CHAPTER 3 DESIGN OF A DIRECT SURFACE RECHARGE FACILITY ... 24
3.1 ARTIFICIAL RECHARGE DESIGN ISSUES ... 24
3.2 RECHARGE ANALYSIS ... 24
3.2.1 The Simulation Model ... 25
3.2.2 Simulation Assumptions ... 26
3.3 GROUNDWATER RECHARGE BEHAVIOR ... 27
3.3.1 Behaviors of Unsaturated Flow ... 27
3.3.2 Behavior of Saturated Flow ... 31
3.4 EFFECTS OF SOIL CHARACTERISTICS, DEPTH TO GROUNDWATER, AND SPACING .... 34
3.4.1 Effects of Soil Characteristics ... 34
3.4.2 Effect of Depth to Groundwater Table ... 36
3.4.3 EFffect of Spacing Between Adjacent Recharges . ... 38
3.5 WATER RECOVERY ... ... 40
3.6 ARTIFICIAL RECHARGE MAINTENANCE ... 40
3.7 CONCLUSION FOR GROUNDWATER RECHARGE ANALYSIS ...41
CHAPTER 4 SITE SELECTION AND ECONOMIC ANALYSIS ... 43
4.1 ARTIFICIAL RECHARGE SITE SELECTION ... 43
4.1.1 A rcView G IS... ... 43
4.1.2 Data for Artificial Recharge Site Selection ... 44
4.1.3 Proposed Artificial Recharge Site, in the San Joaquin Valley Area ... 46
4.2 ECONOMIC ANALYSIS AND FEASIBILITY OF THE PROJECT ... 49
4.2.1 Economic Analysis Scheme ... 49
4.2.2 Estimation of the Costs from Artificial Recharge ... 49
4.2.3 Estimation of the Benefits from Artificial Recharge ... 51
4.2.4 Feasibility of the Project ... 52
CHAPTER 5 CONCLUSIONS ... 53
5.1 SUMMARY OF PROJECT ... 53
5.1.1 Artificial Recharge Methods for Conjunctive Use in Irrigation ... 53
5.1.2 Important Factors in Artificial Recharge ... 54
5.1.3 Ability to Pump Stored Water for Irrigation ... 54
5.1.4 Feasibility of the Artificial Recharge Project . ... 55
5.2 RECOMMENDATIONS FOR FUTURE RESEARCH ... 56
5.2.1 Radial Configuration Artificial Recharge ... 56
5.2.2 Actual Recharge Behaviors vs. Simulation Behaviors ... 56
5.2.3 Detailed Simulation and Economic Analysis ... 56
APPENDIX A ARTIFICIAL RECHARGE SIMULATION MODELS ... 57
A. i SYMMETRICAL MODEL RE SULTS ... 57
A.2 ECONOMIC ANALYSIS: COSTS ... 57
A.3 ECONOMIC ANALYSIS: BENEFITS ... 58
REFERENCES ... 60
List of Figures
Figure 1-1: Map and Groundwater Basins in the San Joaquin Valley ... 11
Figure 1-2: Cross-Section of San Joaquin Valley Strata of Tulare and Kings County ... 12
Figure 1-3: Land Subsidence Due to Overdraft in the San Joaquin Valley (Near Mendota) (Sources: U.S. Geology Survey) ... 13
Figure 3-1: Recharge Water Simulation Model in Hydrus 2-D ... 255... Figure 3-2: Infiltration Rate from Green-Amp Equation ... 29
Figure 3-3: Groundwater Mound During Recharge (Asano, 1985) ... 31
Figure 3-4: Artificial Recharge Simulation of Sandy Soil by Hydrus 2D ... 33
Figure 3-5: Effect of Soil Type to Recharge Rate and Cumulative Recharge Water ... 36
Figure 3-6: Effect of Depth to Groundwater on Recharge Rate and Cumulative Recharge ... 37
Figure 3-7 Effect of Spacing Between Two Adjacent Recharge Site ... 39
Figure 4-1: Example of Groundwater Depth and Surface Elevation Data Using ArcView GIS ... 45
Figure 4-2: Proposed Artificial Recharge Site by ArcView GIS ... 46
Figure A-1: Recharge Rate and Cumulative Recharge Rate of Proposed Artificial Recharge Sites... 57
List of Tables
Table 1-1: Advantages and Disadvantages of Subsurface Reservoir Compared to Surface
Water Storage ... ... 10
Table 2-1: Techniques Used in Direct Surface Recharge Methods ... 19
Table 2-2: Techniques Used in Direct Subsurface Recharge Methods ... 20
Table 3-1: Green-Ampt Infiltration Parameters for Various Soil Classes ... 28
Table 3-2: Representative Artificial Recharge Rates ... 30
Table 3-3: Characteristic of Soil Types Used in the Recharge Simulation ... 35
Table 4-1: Details of Proposed Artificial Recharge Site for the San Joaquin Valley, C alifornia... 48
Table 4-2: Approximate Annual Cost of Artificial Recharge Project ... 51
Table 4-3: Potential Crop Revenues from Artificial Recharge Project ... 52
Table A-I: Land Acquisition Cost in the Great Valley, California ... 57
Table A-2: Energy Cost to Required to Lift One Acre-foot of Water One Foot of E levation ... 58
Table A-3: Crop Water Needs and Sensitivity to Drought ... 58
Table A-4: Average Crop Yields for Difference Crop Types (Ton/Acre) ... 59
Chapter 1
Introduction
For many centuries, dams and surface reservoirs have been constructed to deal with fluctuations of surface water. The primary purpose of these gigantic constructions is to store and provide adequate amounts of water. With higher technologies and research studies, we currently have more options to deal with variability of water. One possible alternative is to recharge an aquifer and use it as groundwater storage.
1.1 Objectives and Research Issues
Our interest in artificial recharge for conjunctive use emerges from its advantages over surface reservoirs. Artificial recharge creates smaller surface interference and has fewer effects on the environment. We would like to study the possibility of applying this concept to store water for irrigation. Thus, we need to understand more about water recharge behavior, and the feasibility of artificial recharge.
The main research issues addressed in this study are:
- What are the suitable artificial recharge methods for irrigation purposes? - Which are the important recharge characteristics and what affect these
characteristics?
- Where should we construct artificial recharge facilities in the study area? - Is the artificial recharge project economically feasible and practical to use?
1.2 Conjunctive Use and Aquifer as a View of Subsurface Storage
Conjunctive use of surface and groundwater may be defined as any scheme that capitalizes on the interaction of surface and groundwater to achieve a greater beneficial use than if the interaction were ignored.
As population increases, water demands also increase dramatically. As a consequence, water stored in surface reservoirs becomes inadequate. Moreover, due to higher land values and concerns for environmental issues, the potential to construct dams or any large surface reservoirs to provide sufficient water is widely opposed. This leads to a combined use of surface and groundwater together, known as conjunctive use.
Since the 1900s when humans first developed turbine engines and applied them to withdraw water from subsurface storage, enonnous amounts of water have been consumed. The rate of pumping has been far beyond the capability of nature to refill those groundwater storages. As a result, groundwater has quickly dissipated, and many economic and environmental issues have become apparent. These facts inspire scientists to find an alternative way to increase the natural recharge that refill these groundwater storages.
Study of man-made infiltration, called artificial recharge, has been introduced to balance demand and supply. In addition, it allows the use of natural groundwater aquifers as subsurface reservoirs to store excess water and then provide it in demanding periods with little or no impact on groundwater depletion.
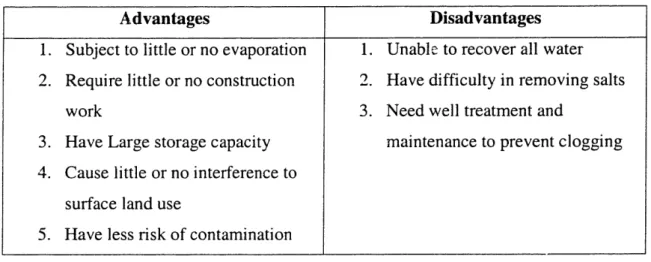
The judgment to consider the existing natural aquifers as reservoirs depends on optimizing the tradeoffs between advantages and disadvantages of the subsurface reservoir method. Typical examples are shown in Table 1-1.
Table 1-1: Advantages and Disadvantages of Subsurface Reservoir
Compared to Surface Water Storage
Advantages Disadvantages
1. Subject to little or no evaporation 1. Unable to recover all water 2. Require little or no construction 2. Have difficulty in removing salts
work 3. Need well treatment and
3. Have Large storage capacity maintenance to prevent clogging 4. Cause little or no interference to
surface land use
5. Have less risk of contamination
Because surface and subsurface reservoirs have such different characteristics, in order to address the plan for conjunctive use, it is imperative to understand their characteristics, mechanisms of recharge, as well as parameters that will affect those behaviors.
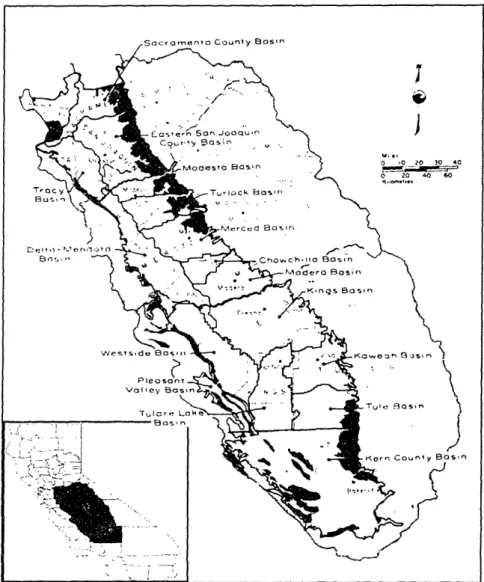
1.3 Study Area: The San Joaquin Valley
The San Joaquin Valley is located in the southern half of California's Great Central Valley. It is known as California's largest and most productive agricultural area. The San Joaquin valley has an area of about 3.4 million hectares, or 8.5 million acres. This fertile farmland is located between the Sierra Nevada, the Coast Range, the Tehachapi Mountains, and the Delta of the Sacramento and San Joaquin Rivers.
Figure 1-1: Map and Groundwater Basins in the San Joaquin Valley
11
I rol I ' l_ _
-1.3.1 General Characteristic of the San Joaquin Valley
The typical terrain in the San Joaquin is a flat plain surrounded by mountains. Its floor gradually slopes downward toward the northwest, and dips to the west toward its centerline. The average height of the valley is about at sea level in the flat plain and reaches the level of about 300 feet at the foot of the Tehachapi Mountain.
Major rivers in this area from north to south include the Stanislaus, Tuolumne, Merced, Chowchilla, Fresno, San Joaquin, Kings, Kaweah, Tule, and Kern. These rivers originate in the Sierra Nevada Mountains to the east and flow northwest toward the valley. Annual precipitation in the valley ranges from 100 millimeters in the southern end to about 450 millimeters in the northern end of the valley near the base of the Sierra foothills. 12 ;A nA I
.
; 4 ,a, , . , r byC' Is-_ II.-K, L SL- - ' 4 ' / - I,
·- ~ ~ / ," n~~~~~~~~~~l ~~~~~~~~~/ &L / . /~~~~~~~~~/ :ecsl? · i j ~~~~~-r -nFigure 1-2: Cross-Section of San Joaquin Valley Strata of Tulare and Kings County
____ .IL I ' I-1 "I. - 4, '..
There are three main groundwater bodies in the area: an unconfined aquifer, a confined aquifer and a water body in consolidated rocks. The confining layer underlines most of the basin at a depth between 50 to 250 feet extending from the east to the west. The typical range of well yields is about 1000 to 2000 gallon per minute.
1.3.2 Conjunctive Use in the San Joaquin Valley
The San Joaquin Valley has been developed from a semiarid region to the richest agricultural area in the world. About 2 million hectares of the land is used for agricultural purposes. Although the growing season is long and the soil is fertile, rainfall and surface water supply are limited. Therefore, most farmers draw water from the subsurface aquifer to meet the irrigation demand.
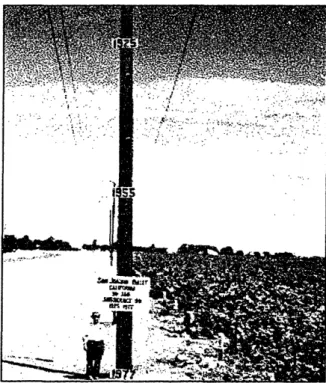
Figure 1-3: Land Subsidence Due to Overdraft in the San Joaquin Valley (Near Mendota)
(Sources: U.S. Geology Survey)
The availability of turbine pumps since the 1920s allows farmers to supply water for their irrigation from subsurface aquifer regardless of surface water. Any land, even located far away from surface water supplies, can grow crops using turbine pumps to withdraw
subsurface water. 'Groundwater supplies enable agricultural production to expand rapidly and to yield more income to the region. At the same time, a large amount of groundwater is consumed annually which has resulted in drastic declines in groundwater level in many parts of the Valley. A drop in the groundwater level has consequently caused significant increase in the energy cost to pump water for irrigation and brings up many economic and environmental issues, e.g. land subsidence, salt water intrusion.
In response to this problem, the federal government's Central Valley Project (CVP) began delivering water to the Valley in the 1940's, and California's State Water Project (SWP) followed with additional programs. Artificial recharge has been conducted as a method to alleviate groundwater crises and to augment the subsurface aquifer. It has been proved in many projects that artificial recharge schemes are efficient to augment groundwater level.
Even though artificial recharge is practical to use in many areas, more research for a better understanding of groundwater recharge is needed to specify more precise benefits, effects to the environment, and effective strategies for conjunctive use.
Chapter 2
Artificial Recharge
In this chapter we will present the general knowledge about groundwater recharge, e.g. definitions, methods, and important factors that would affect the behavior of recharge. This knowledge will provide more understanding about artificial recharge behaviors that will lead to the simulation model i the next chapter.
2.1 Groundwater Recharge
Groundwater recharge is the process of transferring surface water into a groundwater aquifer. The main purpose is to augment the amount of groundwater availability. Groundwater recharge is classified into 2 broad categories: natural recharge and artificial recharge.
2.1.1 Natural Recharge
Natural groundwater recharge is the process by which recharge occurs without control by human activities. Recharge water may come from several natural sources, such as deep percolation of precipitation, percolation of water through streambeds, or subsurface flow from adjacent aquifers. Commonly, deep percolation of rainfall and seepage of stream water through the ground are the: largest sources of natural recharge in most places. Natural recharge varies from place to place depending mainly on soil types and weather conditions.
In many areas, groundwater rapidly declines due to high rate of pumping. Natural recharge alone is not sufficient to refill an aquifer. To deal with this groundwater
depletion, artificial recharge is introduced to augment natural recharge and supply more water to an aquifer.
2.1.2 Artificial Recharge
Artificial recharge is a human-planned activity conducted to increase natural recharge o refill a groundwater aquifer. Even though it is named as 'artificial' recharge, its behaviors still follow the same principal laws that applied to natural recharge. The only difference is that in artificial recharge, people are managing water supply to be at particular location and at particular time. In the broad definition, artificial recharge may be expressed as managed groundwater recharge.
While the primary objective of artificial recharge is to preserve and enhance the availability of groundwater, it can be used for other purposes. Examples of other common objectives are conservation and disposal of floodwater, control of saltwater, storage of water for the pumping cost reduction, and improvement of water quality, etc. It is common for an artificial recharge project to be objective because a multi-objective project is typically more economically feasible than a single-multi-objective project.
2.2 Methods of Artificial Recharge
There are many methods developed for artificial recharge to increase groundwater supplies. In general, they are classified into 4 broad categories. (Oaksford: 1985)
1. Direct surface methods 2. Direct subsurface methods
3. Combination surface-subsurface methods 4. Indirect methods
2.2.1 Direct Surface Methods
Direct surface methods are the simplest, oldest and most widely used method. They have relatively low cost of construction, operation and maintenance. In direct surface methods, water percolates from a surface water supply through the soil to an aquifer. The surface recharge methods have been used in many existing large-scale artificial recharge projects in western countries. From field research, of many factors governing the amount of water recharging an aquifer, the area of recharge and the length of time that water is in contact with soil are the most important factor. (Todd, 1980)
Direct surface methods include flooding, ditch and furrow, basins, stream channel modifications, stream augmentation and over-irrigation technique. Because direct surface methods have relatively low cost of construction, operation and maintenance, it is recommended for recharging groundwater for irrigation purposes. Concepts, limitations and advantages of each direct surface technique are summarized in Table 2-1.
2.2.2 Direct Subsurface Methods
Direct subsurface methods are recharges of groundwater by conveying water directly into aquifers. Generally, direct subsurface methods are used to recharge confined aquifers. Techniques of direct subsurface methods include injection of water into natural openings in the aquifer, pits or shafts, wells, and drainage pipe networks. Concepts, limitations and advantages of each direct surface technique are summarized in Table 2-2.
The obvious advantage of direct subsurface methods is that they require small amounts of surface area and have little or no interferences with surface land use. Moreover water loss to evaporation is significantly less than direct surface methods. However, quality of supply water is a big concern for the subsurface methods. To prevent clogging, the supply water needs to be treated before injecting into the ground, resulting in higher cost of construction, operation and maintenance.
In general, direct subsurface methods are suitable to supply water in urban areas where there are limited spaces and land values are costly. For irrigation areas, where land values are relatively cheap, subsurface method may not be economically feasible.
2.2.3 Combination Surface-Subsurface Methods
Several direct-surface and subsurface methods can be used in conjunction with one another to meet specific recharge needs. Advantages and limitations of each combination technique result from both surface and subsurface techniques mentioned earlier. Examples of the combination methods include subsurface drainage collectors with wells, basins with pits, shafts, or wells, etc.
2.2.4 Indirect Methods
The concept of the indirect method is to allow an increased rate of groundwater withdrawal from an aquifer, without necessarily increasing water in a groundwater aquifer. An example for the indirect method is to increase an allowable pumping rate by locating pumping facilities near a lake or a stream. In this example, the pump will lower the groundwater level, increasing the water infiltration from adjacent surface water supply. Because ind-ct methods do not necessarily increase groundwater storage, many people do not consider them to be artificial recharge methods.
c O c~ 0 U, = E C C J 0 0I E - O ° 0 l r-m -. -Ct cl i W3 0 0 s.-"0 > -a s)-S.o Oc o 3 E W = V C I aC E : C 9 > 0 C) 8o = -C . IC 3 C o OU, 0 o C -Ce W CZ o .I 73 t I. > 5 I 0 s. a. 0- 0 o 0 Z a C U C = o 1: CZ 30 tz I.: E 2 :
:5
-,
,
L 0 Cu U Oc 0 I to ° U C.Z 4 . -o U Wo U, o C C C <U U E" C) 4-co CA E0 ' 0o C . o4n,. W =C ,. elC 0 0 r- C-U C wu . C - CA ._U :: 0 . V O 0 E CZ .O C0 CO G 0 O U 0 C,, O o U C ) NI
o E .-CE C CZ .oE o
30 c C 3: o = , <, *5 0 C)E
VI)
0 0 .) eI,. !: 0 o -a C) 0 r C) U U 0 .) , Cw CM C) 0c CZ -o 0 u 0U-0 U 0 U CZ C cn U: 4: O o ) ._ . U W _ _- _ o z U o 0 Ca U: C) 0a o U CZ t'l J-5) E, *) C) CU k I' -o CZ C.0 C) 3 O 4.-0 o 0 0 0 C) C) U, W ._ zCO CO CU e .E Cu r. cc Q 0 U w Q U = 1. c C) U: -aa: 2 10 z 0 *0 C O 0 o 14 l - . . -. . - r-rn cl :Q~0 *0 rI 03 ca 5:CJ 0 -o0eC, Ul 0 D >0 O 0 U m 0 -0 E a 2 -o ._ O *b *E: b M C Of C F.; t .! r- C) L E cr > = U U I I I 0o C aX *3 r: O '"" 0 .0 c 0 Cd) 0 c C -: 0 · ! o Cd _) Ol -0 C=) C--o C 5: -oCdU: ._ IC$ Cd) C 0 U o._ C) 0 U 0 C3 a0 0P0 -r 0. :-C.50 ,l, 0 0 0 0 N 0U-C 7 =0 -C C o f-c 3 >._ 3_ C.-I 0el , .q 0. O. ,--, ~Z C 0 Z o ._ 0r C.)C o t. ~CZ _ Ce c3 C~ *. cz C -0 .= O .3 . c:3 E 5, -,a c O Q. '= 2 p
B
t-, U cr: C 0 0 ,-_0 o 0 0 0 0 Cd) ._ 0 cnl a 0 C-0 Cd) 0 0 _ to w r 04 .^ C M o0 0 0 r-CZ CZu E o La0 0~-G 0 * - 0 0 0 o ,o e C.) = * I I .0II
1. C 0 E V on -oa,0 [-U 0 C V) 0 0 Hu 0 CS 1 -C Q 2 0 C) 0 C) 30 c. 0 C 0 -0a 0 0 C) .E * 0 N .E -0 0 Cd) -C 0 cn -C 0 0 U P It 0 cr-0= > It ~c D) 0 = oc0 Ur <: CC 0 vi CA) -0 -CZ C) 0 rn C >0 0 "; Cd) CZ CU = I-C oCU) 0 EE 0 -; 04 3 s: n t C = - o 0 Cd) . ,,S:: C0 - O C.) o 0 0- -C cr Q C-- 0 C) Cd C-"0 r - l l Q Q ; C7 0 F2.3 Factors Affecting Recharge Methods
To determine the best location of a recharge facility and to select suitable recharge strategies, we need to understand factors that affect recharge behavior. This section will provide fundamental concepts for choosing recharge methods. After a suitable recharge method is selected, we will then discuss the factors that affect recharge rate and total recharge water in Chapter 3.
In many cases, the site location cannot be predetermined. The choice of recharge method must be based on recharge objectives and the given conditions. These aspects include hydro-geologic characteristics, topography and stream flow, water supply characteristics, legal aspects, availability of land, land use in adjacent area, and public acceptance.
2.3.1 Hydro-Geologic Characteristics
An appropriate type of recharge method depends mainly on the type of aquifer. Direct surface methods are commonly used for recharging unconfined aquifers, while direct subsurface methods are used for confined aquifers. The appropriate choice also depends on physical, chemical and biological properties of the soil. Other relevant hydro-geologic factors include:
- Permeability of unsaturated soil deposits and depth to ground water determine the allowable infiltration rate for surface applications.
- Permeability, specific yield, thickness of saturated subsurface deposits, position and fluctuation of the water table determine the total water storage capacity.
- Transmissivity and hydraulic gradient determine the rate of groundwater movement away from the recharge area, to or away from the withdrawal area.
- Underground structures and barriers affect transmissivity, hydraulic gradient and directio;, of groundwater movement.
2.3.2 Topography and Stream Flow
Topography has a great influence on choosing a recharge method, especially when the surface techniques are considered. Recharge by flooding, irrigation, or land treatment requires relatively flat lands. In contrast, basins, canals, and ditches usually follow topographic contours and can be used in relatively steeper areas. For the subsurface techniques, a topographic setting has very small effect. Subsurface techniques provide alternatives where topography is inappropriate for surface recharge techniques.
2.3.3 Water Supply Characteristics
Two important factors in water supply characteristics are quantity and quality of recharge water. When quantity or availability of recharge water is highly variable, surface application methods are more suitable. Basin and pit techniques have the greatest advantages because they can be designed to contain excess flood flow. Shafts and wells have little storage capacity. Thus, they require less fluctuating water supply.
A decision to select a recharge method also depends on the physical, chemical, and biological quality of recharge water. Physical quality refers to types and amounts of suspended solids, the temperature and the amounts of entrained air. If a large number of suspended particles are present in the recharge water, surface techniques are more efficient than subsurface techniques. Unless pretreatment is efficiently designed, subsurface techniques are prone to failure because of clogging. However, the suspended particles may also cause clogging for surface methods; thus, remedial treatments may be needed for surface methods as well. Ditch and furrow methods are recommended for turbid water because the steady flow of water inhibits settling. If basins are used, they should be placed in a series where the first basin acts as a filter for subsequent basins.
For chemical quality, recharge water should be chemically compatible with existing water in the aquifer. Incompatibility of recharge and existing water may lead to chemical reaction that dissolves aquifer material and produces gases, which consequently results in
clogging or improper pH of water. In addition, some toxic substances may be released as a result of chemical reactions.
The final type of water quality is biological quality. It refers to types and concentrations of living organisms. Harmful biological agents such as algae or bacteria and organic wastes may be presented in recharge water. Although surface methods can reduce significant amounts of organic wastes, bacteria and algae by infiltration , these organisms will cause surface clogging that dramatically decrease the infiltration rate. For direct subsurface methods, injections of water with biological agents directly through wells also lead to serious clogging of well screens or aquifer materials, which are costly and very difficult to remedy.
2.3.4 Miscellaneous Factors
Apart from physical factors, social factors also play important roles in select the artificial recharge methods. For many regions, social factors are the primary concern for determining the recharge type. Availability of land, surface land use, public attitudes, and legal aspects are the examples of social factors that need to be considered. On one hand, in urban areas, where land availability is low and access to land is restricted, subsurface recharge methods are commonly preferable to larger scale surface-spreading recharge methods, even though the costs of operating and maintenance are significantly higher. On the other hand, surface recharge methods are suitable for an irrigation area, where land value is relatively low.
From these general ideas about artificial recharge, we conclude that direct surface recharge methods should be used for irrigation purpose in the San Joaquin Valley. After we select the recharge method, we will estimate total amounts of recharge water and study recharge behavior to plan strategies and evaluate the feasibility of the project.
Chapter 3
Design of a Direct Surface Recharge Facility
In this chapter, we will introduce three main issues that we need to consider for designing a direct surface recharge facility. Then we will discuss these issues in detail on how they can affect the sized, location and recharge strategy of the artificial recharge project.
3.1 Artificial Recharge Design Issues
Three main issues in designing an artificial recharge facility are 1) recharge characteristic issue, 2) water recovery issue, and 3) maintenance issue. Our study will focus mainly on the recharge characteristic issue by introducing a 2-D simulation program to illustrate the behavior of recharge water, and to observe the sensitivity to the change various design factors. We will also address some importance of water recovery and maintenance issue in designing an artificial recharge facility at the end of this chapter.
3.2 Recharge Analysis
For the purposes of conjunctive use in irrigation, direct surface methods are selected to recharge groundwater. In this study, the behavior of recharge water from a ditch and furrow technique is illustrated by using the 2-D computer-modeling program.
3.2.1 The Simulation Model
To study recharge behavior, we use a computer-modeling program called Hydrus 2D. This program can analyze water flow and solute transport in variably saturated and
unsaturated porous media. It uses the finite element method to simulate movement of water, heat and multiple solutes. The program numerically solves the Richards' equation for unsaturated water flow and the Fickian-based advection dispersion equation for heat and solute transport.
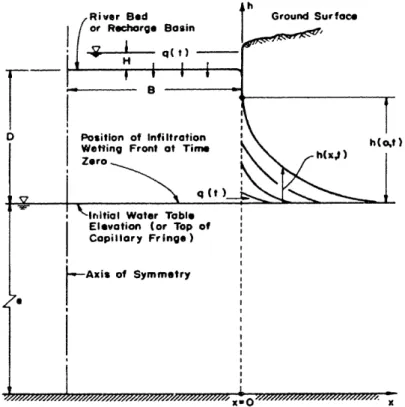
For the simulations, we construct two-dimensional models based on an actual infiltration field as shown in Figure 3-1. It illustrates a cross-section perpendicular to a single ditch. We can assume that the modeled region is a box 1 m. thick with imaginary walls of glass at the front and the back. Subsurface water can only flow in the direction perpendicular to the axis of the infiltration ditch. Note that an infiltration rate from the simulation is in the unit of volume per unit length per time (i.e. m3/m/day) instead of volume per unit area per time (i.e. m/s), which is commonly used.
Figure 3-1: Recharge Water Simulation Model in Hydrus 2-D
1
Developed by U.S. Salinity Laboratory, Agriculture Research Service, U.S. Department of Agriculture, River Side, California. (Version 2.0: April 1999)
25
Wall ot glass
_ ___ I I
3.2.2 Simulation Assumptions
In reality, groundwater recharge behavior is very complex. To correctly simulate the behaviors or groundwater recharge, lots of accurate measurements and data are needed. In addition, the simulations require computers with high capacity to solve complex finite element models.
For simplification, assumptions are made such that we will not have to deal with all of these complicated issues. With appropriate assumptions, simulation models can be easier to solve and required fewer resources, but will give quite accurate results.
The basic assumptions that we use for this case study are as follows:
1) Soil characteristics are homogeneous and isotropic throughout the recharge area. 2) Unconfined aquifers beneath the areas have homogeneous characteristics, i.e.
aquifers have the same depth, hydraulic conductivity, and storage coefficient everywhere.
3) There is no hysteresis for the soil properties, i.e. initial conditions will not affect retention and conductivity curves of the soil.
4) Recharge water is instantly applied to the area and is held constant during the recharge time.
5) Surface soils are dry, and groundwater tables are deep enough such that no
groundwater is lost to evaporation.
6) Recharge water will not leave the recharge areas, and all of the recharge water can be withdrawn and used for irrigation.
7) Superposition is applied for a series of recharge facilities making the hydraulic gradient between two adjacent recharges equal to zero.
3.3 Groundwater recharge behavior
Groundwater recharge starts when supply water begins infiltrating into the ground and refills existing groundwater storage. The behaviors of the recharge can be classified into
two stages:
- Unsaturated flow before recharge water reaches a groundwater table - Saturated flow after recharge reaches a groundwater table
3.3.1 Behaviors of Unsaturated Flow
Unsaturated flow is defined by flow in which a porous medium still has some voids occupied by air. This stage starts right after recharge water first infiltrates into the ground and ends when a wetting front reaches the groundwater table. In this process, the soil can be filled fully with water if a water supply is continually fed over a long period of time.
The length of unsaturated flow is governed by infiltration rate, the rate at which water enters the soil at the surface. This depends mainly on soil properties, especially the hydraulic conductivity of the soil. Moreover, the duration also depends on the depth to groundwater.
Flow in the unsaturated zone is complicated due to complex relationship between water content, pressure head, and hydraulic conductivity. The forces that are involved in recharge behaviors are gravitational force, friction force and suction forced (or negative pressure head) which bind water to soil particles through surface tension. The Richard's equation (1931), derived from mass balance equation and the Darcy's law, can be used to calculate infiltration rate and represent the behaviors of flow in unsaturated zone. We can solve the Richard equation numerically with the finite element method to determine infiltration rates and cumulative recharge fluxes. Eq.1 shows the simplified one-dimension form of the Richard's equation.
at- az a z
K...
+.
.
(Eq.l)
where 0 = Soil Moisture Content t = Time
z = Distance in z-direction K = Hydraulic Conductivity
The Green-Ampt equation is another well-known approach to estimate the infiltration rate and cumulative infiltration. The cumulative infiltration can be solved by the successive substitution method with Eq.2, and then substitute the cumulative infiltration for the infiltration rate in Eq.3.
F(t) = Kt + A In + F(t) .(Eq.2)
(PA 0 ... (Eq.2)
aF(t)
1AO
¢f -) +l
at
F(t)
. .. (Eq.3)where F(t) = Cumulative Infiltration at time t f(t) = Infiltration rate at time t
(p = Wetting front soil suction head AO = - 0,
= Filled water content
However, the most important assumption that may be inappropriate to use in an artificial recharge problem is that the Green-Ampt equation is derived from a semi-infinite system, i.e. the groundwater table is located very deep and has no effect on recharge behavior.
Even though some assumptions of the Green-Ampt equation are not appropriate to deal with an artificial recharge problem, the result from this method is close to the one from numerical model using Richard's equation and finite elements. Flow in this stage is mainly in the vertical direction only. The infiltration rate is described in the vertical direction and depends on hydraulic conductivity, water content, porosity and soil suction. The result in Figure 3-2 shows that the infiltration rate is approaching the hydraulic conductivity of the soil.
Table 3-1: Green-Ampt Infiltration Parameters for Various Soil Classes.
Soi class rosty Effective Wetting front Hydraulic porosity sod suction conductivity
head 71 e, K (Cm) (cm/1) Sand 0.437 0.417 4.95 11.78 (0.374-0.500) (0.354-0.480) (0.97-25.36) Loamy sand 0.437 0.401 6.13 2.99 (0.363-0.506) (0.329-0.473) (1.35-27.94) Sandy loam 0.453 0.412 11.01 1.09 (0.351-0.555) (0.283-0.541) (2.67-45.47) Loam 0.463 0.434 8.89 0.34 (0.375-0.551) (0.334-0.534) (1.33-59.38) Silt loam 0.501 0.486 16.68 0.65 (0.420-0.582) (0.394-0.578) (2.92-95.39) Sandy clay 0.398 0.330 21.85 0.15 loam (0.332-0.464) (0.235-0.425) (4.42-108.0) Clay loam 0.464 0.309 20.88 0.10 (0.409-0.519) (0.279-0.501) (4.79-91.10) Silty clay 0.471 0.432 27.30 0.10 loam (0.418-0.524) (0.347-0.517) (5.67-131.50) Sandy clay 0.430 0.321 23.90 0.06 (0.370-0.490) (0.207-0.435) (4.08-140.2) Silty clay 0.479 0.423 29.22 0.05 (0.425-0.533) (0.334-0.512) (6.13-139.4) Clay 0.475 0.385 3 1.63 0.03 (0.427-0.523) (0.269-0.501) (6.39-156.5)
The numbers in parentheses below each parameter are one standard deviation around the parameter
value given. Source: Rawls. Brakensiek, and Miller, 1983.
Green-Amp Equation for Infiltration (sand K=7. 13 m/day) 7.55 7.50 -7.45 7.40 7.35 . ... 7.30 7.25 7.20 7.15 . , , . 7.10 0 24 48 72 96 120 time (hr)
Figure 3-2: Infiltration Rate from Green-Amp Equation
Because coarse-grained soils are preferable for direct surface methods, the duration of unsaturated flow is relatively short when compared to the total recharge time. Depending on the groundwater depth, the recharge water may only take a few days to reach the water table, whereas the total recharge period lasts for several months. Therefore, the behaviors of this stage are not very important to the overall recharge process. By the time the wetting front reaches the groundwater table, the total amounts of recharge water will be approximately equal to the void spaces in porous media projected from the recharge area to the existing groundwater table.
Table 3-2: Representative Artificial Recharge Rates
Spreading Basins Recharge Wells
Location Rate (nm/day) Location Rate (n'/day)
( alifo)rnia Califorlii
i.)s Angce., O).- 1.9 I:rcno 5(1-221t)
.N:dertr. ().3 -I. 2 I.cs Angeles 2X) Sal (;;llricl River ).6- 1.6 Manhattan It;each I(xK)- 24(X)
m.u )1:tI) luil V;ilvC I -). ) ngc Cove 17( - 22()
Sanita Aria River 0.- 2.9 Sn Fcrn;indc Valley -'(X)
S.;lnlt ('llm Vl;llv. O.i -2.2 'rul:re ( :lillv 3(X)
'lularc (.cLunii' (0. I
vc1nttrl (tomlV o..i-.
New Jersey New .Icrtc!
Lit ()r;nge (. I Ncwarik 15(X)
I'rincct n (0. I
Ncwv N'crk Texas
I.ong islndl O. 2-}.9 l ilas 56(),11
!ligh Plains 7(X}- 270(i
t
Iowa Ncw Y(ork
)cs \oincs o.5 l.ong J.,imnd 5 -s(O- 5-()
Washingln Florida
Richland 2.3 ()rltindo 5(X)- I E)
Mausa;lc'huc ' s Idaho}
Newton 1.3 Mud Like 5(X)- 2 iX)
Frtrll Tlodd ( 19l),. KRprindl tfrom C;rowttltt'fttr !tlrlh<g. (:oprighlt i 99. Jlhn Wihle & .N.Jn,
Inc Reprinted hby pmission of[ohn Wilcy & Snms, Inw.
When the recharge is governed by unsaturated flow, the recharge rate will be approximately equal to the hydraulic conductivity. In fact, recharge rates are generally significantly less than the hydraulic conductivities of the soil. Hence, there should be some other mechanisms that retard the recharge rate and affect the overall recharge behavior.
3.3.2 Behavior of Saturated Flow
Saturated flow is defined by the flow of water in porous media in which water occupies all void spaces. This step begins after a wetting front reaches a groundwater table. Flow in the saturated zone deals with only two phases, solid and liquid phases, and Darcy's laws can be used to estimate the amounts of flow in the saturated zone. However, because water flows in both the vertical and horizontal directions, unlike the one directional unsaturated flow, the recharge behavior is not very easy to solve.
With the vertical flow, the concept of well injection such as the Theis equation cannot be used in this situation. Solving two-dimensional model numerically by the finite element method is the basic approach to estimate the recharge rate and total amount of recharge water. There are some analytical methods to solve for recharge rate, but they are complex, and can be used only in very specific cases.
)
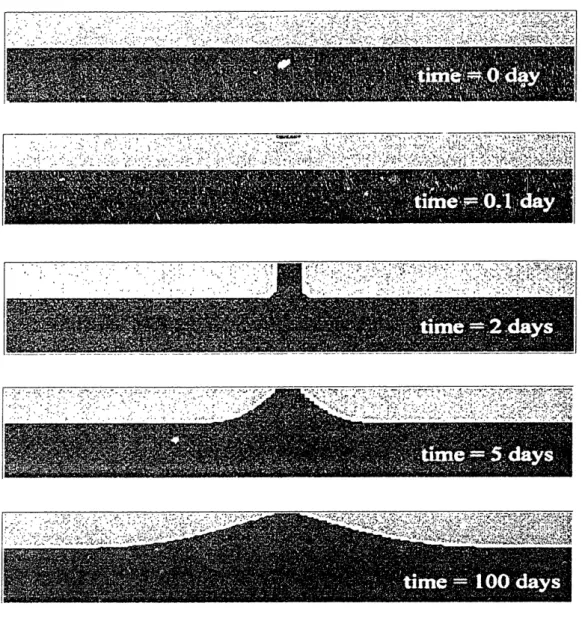
Figure 3-3: Groundwater Mound During Recharge (Asano, 1985)
The infiltration rate for artificial recharge ranges from 0.1 to 1.0 meter/day depending on location (Figure 3-2). Recall from the unsaturated flow in the previous section, the value of the infiltration rate is approximately equal to the hydraulic conductivity of the soil. This rate is significantly higher than what actually happens. Therefore, there should be some mechanisms that redistribute the hydraulic head and reduce the infiltration rate of the recharge water after the wetting front reaches the groundwater table.
Figure 3-3 and figure 3-4 show that, when the wetting front merges with the water in the saturated zone, the incoming recharge water, which once moved vertically, turns around and flows mainly below the water table. From this point on, there will be flow in the horizontal direction, and the water table elevation underneath the recharge area will rise up to the surface. A mound of water will consequently develop and drastically decrease the infiltration rate. Fortunately, the recharge rate does not become zero because the mound tends to dissipate by the hydraulic gradient in the horizontal direction that transports water away from the recharge area.
However, if a series of recharge area are presented, there is no hydraulic gradient between two adjacent furrows due to the superposition effect of these two recharge areas. Thus, the re-harge rate will continue to decline until it reaches zero when all voids are filled up.
From the recharge simulation, three main factors that affect the recharge rate and the total amounts of recharge water are soil characteristics, depth to existing groundwater table, and spacing between two adjacent recharge areas.
'; i ; . .. .. sr' 4),X' I', ,I ., as e-~ ~-',,' i~ , e. IS ~ ~' ,,'~ ,~ ~.~,,~ ¥ ~, ~,; i ,~; ~;~,~" ~ ~.,~,'~'~".~ $.". .. ·. . . .). :*'< ·· ; '·V- -;·rr *·.· :: : ,I,·': · ;: ,: i!: ·.· ·1 r""" ·.r. ·-· I· ·'-: :·'·. : --.i 7·· 1-.i' : ". L: I 'r :, .·-L· i·.
.1.. i·· I·,:- · ·r ::l'::...i i..r..:."'.'\
.:· C,-, -L3g ...· * ·I. ,r' I·VC;I·l ·. · r·· '`"
I-
.:
i.. ... ·:: .. i '''.' :·jy` ··:.· LT:·, "'' ···. ·i 333.4 Effects of Soil Characteristics, Depth to Groundwater, and Spacing
In this recharge study, we are focusing on the purpose of irrigation. We would like to store as much water as we can during the low-demand period and then withdraw it in the high demand period. Thus, our objective for the artificial recharge is to select the artificial recharge site that can recharge the highest amounts of water in a limited time. In other words, select the artificial recharge area with the highest infiltration rate.
Regarding the recharge rate, there are three main factors that govern this behavior for a series of ditch and furrow systems: soil characteristics of recharge areas, depth to existing groundwater table beneath the recharge areas, and spacing between two adjacent recharge areas.
3.4.1 Effects of Soil Characteristics
Soil characteristics of the recharge areas play, perhaps, the most essential roles in groundwater recharge behaviors. Intuitively, we know that water can easily infiltrate through coarse-grained soil. In other words, with comparison to fine-grained soils, coarse-grained soils yield higher infiltration rates, and thus, allow more water to refill groundwater aquifers in the same amounts of time.
It is obvious to conclude that coarser grained soils are more suitable for groundwater recharge facility. However, the real problem is how to specify the differences quantitatively among various types of soils. We would like to know what the recharge rates for different soil types are, so that if the rates do not vary a lot, fine-grained soil may
also be used as an alternative for artificial recharge.
To estimate the recharge rate, three soil types (sand, loamy sand and sandy loam) are selected. Their properties are taken from Carsel and Parrish, 1998 (See Table 3-3). Note that these parameters only represent very approximate averages for the different textural classes.
Table 3-3: Characteristic of Soil Types Used in the Recharge Simulation
Soil Type Qr Qs Ks (m/day) c (m') ~ n
Sand 0.045 0.43 7.128 14.5 2.68
Loamy Sand 0.057 0.41 3.502 12.4 2.28
Sandy Loam 0.065 0.41 1.061 7.5 1.89
Where
Qr = Residual soil water content
Q,
= Saturated soil water content K, = Saturated Hydraulic Conductivitycx,n = Parameter in soil water retention function (van Genuchten: 1980)
The simulation (Figure 3-5) shows that recharge fluxes of all soil types decrease with time, and vary significantly among each soil type. In the first couple of days before the wetting front reaches the groundwater table, depending on the soil type, recharge fluxes are much higher. Then they drop dramatically when the front reaches the groundwater table and continue to decline to some constant values.
As we anticipate, sand allows more recharge water to infiltrate than loamy sand, and sandy loam, respectively. Hydraulic conductivity seems to be the dominant factor that governs the overall behaviors of recharge water. The differences in recharge rates and cumulative recharges are quite significant among soil types. The result shows that the capacity to recharge water for sandy soil is about 1.5 and 2.5 times the capacities for loamy sand and sandy loam, respectively. These differences are as high as 2 to 4 million cubic meter differences if we recharge groundwater for 100 days with a single 1-kilometer long furrow. In other words, these differences in water are sufficient to grow grapes for 250 to 500 hectares in one season.
Effect of Soil Type on Recharge Rate I ___ """'__ _ - Sand -Loamy Sand - Sand Loam
I
_ _ _ _ I _ I 20 40 60 Time (day) 80 100Effect of Soil Type on Cumulative Recharge
8000 i I E 7000 · Sand = · Loamy Sand L000 Sandy Loam , 5000 : 4000 3000 ~ 2000 0 20 40 60 80 Time (day) 100
Figure 3-5: Effect of Soil Type to Recharge Rate and Cumulative Recharge Water
3.4.2 Effect of Depth to Groundwater Table
Beside the importance of soil characteristics on the recharge behaviors, the depth to the existing groundwater is another dominant factor that affects the recharge rate and total amounts of recharge water. From the behaviors of recharge in unsaturated and saturated stages, once recharge water hits an existing groundwater table, the recharge rate will
36 200 - 180 4 160 - 140 i 120 X 100 80 x 80 L 60 40 Q2
20
0 0dramatically drop and continue to decline as a mound develops. Thus, larger recharge rates are expected from deeper groundwater areas.
Recharge Rate at 100days
Vj Ct U UC 0 5 10 15 20 25 30 35 40 Depth to groundwater (m)
Cumulative Recharge at 100days 12,000 E 10,000 U r) 6,000 = 2,000 0 0 5 10 15 20 25 30 Depth to groundwater (m)
Figure 3-6: Effect of Depth to Groundwater on Recharge Rate and
35 40
Cumulative Recharge
The simulation (Figure 3-6) shows that the groundwater depth has a great impact on the recharge rates and the total amounts of recharge water. The result shows that the recharge rates and cumulative recharges are linear functions with the depth to groundwater table. This factor is so important that it allows fine-grained soils to have a
37
higher recharge rate and larger amount of recharge water than coarser ones. For example, the total rechargeable water from sand with a water depth of 20 meters is almost 40% less than that from loamy sand a with water depth of 40 meters.
3.4.3 Effect of Spacing Between Adjacent Recharges
After the recharge water begins to merge with the existing groundwater in the aquifer, mound will develop and the recharge rate drops. Even though the mound tends to grow and expand with time, it will also dissipate due to the hydraulic head gradient in the horizontal direction moving water away from the recharge zone. Thus, the recharge rate will not decline sharply, nor become too small.
Unfortunately, in the case where a series of recharges are placed together side by side, the hydraulic gradients of these recharges will become zero due to superposition. As a consequence, the mound will continue to grow and the recharge rate drops more quickly. The closer these recharges are, the smaller amounts of water can refill groundwater aquifers. Therefore, we should select a suitable spacing between adjacent recharges. This spacing should be large enough to allow a considerable recharge rate but not take too much surface land.
The result shows that the effect of spacing is also a function of recharge time, soil type and depth to groundwater table. At the same recharge time, finer soils and deeper groundwater tables require less spacing. The relationship of recharge rate and cumulative amount of recharge water are non-linear functions of spacing between two adjacent recharge areas. These functions tend to approach some maximum value for particular recharge time. The suitable recharge spacing is selected from the point where the total amount of recharge water begins to be stable. This implies that an additional spacing will not allow any more water to refill the groundwater aquifer.
Effect of Spacing on Recharge Rate 25 E -o :i c) U Ia 20 15 10 5 0 + Sand -- Loamy Sand - Sandy Loam I. 0 200 400 600 800 1000 Spacing (m)
Effect of Spacing on Cumulative Recharge
5000- I
-' * Sand
E
X 4000 -U- Loamy Sand
-Sandy Loam 3000 -U 2000 E 1000 U 0 200 400 600 800 1000 Spacing (m)
Figure 3-7 Effect of Spacing Between Two Adjacent Recharge Site
3.5 Water Recovery
In addition to the ability to recharge groundwater, the capacity to recover water from the subsurface storage is another important issue. Despite a large amount of water recharging the aquifer, the idea of artificial recharge is totally useless, if we cannot pump stored water back to use. Water recovery should be addressed for designing an effective artificial recharge facility, i.e. most or all of the recharge water should be able to recover.
There are many factors that govern the ability to recover recharged water, for example, transmissivity and specific yield of an aquifer, underground barriers, etc. Of many factors, transmissivity of an aquifer is the most important. This property indicates how fast the water can flow toward the pumping wells.
Even though for an aquifer with high transmissivity, the recharge water can leave the recharge area more quickly, we can pump the water at a higher rate. If the pumping period continues immediately after the recharge period, only insignificant amount of water can leave the recharge area. Moreover, as we pump the water, we are creating a cone of depression and a large hydraulic gradient that will force water to flow back toward the wells. Therefore, it is possible to recover all the recharged water within a limited time.
In contrast, if the aquifer has low transmissivity, we cannot pump water at a high rate, otherwise the wells will dry up because water cannot flow to the well fast enough. In this case, we may not be able to recover all the recharged water within a limited time. Thus, we do not obtain the most benefit from artificial recharge project.
3.6 Artificial Recharge Maintenance
To prevent clogging and enhance the ability to recharge water, occasional maintenance is needed for a direct surface recharge facility. Some methods used to prevent clogging
have already mentioned in section 2.3.3. The detail of water treatment and artificial recharge maintenance is beyond the scope of this study.
For a direct surface method, the most common way to prevent surface clogging is by scraping recharge surface or replacing the surface materials. Sometimes chemical substances are used to cure the clogging and enhance the infiltration rate. The frequency and cost of maintenance depends mainly on supply water properties and types of the artificial recharge facilities.
3.7 Conclusion for Groundwater Recharge Analysis
For irrigation purposes, we would like to construct artificial recharge facilities that can store as much water as possible in a limited time. Thus, we are concerned about the factors that will affect the recharge rates and total amounts of recharge water. For a better understanding, a computer simulation program is used to simulate several recharge behaviors based on different recharge factors.
The results show that the three main factors governing the recharge behaviors are the soil characteristics, the depth to groundwater table, and the spacing between two adjacent recharges. In order to have the highest recharge rate, these factors should follow the following conditions.
1. The selected areas should consist of coarse-grained soils, such as gravel or sand that has a high hydraulic conductivity. Coarse-grained soil allows us to supply more recharge water to refill aquifers in a limited amount of time. However, in reality, soil is mixed and heterogeneous. With soil size distribution, fine particles commonly fill the spacing between soil elements. This notably reduces the capacity to recharge water. Hence, in reality, reduction factor of 5 can be
expected when applying the recharge rate from the simulation with a homogeneous soil profile.
2. The selected areas should have deep groundwater tables. Deep groundwater table allow more water to infiltrate into aquifers. However, the costs to pump water back for agricultural purpose should be considered when selecting a suitable groundwater depth.
With the assumption that pumping begins immediately after the recharge time, the mound is not yet dissipated at the beginning of the pumping period. Thus, the energy cost to withdraw water does not depends much on the original groundwater table at first. Never the less, the water table will continue to drop which makes the existing groundwater depth becomes significant factor in determining the required energy to pump the groundwater back to use.
3. When we apply a series of recharge systems, we should provide adequate spacing between two adjacent recharge sites, depending on total recharge time, soil type, and also groundwater depth. The spacing should be great enough to allow significant amount of water to recharge the aquifer. For particular conditions, there is a suitable spacing such that further distance does not yield more recharge water. Besides, additional spacing leads to higher construction, operation and maintenance costs.
We can use these criteria to select candidate sites for artificial recharge in the San Joaquin Valley. After the proposed site is selected, more simulation should be conduct according to the condition of the site to determine the recharge rate and the total amounts of recharge water. Then, we use these results to evaluate the economic feasibility of the project. If the potential benefits exceed the costs, this project is feasible and should be carried out to contribute benefits to the area.
Chapter 4
Site Selection and Economic Analysis
From the simulation results, we can now select candidate sites for the artificial recharge project that satisfy with fundamental criteria in the previous section. After a suitable site is selected, economic analysis should be performed to evaluate the feasibility of applying the artificial recharge project to the area.
4.1 Artificial Recharge Site Selection
In this study, the artificial recharge site is chosen by using ArcView GIS to select the areas in the San Joaquin Valley that have capacities to recharge the largest amounts of water in a limited time and are intuitively practical to construct.
4.1.1 ArcView GIS
Geographical Information Systems, GIS, is a computer system that is capable of assembling, storing, manipulating, and displaying geographically referenced information. GIS technology can be used for scientific investigations, resource management, and development planning. Practitioners also regard the total GIS as including operating personnel and the data that go into the system.
Among many GIS software currently available, ArcView GIS is the most well known program widely used in many organizations. This program is developed by Environmental Research Systems, Inc. By using ArcView GIS to manage recharge data (surface elevation, groundwater level, soil type, land use, etc.), we can easily observe the
relationships between these data and then select the suitable areas for our artificial recharge purpose.
4.1.2 Data for Artificial Recharge Site Selection
Large numbers of information has been used to select appropriated artificial recharge sites in the San Joaquin Valley with ArcView GIS. This data is as follows:
1. Digital Surface Elevation (DEMs)
Surface elevation data is obtained from U.S.G.S. Geographic Data Download website (http://edc.usgs.gov/doc/edchome/ndcdb/ndcdb.html). This data is used as a guideline to see the general topographic of the area and locate flat plains, foothill slopes, and mountains within the San Joaquin area.
2. Groundwater Elevation
The groundwater elevations are provided by California Department of Water Resources, Division of Planning and Local Assistance (http://well.water.ca.gov). The groundwater elevation data is used in ArcView GIS to construct the contours of the groundwater elevation and the depth to groundwater table. The depth to groundwater table is one important factor to determine the recharge rates and total amounts of recharge water in a limited time.
3. Soil Characteristics
Soil data is provided by State Soil Geographic (STATSGO), United States Department of Agriculture. This data is, perhaps, the most important but the most inaccurate information for estimating the recharge rates and total amounts of recharge water. The soil data is at 1:250,000 scales, which is quite a coarse resolution. Because actual soil profiles are very complex and heterogeneous, if we expect to have accurate results, onsite investigation is strongly recommended.
4. Surface Land Use
Land use data is obtained from Department of Water Resources, Division of Planning and Local Assistance (http://www.waterplan.water.ca.gov/). This data provides an additional basis for selecting a more reasonable artificial recharge site (i.e. avoid construction in the urban area.)
By projecting all data together in ArcView GIS, we can see the relationships of each property of the study area. With the relation projected in the save view we can simply get rid of any area that is unqualified to be an effective artificial recharge site, and propose the areas that are suitable to be used for artificial recharge purpose.
Gwdepth99 1.356 -69.675 69.675- 137.993 137.993- 206.312 206.312 - 274.631 274.631 -342.95 411.269 -479.588 479.588 -547.907 547.907 -616.226 No Data ace elevation -260 201 -622 023- 1052 1053 -1526 1527 -2020 2021 -2528 2529 -3085 3086 -4221 No Data 80 0
Figure 4-1: Example of Groundwater Depth and Surface Elevation Data Using ArcView GIS
45 5 -CI -s L"