Infective Therapeutics During Epidemic Outbreaks
The MIT Faculty has made this article openly available.
Please share
how this access benefits you. Your story matters.
Citation
Chaudhuri, Shomesh et al. "Bayesian Adaptive Clinical Trials for
Anti-Infective Therapeutics During Epidemic Outbreaks." Harvard
Data Science Review (May 2020): doi.org/10.1162/99608f92.7656c213
As Published
http://dx.doi.org/10.1162/99608f92.7656c213
Publisher
MIT Press
Version
Final published version
Citable link
https://hdl.handle.net/1721.1/129804
Terms of Use
Creative Commons Attribution 4.0 International license
Detailed Terms
https://creativecommons.org/licenses/by/4.0/
Bayesian Adaptive Clinical
Trials for Anti-Infective
Therapeutics During
Epidemic Outbreaks
Shomesh Chaudhuri, Andrew W. Lo, Danying Xiao, Qingyang Xu
Published on: May 14, 2020
DOI: 10.1162/99608f92.7656c213
ABSTRACT
In the midst of epidemics such as COVID-19, therapeutic candidates are unlikely to be able to complete the usual multiyear clinical trial and regulatory approval process within the course of an outbreak. We apply a Bayesian adaptive patient-centered model—which minimizes the expected harm of false positives and false negatives—to optimize the clinical trial development path during such outbreaks. When the epidemic is more infectious and fatal, the Bayesian-optimal sample size in the clinical trial is lower and the optimal statistical significance level is higher For COVID-19 (assuming a static
and initial infection percentage of 0.1%), the optimal significance level is 7.1% for a clinical trial of a nonvaccine anti-infective therapeutic and 13.6% for that of a vaccine. For a dynamic decreasing from 3 to 1.5, the corresponding values are 14.4% and 26.4%, respectively. Our results illustrate the
importance of adapting the clinical trial design and the regulatory approval process to the specific parameters and stage of the epidemic.
Keywords: COVID-19, Bayesian decision analysis, adaptive clinical trial, anti-infective therapeutics, vaccine, multigroup SEIR epidemic model
Media Summary
In the midst of the COVID-19 pandemic, regulatory agencies charged with the responsibility of evaluating potential anti-infective therapeutics are faced with a dilemma. Effective treatments and vaccines against this highly infectious disease are desperately needed, but the usual timeline required to complete the typical randomized clinical trial and obtain regulatory approval may not be soon enough to prevent the virus from claiming hundreds of thousands of lives and disrupting millions more. How should regulatory agencies adapt their approval process to address the urgency of this burden of disease?
We propose a Bayesian adaptive patient-centered framework to optimize the clinical trial development path for anti-infective therapies and vaccines during an epidemic outbreak. Our Bayesian approach minimizes the expected loss to patients due to both Type I error (approving an ineffective therapy, a false positive) and Type II error (not approving an effective therapy, a false negative). Traditionally, a clinical trial must achieve a Type I error rate below 5% to receive regulatory approval. This prolongs the clinical trial duration because more patients are needed to achieve lower Type I errors. However, for highly infectious and fatal epidemics such as COVID-19, the loss associated with a Type II error can be enormous since the lives of large populations of infected and susceptible individuals are at stake.
.
R
0=
2
A Bayesian approach strikes the optimal balance between Type I and II errors and leads to expedited approval decisions with smaller patient sample sizes and tolerable Type I error rates higher than 5%. We model COVID-19 with different levels of infectivity and fatality to reflect the substantial variability of medical conditions and public health measures in different geographical regions and recommend the optimal patient size and Type I error rate in each scenario. For certain epidemiological models and assumptions, the optimal false positive rate is as high as 26.4%.
Our Bayesian adaptive patient-centered clinical trial framework provides a rational, systematic, transparent, repeatable, and practical framework for regulators, policymakers, and clinical researchers to evaluate the efficacy of anti-infective therapeutics during the course of an epidemic outbreak when the cost of false negatives far outweighs the cost of false positives.
1. Introduction
With growing public concern over the outbreak of Coronavirus Disease 2019 (COVID-19), significant efforts have been undertaken by global biomedical stakeholders to develop effective diagnostics, vaccines, antiviral drugs, medical devices, and other therapeutics against this highly infectious and deadly pandemic. While in the past, the traditional randomized clinical trial (RCT) and regulatory approval process often took several years (U.S. Food & Drug Administration, 2018)—longer than the typical duration of an epidemic outbreak (Pronker et al., 2013)—recently the FDA has responded with actions such as the Breakthrough Devices Program, Emergency Use Authorization (EUA) authority, and Immediately in Effect guidance documents to prevent novel diagnostics and therapeutics from lagging behind the urgent needs of the population. In this article, we propose adapting yet another tool that the FDA has already been exploring for medical devices (Chaudhuri et al., 2018, 2019) to therapeutics for treating COVID-19 that are currently under development.
In recent years, Bayesian adaptive RCT protocols have been increasingly used to expedite the clinical trial process of potentially transformative therapies for diseases with high mortality rates (Berry, 2015). Currently, these protocols have mainly been applied within the oncology domain, such as I-SPY for breast cancer (Barker et al., 2009) and GBM AGILE for glioblastoma (Alexander et al., 2018). These studies use Bayesian inference algorithms to greatly reduce the number of patients needed to assess the therapeutic effects of a drug candidate, without lowering the statistical power of the final approval decision, as measured by Type I and II error rates. As a result, therapeutic candidates can progress more quickly through the regulatory process and reach patients faster and at lower costs.
rejecting an effective therapy as well as expedited approvals of potentially effective treatments. Based on this observation, a patient-centered Bayesian protocol was proposed (Isakov et al., 2019;
Montazerhodjat et al., 2017) that incorporates patient values into clinical trial design and identifies the optimal balance between the possibilities of false positives (Type I error) and false negatives (Type II error). For more severe diseases, this protocol sets a tolerated Type I error rate much larger than the traditional 5% threshold, which leads to higher rates of approvals and expedited approval decisions. However, the original Bayesian adaptive RCT framework does not take into account patient risk preferences. To address this gap, Chaudhuri and Lo (2018) developed an adaptive version of the Bayesian patient-centered model that achieves an optimal balance between Type I and Type II error rates, significantly reducing the number of subjects needed in trials to achieve a statistically
significant conclusion. A key feature of this model is the time evolution of the loss function of the Bayesian decision algorithm. This mechanism favors the expedited approval of diagnostic or
therapeutic candidates that show early positive effects, since patients place a lower value on delayed approval of an effective diagnostic or therapy.
There is a natural but subtle analog to this dilemma in the case of therapeutics for an infectious disease during the course of an epidemic outbreak. Approving an effective therapeutic early will prevent future infections and deaths, while approving it later will save fewer people from infection. On the other hand, approving an ineffective therapeutic early will not prevent any future casualties. Worse still, it may prevent people from taking adequate precautions against infection, since they will falsely believe that they are safe from the disease after the advent of the ineffective therapy.
Moreover, the cost of Type I versus Type II error can differ from therapy to therapy. A novel vaccine that could trigger a significant immune response such as a cytokine storm has a much higher cost of a Type I error than a medical device such as an air filtration system designed to destroy virions through intense ultraviolet light. Therefore, the appropriate statistical threshold for approval should depend on the specific therapy, as well as the circumstances of the current burden of disease.
In this article, we apply the Bayesian adaptive protocol to anti-infective therapeutic development using a loss function that evolves over the course of an epidemic outbreak. We achieve an optimal balance between Type I and Type II errors for therapeutics that treat infectious diseases and identify the optimal time to reach the approval decision based on the accumulation of clinical evidence. Our results show that when the epidemic is more infectious, the necessary sample size of the RCT decreases, while the tolerable Type I error increases. This confirms our earlier intuition that potentially effective therapies that are known to be safe should receive expedited approval when an epidemic is spreading rapidly.
2. Multigroup SEIR Epidemic Model
The starting point for our analysis is the Susceptible-Exposure-Infective-Removed (SEIR) epidemic model, which has been applied to model the outbreak of COVID-19 in China in a number of recent studies (Wu et al., 2020; Yang et al., in press). The population of N subjects is partitioned into four distinct groups: susceptible (S), exposed (E), infectious (I), and removed (R). The time evolution of the epidemic is specified by the following group of ordinary differential equations:
Here we use the convention that are the proportions of the susceptible, exposed, infectious and removed populations, respectively, satisfying the conservation constraint for all :
The parameters denote the average rates of infection, incubation, and recovery, respectively, and denotes the mortality rate of the epidemic. For example, if , we expect 5% of infected subjects will die from the disease. At time , subjects will have died, and will have recovered.
A critical measure of the infectivity of an epidemic is its basic reproduction number, defined as in the SEIR model. This is the expected number of secondary infections caused by each infected subject in a population with no public health measures (such as quarantine, social distancing, or vaccination).
A number of studies have used different statistical schemes to estimate for COVID-19 during its initial outbreak period in central China in January 2020. These estimated values of range from 2.2 (95% CI, 1.4 to 3.9) (Li et al., 2020) to 3.58 (95% CI, 2.89 to 4.39) (Zhao et al., 2020). Given the large uncertainty in the value of , we simulate therapeutic development under scenarios with constant values of 2 and 4.
In addition, to model the impact of governmental nonpharmaceutical interventions (NPIs) on containing the spread of the epidemic, we consider a dynamic transmission SEIR model where the
(1)
dSdt=
−βSI,
=
dt dEβSI
− aE,
=
dt dIaE
− γI,
=
dt dRγI
.
S
(t), E(t), I(t), and R(t)
t
(2) S t +
( )
E t
( )
+
I t
( )
+
R t
( )
=
100% .
β
, a, and γ
μ
∈ (0%, 100%)
μ
= 5%
t μR
(t)N
(1 − μ)R(t)N
R
0=
β
/γ
R
0R
0R
0R
0infection rate, , monotonically decreases over time as a result of the NPIs. Specifically, we assume that takes the sigmoid functional form:
Here and denote the infection rates in the initial and final stages of the epidemic (with ), respectively, denotes the half-life of the decay in infection rate, and the length of the time window when this decay occurred. A larger difference between and ( ) corresponds to a more significant reduction of epidemic transmission, a smaller value of corresponds to a speedier decision to enforce the NPIs, and a smaller value of corresponds to more strict enforcement of the NPIs since decays more rapidly. We calibrate the values and based on the estimates of the dynamic transmission rate of COVID-19 in Wuhan, China, from December 2019 to February 2020 (Kucharski et al., 2020). We consider different values of and to reflect the variability in timing and stringency of NPIs enforced by governments around the globe. Under this dynamic transmission model, the basic reproduction number is given by , which monotonically decreases from to a constant value as increases.
To model the significant variability in mortality rates of COVID-19 for patients in different age groups, we extend this basic model to a multigroup SEIR model, where the population is partitioned into five age groups, (1) below 49, (2) 50 to 59, (3) 60 to 69, (4) 70 to 79, and (5) above 80. We use
to denote the corresponding type in each group (and continue to use
for the total proportion of each type in all groups). The dynamics of the epidemic are specified by the modified ordinary differential equations:
Here denotes the contact rate of the susceptible subjects in the age group with the total infected population, , of all groups. This contact rate is measured relative to group 1, which we normalize to
. In the case of COVID-19, although the mortality rate is much higher for senior populations (Onder et al., 2020), elderly people also tend to have less frequent contact with the infected population outside the household (Walker et al., 2020).
β
(t)
β
(t)
(3) β t =
( )
1+exp(
+
τ t−t2)
β0−β∞β
.
∞β
0β
∞β
0>
β
∞t
2τ
β
0β
∞β
0−
β
∞t
2τ
β
(t)
β
0=
3
β
∞=
1.5
t
2τ
R
0(t) =
β
(t)/γ
β
0/γ
β
∞/γ
t
S
i, E , I , and R
i i iS
, E, I, and R
(4)
dSdti=
−βc S I,
=
i i dEdtiβc S I
i i−
aE
i,
dIdti=
aE
i−
γI
i,
dRdti=
γI
i.
c
ii
thI
c
1=
1
We solve the differential equations in the multigroup SEIR model using the ODE45 solver in MATLAB 2019a with initial conditions for each age group:
.
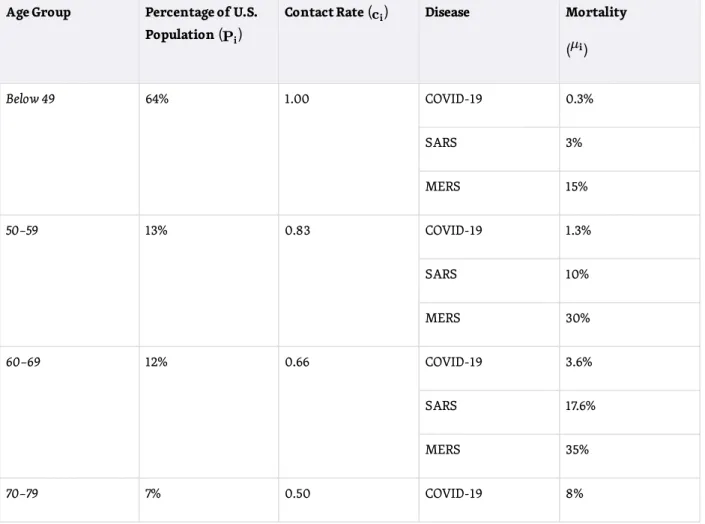
The parameter denotes the proportion of the initially infected population, is the ratio of initially exposed and infected subjects, and is the percentage of the age group in the population. The assumed demographic, contact rate, and mortality rate values are summarized in Table 1.
Table 1. Demographic (U.S. Census Bureau, 2018), Relative Contact Rate (Walker et al., 2020), and Mortality (Onder et al., 2020; World Health Organization 2003, 2019, 2020) Profile of Various Age Groups for COVID-19, SARS, and MERS
(5) [S (0), E (0) , I (0), R (0)] =
i i i i[1 − (1 + r )I , r I , I , 0] ×
e 0 e 0 0P
iI
0r
eP
ii
thAge Group Percentage of U.S. Population ( )Pi
Contact Rate ( )ci Disease Mortality
( )μi Below 49 64% 1.00 COVID-19 0.3% SARS 3% MERS 15% 50–59 13% 0.83 COVID-19 1.3% SARS 10% MERS 30% 60–69 12% 0.66 COVID-19 3.6% SARS 17.6% MERS 35% 70–79 7% 0.50 COVID-19 8%
3. A Bayesian Patient-Centered Approval Process
Similar to Chaudhuri and Lo (2018), we develop a Bayesian patient-centered decision model for RCT approval that minimizes the expected loss (or harm) incurred on the patients by optimally balancing the losses of Type I and Type II errors. Here the loss does not refer to financial costs afforded by the patients, but rather the loss in patient value (i.e., how much patients weigh the relative harms of infection and death). We assign the losses per patient of being susceptible, infected, and deceased. Since Bayesian decision thresholds are invariant under the rescaling of the losses, we normalize by setting the loss per patient infection to 1 ( ). We then assign the loss per patient death relative to
as , and the loss due to susceptibility to the disease as . The parameter values we assume, summarized in Table 2, are meant to represent one reasonable valuation of the relative losses. However, in practice, patient value will differ from one patient group to another, especially given the large variability of the mortality rate of COVID-19 in different age groups (Onder et al., 2020). Here we report the main results of optimal sample size and statistical significance (Tables 3 and 4) assuming
. The results for are provided in the Appendix.
Table 2. Simulation Parameters and Values
SARS 28% MERS 45% Above 80 4% 0.42 COVID-19 14.8% SARS 26.3% MERS 40%
L
I=
1
L
IL
DL
SL
D=
100
L
D=
10
Parameter Description (Source) Value(s)
R0 Basic reproduction number
(Li et al., 2020; Zhao et al., 2020)
2, 4
a Incubation rate (per week) (Yang et al., in press)
γ Recovery rate (per week)
(Yang et al., in press)
1
I0 Initial proportion of infected
population
0.1%, 0.01%
re Ratio of initially exposed and
infected populations
10
[β , β ]0 ∞ Initial and final infection rate in the
dynamic transmission model (Kucharski et al., 2020)
[3, 1.5]
t2 Half-life of decay in the dynamic
model (week)
3, 6
τ Window length of decay in the
dynamic model (week)
0.5, 1
N Population size (million) 300
κ Weekly subject enrollment in each
arm of RCT
100
p0nv Prior probability of having an
ineffective nonvaccine anti-infective therapeutic (Wong et al., 2019)
77%
p0vac Prior probability of having an
ineffective vaccine (Wong et al., 2019) 60%
Δt Time needed to assess the efficacy of
the treatment (week)
1
ρ Signal to noise ratio of treatment
effect (Chaudhuri & Lo, 2018)
0.25
Powermax Maximum power of Bayesian
decision model (Isakov et al., 2019) 0.9
LD Loss per capita from death by
infection
We simulate the multigroup SEIR model over a time period of weeks, where is the duration of the epidemic outbreak. Let denote the weekly subject enrollment rate in each arm of the clinical trial. We assume that the value of is known (or well-estimated) at initial time and stays constant during the course of the outbreak. At time , the Bayesian loss, , of choosing action
under is defined as:
where we define the cumulative number of infected patients, , until time t:
By design, this loss function penalizes Type I errors early in the epidemic by the susceptible term, . We subtract the base level from since the multigroup SEIR model predicts that subjects will not be infected by the epidemic. A Type I error at an earlier time will expose more currently susceptible populations to the epidemic, since members will falsely believe that they are safe from the disease after the advent of the ineffective therapeutic. On the other hand, the loss function also penalizes correct approval decisions made at later stages of an epidemic via the
LI Loss per capita from being infected 1
LS Loss per capita from being
susceptible without precaution
0.2
T
T
κ
R
0t
= 0
t
∈ [0, T ]
C
ij(t)
=
H
i
H
= j
= H 0 (do not approve) H =1 (approve) (no effect) H= 0 0 (S t −( ) S(T ))NLS (effective) H= 1 R(T )N(L +I μLD) CI t NL +( ) I μR(t)NLDCI t
( )
(6) CI t =
( )
E t
( )
+
I t
( )
+
R t
( )
(S t −
( )
S
(T ))NL
SS
(T )
S t
( )
S
(T )N
cumulative infected and death terms, and . A correct but delayed approval decision for the therapeutic is less valuable since it will save fewer susceptible people from infection and death.
The Bayesian decision model considers the null hypothesis, , that the anti-infective therapeutic (or vaccine) has no clinical effect, against the alternative hypothesis that it has positive clinical effect with signal-to-noise ratio (Chaudhuri & Lo, 2018). We use and to denote the Bayesian prior probabilities of and , respectively.
This patient-value model imposes higher losses for incorrect approvals at earlier stages and correct approvals at later stages of an epidemic. Under these constraints, the Bayesian decision algorithm yields the sample size and statistical significance threshold of the RCT that optimally balances Type I and Type II errors.
4. Results
We simulate an epidemic outbreak over a time period of weeks, where is the duration of the outbreak. For an epidemic with higher infectivity, its duration is shorter, which creates more pressure to reach a timely approval decision. To avoid numerical instability, we formally define as the time when the number of cumulative infected subjects first reaches 99.9% of total infections predicted by the SEIR model. We assume an age-specific mortality rate at the level of COVID-19 (Onder et al., 2020; World Health Organization, 2020), and incubation and recovery periods of 7 days each (Yang et al., in press). These estimated parameters can all be challenged to varying degrees, depending on the specific drug-indication pair under consideration and the particular circumstances of the epidemic, but they are meant to be representative of a typical anti-infective therapeutic during the midst of a growing epidemic.
We also assume that it takes 7 days after injection to assess the efficacy of the therapeutic on each subject. We adopt the optimization scheme of Montazerhodjat et al. (2017) to find the optimal Type I and Type II error rates of the nonadaptive Bayesian RCT. To represent typical practice of the
pharmaceutical industry, we optimize under the upper bound on the model’s power,
(Isakov et al., 2019). We then use these optimal error rates as our stopping criteria to simulate the sequential decision process of a Bayesian adaptive RCT via Monte Carlo simulation (Chaudhuri & Lo, 2018). The simulation results are summarized in Tables 3 and 4.
Table 3. Simulation Results of a Bayesian Adaptive RCT for Nonvaccine Anti-infective Therapeutics Obtained From 10,000 Monte Carlo Runs and assuming .1
CI t
( )
μR
(t)
H
= 0
ρ
p
0p
1H
= 0
H
= 1
T
T
T
μ
Power
max=
90%
L = 100
DEpidemic Parameters Nonadaptive Adaptive (10,000 Monte Carlo Runs) Sample Size (H = 0) Sample Size (H = 1) % α Power % R0 µ I0 Sampl e Size %α Power % Mean (SD) Media n (IQR) Mean (SD) Media n (IQR) (1) 2 COVID -19 0.1% 242 7.1 90 135 (103) 105 (63, 176) 148 (107) 119 (73, 192) 5.8 91.5 (2) 4 COVID -19 0.1% 158 17.3 90 115 (83) 91 (56, 149) 98 (80) 74 (42, 128) 14.4 92.1 (3) R0(t) COVID -19 0.1% 176 14.4 90 118 (85) 95 (57, 153) 108 (85) 84 (49, 140) 11.7 92.2 (4) 2 COVID -19 0.01% 399 1.2 90 150 (128) 110 (64, 191) 248 (154) 211 (139, 317) 1.0 91.0 (5) 4 COVID -19 0.01% 274 5.0 90 140 (110) 106 (64, 180) 168 (116) 136 (86, 216) 4.1 91.4 (6) R0(t) COVID -19 0.01% 304 3.6 90 145 (119) 108 (64, 187) 184 (120) 153 (97, 239) 3.0 91.2 (7) 2 SARS 0.1% 164 16.3 90 117 (85) 94 (57, 150) 101 (81) 77 (45, 132) 13.9 92.3 (8) 4 SARS 0.1% 112 27.8 90 98 (72) 79 (47, 128) 72 (64) 51 (27, 95) 23.3 93.2
Note. RCT = randomized clinical trial; denotes the basic reproduction number, µ the disease morality, and the proportion of initial infected subjects. Sample size refers to the number of subjects enrolled in each arm of the RCT. IQR denotes the interquartile range about the median. (t) denotes the dynamic transmission model with weeks,
week, and (t) decreasing from 3 to 1.5 as time t increases.
Table 4. Simulation Results of Bayesian Adaptive RCT for Vaccines Obtained From 10,000 Monte Carlo Runs and assuming .2
(9) R0(t) SARS 0.1% 107 29.2 90 96 (71) 78 (45, 126) 70 (64) 50 (26, 92) 25.1 93.4 (10) 2 MERS 0.1% 88 35.3 90 87 (66) 70 (40, 115) 59 (57) 39 (20, 77) 29.8 93.7 (11) 4 MERS 0.1% 63 45.2 90 73 (59) 59 (30, 100) 46 (49) 28 (14, 60) 38.8 94.5 (12) R0(t) MERS 0.1% 44 54.3 90 61 (54) 48 (20, 86) 36 (43) 19 (9, 46) 47.0 94.8 (1) (2) (3) (4) (5) (6) (7) (8) (9) (10) (11) (12)
R
0I
0R
0t = 3
2τ
= 1
R
0L = 100
DEpidemic Parameters Nonadaptive Adaptive (10,000 Monte Carlo Runs) Sample Size (H = 0) Sample Size (H = 1) %α Power % R0 µ I0 Sampl e Size %α Power % Mean (SD) Media n (IQR) Mean (SD) Media n (IQR) (1) 2 COVID -19 0.1% 181 13.6 90 122 (91) 95 (58, 158) 112 (87) 86 (51, 145) 11.3 92.4
(2) 4 COVID -19 0.1% 111 28.1 90 97 (71) 78 (47, 127) 72 (64) 52 (27, 95) 23.4 92.8 (3) R0(t) COVID -19 0.1% 117 26.4 90 71 (49) 80 (49, 132) 74 (67) 53 (29, 98) 21.8 93.1 (4) 2 COVID -19 0.01% 342 2.3 90 148 (124) 110 (64, 191) 212 (137) 177 (115, 275) 2.1 90.9 (5) 4 COVID -19 0.01% 232 7.9 90 132 (100) 104 (61, 171) 142 (103) 113 (69, 184) 6.6 91.4 (6) R0(t) COVID -19 0.01% 244 6.9 90 132 (101) 102 (63, 171) 148 (106) 118 (73, 191) 5.4 91.7 (7) 2 SARS 0.1% 99 31.7 90 91 (67) 74 (44, 119) 65 (62) 44 (24, 86) 26.6 93.5 (8) 4 SARS 0.1% 65 44.3 90 74 (59) 60 (32, 99) 47 (50) 29 (14, 61) 37.6 94.5 (9) R0(t) SARS 0.1% 50 51.3 90 65 (55) 52 (23, 91) 40 (45) 23 (11, 51) 44.2 94.8 (10) 2 MERS 0.1% 27 64.2 90 49 (49) 36 (11, 71) 28 (37) 13 (6, 34) 55.4 95.9 (11) 4 MERS 0.1% 21 68.1 90 45 (48) 31 (8, 66) 25 (35) 11 (5, 29) 58.9 96.3 (12) R0(t) MERS 0.1% 7 79.2 90 33 (41) 14 (4, 50) 17 (27) 6 (3, 18) 69.1 97.2 (1) (2) (3) (4) (5) (6) (7) (8) (9) (10) (11) (12)
Note. RCT = randomized clinical trial; denotes the basic reproduction number, µ the disease morality, and the proportion of initial infected subjects. Sample size refers to the number of subjects enrolled in each arm of the RCT. IQR denotes the interquartile range about the median. (t) denotes the dynamic transmission model with weeks,
week, and (t) decreasing from 3 to 1.5 as time t increases.
We separate the results into two distinct types of therapeutics—nonvaccine anti-infectives (Table 3) and vaccines (Table 4)—because of the differences in their historical probabilities of success. Vaccine development programs have an estimated probability of success as of 2019Q43, whereas the corresponding figure for nonvaccine anti-infectives is (Wong et al., 2020).
4.1. Nonvaccine Anti-Infective Therapeutics
Static Transmission Rate. We first analyze the case in which the infectivity remains constant over time (e.g., in the absence of effective NPIs). For the fixed-sample Bayesian RCT of a nonvaccine anti-infective therapeutic, as increases from 2 to 4 (rows 1 and 2 of Table 3), the optimal sample size of each experimental arm decreases from 242 to 158 and the optimal Type I error rate drastically
increases from 7.1% to 17.3% (Figure 1), much higher than the traditional 5% threshold. As the epidemic spreads across the population more rapidly, the Bayesian RCT model exhibits greater pressure to expedite the approval process and a much higher tolerance of false positive outcomes.
R
0I
0R
0t
2=
3
τ
= 1
R
0p
1vac=
40%
p
1nv=
23%
R
0R
0For the Bayesian adaptive RCT, when the therapeutic is ineffective ( ), the average sample size required to reject the therapeutic is much smaller than that of the nonadaptive version (columns 7 and 8 of Table 3). Also, the required sample size decreases with the infectivity in both mean and quartiles, yet always achieves a Type I error rate ( ) below that of the nonadaptive version (column 11). The adaptive Bayesian decision model is able to reject an ineffective therapeutic with a relatively small sample size and a bounded false-positive rate.
On the other hand, when the therapeutic is effective ( ), as increases from 2 to 4, the average sample size required by the Bayesian adaptive RCT decreases from 148 to 98 (columns 9 and 10 of Table 3). The Bayesian adaptive model places more weight on approving an effective therapeutic
Figure 1. Bayesian Optimal Type I Error Rate. Optimal Type I error rate, , of a nonadaptive Bayesian randomized clinical trial
(RCT) vs. basic reproduction number (assuming , , disease mortality of COVID-19, and constant ). The Bayesian decision model yields a higher for epidemics with high and low infectivity.
α R0 I = 0.1%0 L = 100D R0 α
H
= 0
R
0α
H
= 1
R
0Bayesian adaptive model simultaneously expedites the approval of an effective therapeutic and retains a bounded false-negative rate. The results are illustrated in Figure 2.
Furthermore, as the proportion of the initially infected population decreases from 0.1% to 0.01% (rows 4 to 6 of Table 3), the optimal sample sizes for nonadaptive and adaptive RCTs both increase, while the optimal Type I error rates decrease. Beginning the clinical trials for a therapeutic during the earlier stages of an epidemic outbreak reduces the need to expedite the approval process in order to contain its future spread. Clinicians and researchers have more time to evaluate the efficacy of a therapeutic and record adverse effects by testing it on a larger number of subjects, which leads to a lower Type I error rate.
Figure 2. Bayesian Adaptive RCT Patient Sample Size under H = 1. Subject sample size in each arm of a Bayesian adaptive
randomized clinical trial (RCT) under H = 1 decreases with the basic reproduction number (assuming , and disease mortality of COVID-19). BNA denotes Bayesian nonadaptive optimal; BA 50% denotes median patient size of Bayesian
adaptive. The 25% and 75% quantiles of Bayesian adaptive patient size are shown as lower and upper ends of the error bar.
R0 I = 0.1%0 L = 100D
Finally, when the mortality rate increases from the level of COVID-19 (Onder et al., 2020; World Health Organization, 2020), to the level of SARS (World Health Organization, 2003), and further to the level MERS (World Health Organization, 2019), the optimal sample sizes for both nonadaptive and adaptive Bayesian models decrease and the optimal Type I error rates increase (rows 7 to 12 of Table 3). When the epidemic is more lethal, the Bayesian adaptive model requires fewer subjects in the RCT, since both Type I and Type II errors will lead to greater losses due to death by infection. The higher death tolls provide significantly more incentive in the Bayesian adaptive framework to approve the therapeutic in the hopes of saving more people from future infection and death.
One interesting feature of the Bayesian decision model is that the optimal Type I error rate is not a monotonic function of , but rather has a minimum around for COVID-19, as shown in Figure 1. As decreases below 1.7, the optimal Type I error rate increases. The intuition for this result that we define the loss of Type I error as the excess risk of being susceptible to infection,
, where is the fraction of the population that remains uninfected throughout the epidemic outbreak. When is small, is close to 100% and the excess risk,
, is small compared to the benefit of preventing future deaths. Therefore, when the epidemic is not very infectious, the Bayesian decision model expedites the approval decision. This also confirms the intuition that smaller sample sizes are required in adaptive trials for diseases that affect a small fraction of the population. If we instead define the loss of Type I error as the absolute risk of being susceptible, , we find that the optimal Type I error indeed monotonically increases with , as shown in Figure A3 in the Appendix.
Dynamic Transmission Rate. The results for the dynamic transmission model with , , weeks, and week are also summarized in Table 3. For COVID-19 (rows 3 and 6 in Table 3), we find that the Bayesian optimal sample size and Type I error rate of the dynamic transmission model lie in-between the corresponding values under scenarios and This suggests that timely and effective government interventions will protect more subjects from infection and allow more time for the RCT.
However, for the more fatal SARS and MERS (rows 9 and 12 in Table 3), the dynamic transmission model sets higher optimal Type I errors and smaller sample sizes than . This is due to the U-shaped curve of optimal vs. , shown in Figure 1. When the NPIs reduce below a certain threshold, the optimal starts to increase. For highly fatal epidemics, when the government adopts NPIs to protect most of the susceptible population from infection, the regulatory priority should be to expedite potentially effective treatments that can help current patients since the loss of Type I error is much lower than that of the Type II error.
In addition, we investigate the impact of the timing and stringency of NPIs enforced by the
μ
R
0R
0=
1.7
R
0(S t −
( )
S
(T ))NL
SS
(T )
R
0S
(T )
(S t −
( )
S
(T ))NL
SS t NL
( )
SR
0β
0= 3
β
∞= 1.5
t = 3
2τ
= 1
R = 2
0R = 4.
0R
0=
4
α
R
0R
0(t)
α
optimal Type I error is larger for weeks than weeks. Therefore, if the government adopts well-enforced NPIs early on (such as the lockdown in Wuhan, China) to protect the susceptible population, this will reduce the loss associated with Type I error, leading to expedited approvals of potentially effective therapeutics. Furthermore, the sooner an effective therapeutic is approved, the sooner will NPIs be lifted.
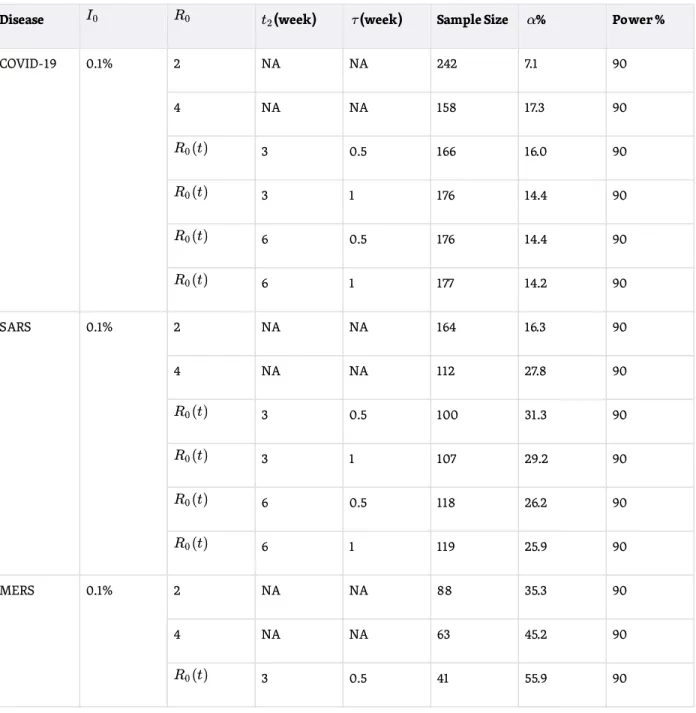
Table 5. Optimal Sample Size and Type I Error ( ) of Bayesian Nonadaptive RCT for Nonvaccine Anti-infective Therapeutics for Dynamic Transmission Model
t
2=
3
t
2=
6
α
Disease I0 R0 t2(week) (week)τ Sample Size %α Power %
COVID-19 0.1% 2 NA NA 242 7.1 90 4 NA NA 158 17.3 90 R0(t) 3 0.5 166 16.0 90 R0(t) 3 1 176 14.4 90 R0(t) 6 0.5 176 14.4 90 R0(t) 6 1 177 14.2 90 SARS 0.1% 2 NA NA 164 16.3 90 4 NA NA 112 27.8 90 R0(t) 3 0.5 100 31.3 90 R0(t) 3 1 107 29.2 90 R0(t) 6 0.5 118 26.2 90 R0(t) 6 1 119 25.9 90 MERS 0.1% 2 NA NA 88 35.3 90 4 NA NA 63 45.2 90 R0(t) 3 0.5 41 55.9 90
Note. RCT = randomized clinical trial; denotes the basic reproduction number, µ the disease morality, and the proportion of initial infected subjects. Sample size refers to the number of subjects enrolled in each arm of the RCT. (t) denotes the use of a dynamic transmission model with , .
4.2. Vaccines
We repeat the above analysis for an RCT of a vaccine using a prior probability of having an effective vaccine .4 The simulation results are summarized in Table 4. Overall, we observe the same pattern in the optimal sample size and Type I error rates on infectivity, mortality, and proportion of initial infections. However, since is higher for vaccines, the Bayesian decision model requires fewer subjects, on average, in the RCT to ascertain the positive effects of the vaccine, compared to the case of anti-infective therapeutics in Table 3. We find that vaccines should receive even more expedited evaluation.
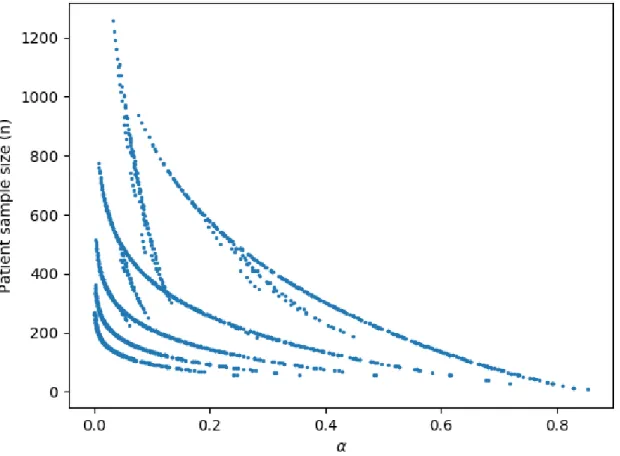
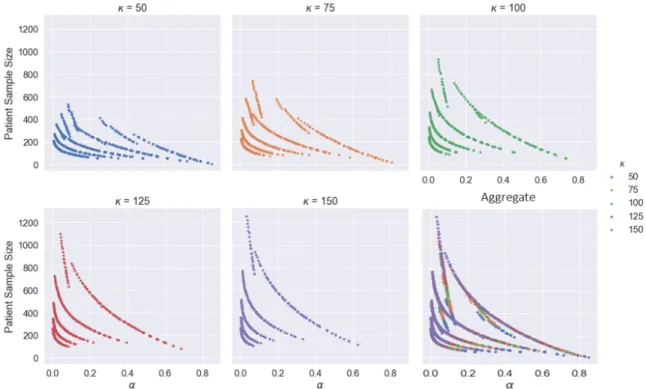
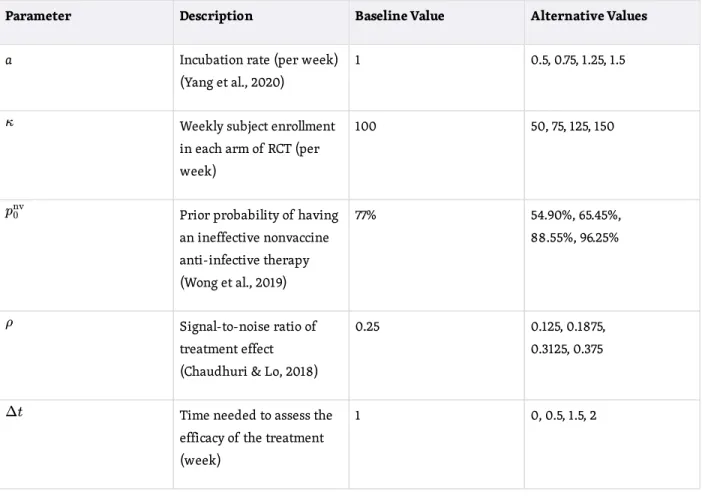
4.3. Five-Factor Sensitivity Analysis
To assess the robustness of our model’s predictions against the assumed values of model parameters, we perform a five-factor sensitivity analysis for the static transmission rate model with . The baseline and alternative parameter values are summarized in Table A1. The scatterplot of optimal Type I error ( ) vs. sample size of Bayesian nonadaptive RCT model is shown in Figure 3 (related summary statistics are shown in Table A5 in the Appendix). We find that the scatterplot consists of several curves. To clearly identify the effect of any given parameter, we show the results for the most important parameters in separate scatterplots in Figures 4 to 6 (additional results are provided in the Appendix). R0(t) 3 1 44 54.3 90 R0(t) 6 0.5 59 47.0 90 R0(t) 6 1 60 46.5 90
R
0I
0R
0β
0=
3 β =
∞1.5
p
1vac=
40%
p
1R
0=
2
α
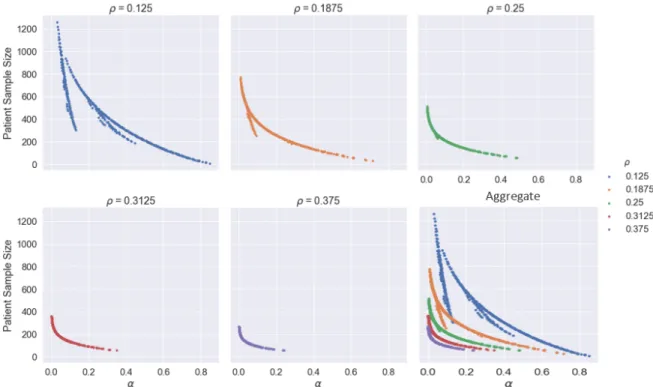
We find that the different curves in Figure 3 result from different values of , the signal-to-noise ratio (SNR) of treatment effect (Chaudhuri & Lo, 2018), as shown in Figure 4. For a given significance level a smaller value of leads to larger optimal sample size. If the efficacy of the anti-infective therapeutic is insignificant (small ), the distributions of z-score under the null hypothesis, (no effect), and alternative hypothesis, (positive effect with SNR ), are difficult to distinguish statistically. Hence, a larger sample size is needed to evaluate the efficacy at the given significance level, .
In addition, with a fixed SNR, the magnitudes of and sample size are mainly determined by , the Bayesian prior probability of having an ineffective anti-infective therapeutic. A larger value of
leads to a smaller and a larger sample size (Figure 5). When past drug development outcomes in the anti-infective domain strongly suggest that the current anti-infective therapeutic is unlikely to be effective (large ), the Bayesian framework requires many more observations to shift the posterior distribution in order to prove its efficacy. For notational convenience, we denote by in Figure 5.
Figure 4. Scatterplot of optimal Type I error rate ( ) vs. sample size for different values of , signal-to-noise ratio of the treatment effect (Chaudhuri & Lo, 2018).
α ρ
ρ
α
,
ρ
ρ
H
= 0
H
= 1
ρ
α
α
p
0nvp
0nvα
p
0nvp
0nvp
0Figure 5. Scatterplot of optimal Type I error rate ( ) vs. sample size for different values of , Bayesian prior probability of having an ineffective therapeutic.
α p0
Figure 6. Scatterplot of optimal Type I error rate ( ) vs. sample size for different values of , weekly patient enrollment rate (patients per week) in each arm of a randomized clinical trial.
A similar but less significant effect on the magnitudes of and sample size is generated by , the weekly subject enrollment in each arm of the RCT. A larger value of leads to a smaller and a larger sample size (Figure 6). When the RCT enrolls patients at a faster rate, clinical researchers may
evaluate the efficacy of the treatment based on more observations earlier on during the epidemic outbreak. Hence, the approval decision may be reached with lower false positive error.
In Figures A1 and A2 of the Appendix, we show that the five-factor sensitivity analysis reveals no significant dependence of and sample size on , the time needed to assess the treatment efficacy, as well as , the incubation period of the disease. However, the analysis does show that extreme values of the Bayesian optimal Type I error rate are generated by large values of and small values of . These regions of parameter space can be avoided if the anti-infective therapeutic under
investigation has promising preclinical evidence to support its efficacy (reducing ) and the RCT is designed to verify reasonably significant treatment effects over the control arm (increasing ). To provide readers with greater transparency and intuition for our Bayesian decision model, we provide the source code, allowing users to input their own parameter values of interest to see how the results change. We also encourage users to adapt our code to their own contexts, as well as to
experiment with alternate epidemiological models of infection and loss functions.
5. Discussion
A natural consequence of using a patient-centered framework for determining the approval threshold is, of course, more false positives—and the potential for a greater number of patients with adverse side-effects—in cases where the burden of disease is high. These false positives can be addressed through more vigilant post-approval surveillance by regulatory agencies and greater requirements for drug and device companies to provide such patient-level data to the regulator following approval. Failure to provide such data or evidence of an ineffective therapy can be grounds for revoking the approval.
However, past experience shows that withdrawing an approved drug can be challenging and
disruptive for several reasons (Onakpoya et al., 2019). Therefore, implementing the patient-centered approach may require creating a new category of temporary approvals for crisis situations involving urgent needs at national or international levels, similar to the FDA’s EUA program. Such a program might involve provisional approval of a candidate therapy consisting of a one- or two-year license— depending on the nature of the drug-indication pair—to market the therapy to a prespecified patient population, no off-label use of the therapy, and regular monitoring and data reporting to the regulator by the manufacturer and/or patients’ physicians during the licensing period (Lo, 2017). At the end of this trial period, one of two outcomes would occur, depending on the accumulated data during this
α
κ
κ
α
α
Δt
a
p
0nvρ
p
0nvρ
license. Of course, at any point during the trial period, the regulator can terminate the license if the data show that the therapeutic is ineffective and/or unsafe.
While such a process may impose greater burdens on patients, manufacturers, and regulators, it may still be worthwhile if it brings faster or greater relief to patients facing mortal illnesses and extreme suffering. In this respect, an urgent-needs program may be viewed as a middle ground between a standard clinical trial and an approval, similar in spirit to the adaptive designs of sophisticated clinical trials with master protocols such as I-SPY 2, LUNG-MAP, and GBM-AGILE, in which patient care and clinical investigations are simultaneously accomplished. Also, because the Centers for Medicare and Medicaid Services (CMS) has demonstrated a willingness to cover the cost of certain therapeutics for which evidence is still being generated (see, for example, CMS’s “coverage with evidence” programs), additional economic incentives may be available to support such temporary licenses.
Finally, we note that the age-group specification in our SEIR model mainly focuses on older
populations, whose mortality risks with COVID-19 are much higher than younger populations (Onder et al., 2020). More refined age-group specifications are needed to differentiate the transmission rates of COVID-19 among children, teenagers, and young adults, as well as to reflect the different societal benefits each age group will receive from the approval of an effective anti-infective therapeutic or vaccine.
6. Conclusion
We apply the Bayesian adaptive patient-centered model of Chaudhuri and Lo (2018) to clinical trials for therapeutics that treat infectious diseases during an epidemic outbreak. Using a simple
epidemiological model, we find that the optimal sample size in the clinical trial decreases with the infectivity of the epidemic, measured by the basic reproduction number . At the same time, the optimal Type I error rate increases with Lower levels of initial infection increase the number of subjects required to verify the therapeutic efficacy of the therapeutic under investigation, while higher levels of mortality increase the optimal sample size. The results confirm our intuition that clinical trials should be expedited and a higher false positive rate should be tolerated when the epidemic spreads more rapidly through the population, has a higher mortality rate, and has already infected a sizable portion of the population at the beginning of the RCT.
To provide transparency for how a patient-centered approach differs from the traditional statistical framework in the anti-infectives context, we use a relatively simple mathematical model of epidemic disease dynamics to estimate the societal loss in an outbreak. More sophisticated epidemiological models can easily be incorporated into our framework at the cost of computational tractability and transparency.5
R
0R
0.
One interesting trade-off to be explored is the difference between a COVID-19 vaccine and an antiviral treatment that can cure an infected patient. While prevention through vaccination is the ultimate goal, a successful treatment for the disease using repurposed drugs that have already been approved for other indications (and whose safety profile has already been established) may be even more valuable, especially if they can be deployed in the nearer term and reduce the growing fear and panic among the general population. In such cases, the approval threshold should clearly reflect these cost–benefit differences.
Of course, in practice, regulators consider many factors beyond p values in making their decisions. However, that process is opaque even to industry insiders, and the role of patient preferences is unclear. The proposed patient-centered approach provides a systematic, objective, adaptive, and repeatable framework for explicitly incorporating patient preferences and burden-of-disease data in the therapeutic approval process. This framework also fulfills two mandates for the FDA, one from the fifth authorization of the Prescription Drug User Fee Act (PDUFA) for an enhanced quantitative approach to the benefit–risk assessment of new drugs (U.S. FDA, 2013), and the other from Section 3002 of the 21st Century Cures Act of 2016 requiring the FDA to develop guidelines for patient-focused drug development, which includes collecting patient preference and experience data and explicitly incorporating this information in the drug approval process.
We hope this work will shed further insight into improving the current clinical trial process for infectious disease therapeutics and contribute to the timely development of effective treatments and vaccines for COVID-19 in particular.
Disclosure Statement
The views and opinions expressed in this article are those of the authors only, and do not represent the views, policies, and opinions any institution or agency, any of their affiliates or employees, or any of the individuals acknowledged below.
S. Chaudhuri, D. Xiao, and Q. Xu report no conflicts. A. Lo has personal investments in biotechnology companies, biotech venture capital funds, and mutual funds, and is a co-founder and partner of QLS Advisors, a healthcare analytics and consulting company. He is also an advisor to BrightEdge and Thales; an advisor to and investor in BridgeBio Pharma; a director of Roivant Sciences Ltd. and Annual Reviews; chairman emeritus and senior advisor to AlphaSimplex Group; and a member of the Board of Overseers at Beth Israel Deaconess Medical Center. Finally, Lo is a member of the NIH’s National Center for Advancing Translational Sciences Advisory Council and Cures Acceleration Network Review
Chicago Mercantile Exchange, Financial Times, Harvard University, IMF, National Bank of Belgium, Q Group, Roivant Sciences, Scotia Bank, State Street Bank, University of Chicago, and Yale University.
Acknowledgments
We thank Murray Sheldon, Chi Heem Wong, the editor, associate editor, copyeditor, and several reviewers for many helpful comments and suggestions, and Jayna Cummings and Steven Finch for editorial assistance. Research support from the MIT Laboratory for Financial Engineering is gratefully acknowledged.
References
21st Century Cures Act, H.R. 34, 114th Cong. (2016).
Alexander, B. M., Ba, S., Berger, M.S., Berry, D. A., Cavenee, W. K., Chang, S. M., Cloughesy, T. F., Jiang, T., Khasraw, M., Li, W., Mittman, R., Poste, G. H., Wen, P. Y., Yung, W. K. A., Barker, A. D., GBM AGILE Network (2018). Adaptive global innovative learning environment for glioblastoma: GBM AGILE. Clinical Cancer Research, 24(4), 737–743. https://doi.org/10.1158/1078-0432.CCR-17-0764
Barker, A., Sigman, C., Kelloff, G., Hylton, N., Berry, D., & Esserman, L. (2009). I-SPY 2: An Adaptive breast cancer trial design in the setting of neoadjuvant chemotherapy. Clinical Pharmacology & Therapeutics, 86(1), 97–100. https://doi.org/10.1038/clpt.2009.68
Berry, D. (2015). The Brave New World of clinical cancer research: Adaptive biomarker-driven trials integrating clinical practice with clinical research. Molecular Oncology, 9(5), 951–959.
https://doi.org/10.1016/j.molonc.2015.02.011
Chaudhuri, S. E., Hauber, B., Mange, B., Zhou, M., Ho, M., Saha, A., Caldwell, B., Benz, H. L., Ruiz, J., Christopher, S., Bardot, D., Sheehan, M., Donnelly, A., McLaughlin, L., Gwinn, K., Sheldon, M., & A. W. Lo. (2019). Use of Bayesian decision analysis to maximize value in patient-centered randomized clinical trials in Parkinson’s Disease, under review.
Chaudhuri, S. E., & Lo, A. W. (2018). Bayesian adaptive patient-centered clinical trials, under review. Chaudhuri, S. E., Sheldon, M., Irony, T., Ho, M. and A. W. Lo. (2018). Patient-centered clinical trials. Drug Discovery Today, 23(2), 395–401. https://doi.org/10.1016/j.drudis.2017.09.016
Isakov, L., Lo, A. W., & Montazerhodjat, V. (2019) Is the FDA too conservative or too aggressive? A Bayesian decision analysis of clinical trial design. Journal of Econometrics, 211(1), 117–136.
Kucharski, A. J., Russell, T. W., Diamond, C., Liu, Y., Edmunds, J., Funk, S., & Eggo, R. M. on behalf of the Centre for Mathematical Modelling of Infectious Diseases COVID-19 working group (2020). Early dynamics of transmission and control of COVID-19: A mathematical modelling study. The Lancet Infectious Diseases. Advance online publication. https://doi.org/10.1016/S1473-3099(20)30144-4
Li, Q., …, & Feng, Z. (2020). Early transmission dynamics in Wuhan, China, of novel coronavirus-infected pneumonia. New England Journal of Medicine, 382, 1199–1207.
https://doi.org/10.1056/NEJMoa2001316
Lo, A. (2017). Discussion: New directions for the FDA in the 21st century. Biostatistics, 18(3), 404–407.
https://doi.org/10.1093/biostatistics/kxx019
Montazerhodjat, V., Chaudhuri, S. E., Sargent, D. J., & Lo, A. W. (2017). Use of Bayesian decision analysis to minimize harm in patient-centered randomized clinical trials in oncology. JAMA Oncology, 3(9), e170123. https://doi.org/10.1001/jamaoncol.2017.0123
Onakpoya, I.J., Heneghan, C.J., & Aronson, J.K. (2019). Post-marketing withdrawal of 462 medicinal products because of adverse drug reactions: A systematic review of the world literature. BMC Medicine 17(56). https://doi.org/10.1186/s12916-019-1294-9
Onder, G., Rezza, G., & Brusaferro, S. (2020). Case-fatality rate and characteristics of patients dying in relation to COVID-19 in Italy. JAMA. Advance online publication. https://doi.org/10.1001/jama.2020.4683
Pronker, E. S., Weenen, T. C., Commandeur, H., Claassen, E. H., & Osterhaus, A. D. (2013) Risk in vaccine research and development quantified. PLoS One, 8(3), e57755.
https://doi.org/10.1371/journal.pone.0057755
U.S. Census Bureau. (2018). U.S. Demographics by Age and Sex (Table ID: S0101). Retrieved from
https://data.census.gov/
U.S. Food & Drug Administration. (2013). Structured approach to benefit-risk assessment in drug regulatory decision-making: Draft PDUFA V implementation plan—February 2013, Fiscal Years 2013–2017.
http://www.fda.gov/downloads/ForIndustry/UserFees/PrescriptionDrugUserFee/UCM329758.pdf. U.S. Food & Drug Administration. (2018, January 30). Vaccine product approval process. Retrieved March 8, 2020, from
https://www.fda.gov/vaccines-blood-biologics/development-approval-process-cber/vaccine-product-approval-process
Walker, P. G. T., …, & Ghani, A. C. (2020) Report 12: The global impact of COVID-19 and strategies for mitigation and suppression. WHO Collaborating Centre for Infectious Disease Modelling, MRC Centre
Analytics, Imperial College London. https://www.imperial.ac.uk/mrc-global-infectious-disease-analysis/covid-19/report-12-global-impact-covid-19/
Wong, C. H., Siah, K. W., & Lo, A. W. (2019). Estimation of clinical trial success rates and related parameters. Biostatistics, 20(2), 273–286. https://doi.org/10.1093/biostatistics/kxx069
Wong, C. H., Siah, K. W., & Lo, A. W. (2020, April 8). Estimating probabilities of success of clinical trials for vaccines and other anti-infective therapeutics. Preprint, medRxiv.
https://doi.org/10.1101/2020.04.09.20059600
World Health Organization. (2020). Coronavirus disease 2019 (COVID-19) situation report–59.
https://www.who.int/docs/default-source/coronaviruse/situation-reports/20200319-sitrep-59-covid-19.pdf?sfvrsn=c3dcdef9_2
World Health Organization. (2003). Consensus document on the epidemiology of severe acute respiratory syndrome (SARS). https://www.who.int/csr/sars/en/WHOconsensus.pdf
World Health Organization. (2019). MERS situation update, December 2019.
http://www.emro.who.int/pandemic-epidemic-diseases/mers-cov/mers-situation-update-december-2019.html.
Wu, J. T., Leung, K., & Leung, G. M. (2020). Nowcasting and forecasting the potential domestic and international spread of the 2019-nCoV outbreak originating in Wuhan, China: A modelling study. Lancet, 395(10225), 689–697. https://doi.org/10.1016/S0140-6736(20)30260-9
Yang, Z., …, & He, J. (in press). Modified SEIR and AI prediction of the epidemics trend of COVID-19 in China under public health interventions. Journal of Thoracic Disease.
http://dx.doi.org/10.21037/jtd.2020.02.64
Zhao, S., Lin, Q., Ran, J., Musa, S. S., Yang, G., Wang, W., Lou, Y., Gao, D., Yang, L., He, D., & Wang, M. H. (2020). Preliminary estimation of the basic reproduction number of novel coronavirus (2019-nCoV) in China, from 2019 to 2020: A data-driven analysis in the early phase of the outbreak. International Journal of Infectious Diseases, 92, 214–217. https://doi.org/10.1016/j.ijid.2020.01.050
Appendix
Table A2. Optimal Sample Size and Type I error rate ( ) for Bayesian Nonadaptive RCT for Anti-infective Therapeutics With (Basic Reproduction Number) Close to 1
Parameter Description Baseline Value Alternative Values
a Incubation rate (per week) (Yang et al., 2020)
1 0.5, 0.75, 1.25, 1.5
κ Weekly subject enrollment
in each arm of RCT (per week)
100 50, 75, 125, 150
p0nv Prior probability of having
an ineffective nonvaccine anti-infective therapy (Wong et al., 2019) 77% 54.90%, 65.45%, 88.55%, 96.25% ρ Signal-to-noise ratio of treatment effect (Chaudhuri & Lo, 2018)
0.25 0.125, 0.1875, 0.3125, 0.375
Δt Time needed to assess the
efficacy of the treatment (week)
1 0, 0.5, 1.5, 2
α
R
0Disease R0 I0 Sample Size %α Power %
COVID-19 1.25 0.1% 185 13.1 90 1.5 0.1% 239 7.3 90 1.75 0.1% 250 6.5 90 2 0.1% 242 7.1 90 4 0.1% 158 17.3 90 1.25 0.01% 233 7.8 90
Note. RCT = randomized clinical trial; µ denotes the disease morality and the proportion of initial infected subjects.
Sample size denotes the number of subjects enrolled in each arm of the RCT.
Table A3. Simulation Results of Bayesian adaptive RCT for Nonvaccine Anti-infective Therapeutics Obtained From 10,000 Monte Carlo Runs and assuming
1.75 0.01% 395 1.3 90 2 0.01% 399 1.2 90 4 0.01% 274 5.0 90 SARS 1.25 0.1% 69 42.6 90 1.5 0.1% 140 20.9 90 1.75 0.1% 162 16.6 90 2 0.1% 164 16.3 90 4 0.1% 112 27.8 90 MERS 1.25 0.1% 6 80.2 90 1.5 0.1% 51 50.8 90 1.75 0.1% 80 38.2 90 2 0.1% 88 35.3 90 4 0.1% 63 45.2 90
I
0L = 10
DEpidemic Parameters Nonadaptive Adaptive (10,000 Monte Carlo Runs) Sample Size (H = 0) Sample Size (H = 1) %α Power % R0 µ I0 Sampl e Size %α Power % Mean (SD) Media n (IQR) Mean (SD) Media n (IQR)
(1) 2 COVID -19 0.1% 281 4.7 90 141 (113) 107 (63, 182) 175 (121) 142 (90, 226) 3.7 91.3 (2) 4 COVID -19 0.1% 176 14.4 90 119 (86) 96 (59, 153) 108 (85) 83 (48, 139) 11.9 92.3 (3) R0(t) COVID -19 0.1% 213 9.7 90 129 (95) 101 (61, 168) 131 (97) 103 (63, 168) 8.3 91.7 (4) 2 COVID -19 0.01% 433 0.8 90 150 (128) 109 (64, 191) 272 (166) 223 (156, 348) 0.6 91.1 (5) 4 COVID -19 0.01% 290 4.2 90 143 (113) 108 (63, 185) 177 (119) 145 (92, 229) 3.3 91.1 (6) R0(t) COVID -19 0.01% 345 2.3 90 146 (118) 111 (65, 188) 217 (119) 181 (117, 282) 1.9 91.0 (7) 2 SARS 0.1% 262 5.7 90 138 (107) 107 (63, 179) 161 (115) 130 (81, 207) 4.6 91.4 (8) 4 SARS 0.1% 167 15.8 90 118 (86) 94 (57, 154) 102 (82) 77 (46, 133) 13.6 92.3 (9) R0(t) SARS 0.1% 194 11.9 90 126 (93) 100 (60, 165) 118 (90) 92 (55, 154) 9.7 92.5 (10) 2 MERS 0.1% 227 8.4 90 130 (97) 102 (62, 167) 140 (101) 112 (68, 181) 7.4 91.6
Note. RCT = randomized clinical trial; denotes the basic reproduction number, µ the disease morality, and the proportion of initial infected subjects. Sample size refers to the number of subjects enrolled in each arm of the RCT. IQR denotes the interquartile range about the median. (t) denotes the dynamic transmission model with weeks,
week, and (t) decreasing from 3 to 1.5 as time t increases.
Table A4. Simulation Results of Bayesian Adaptive RCT for Vaccines Obtained From 10,000 Monte Carlo Runs and assuming
(11) 4 MERS 0.1% 149 19.0 90 110 (78) 89 (55, 142) 93 (78) 69 (39, 122) 16.1 92.7 (12) R0(t) MERS 0.1% 163 16.5 90 116 (84) 93 (56, 151) 101 (82) 78 (45, 121) 13.7 92.2 (1) (2) (3) (4) (5) (6) (7) (8) (9) (10) (11) (12)
R
0I
0R
0t = 3
2τ
= 1
R
0L =10
DEpidemic Parameters Nonadaptive Adaptive (10,000 Monte Carlo Runs) Sample Size (H = 0) Sample Size (H = 1) %α Power % R0 µ I0 Sampl e Size %α Power % Mean (SD) Media n (IQR) Mean (SD) Media n (IQR) (1) 2 COVID -19 0.1% 221 8.9 90 130 (98) 103 (62, 167) 136 (100) 109 (66, 176) 7.5 91.9 (2) 4 COVID -19 0.1% 129 23.4 90 105 (78) 84 (51, 135) 80 (70) 58 (33, 105) 19.2 92.2 (3) R0(t) COVID -19 0.1% 151 18.7 90 114 (83) 92 (56, 149) 94 (78) 69 (40, 123) 15.4 92.4
Note. RCT = randomized clinical trial; denotes the basic reproduction number, µ the disease morality, and the proportion of initial infected subjects. Sample size refers to the number of subjects enrolled in each arm of the RCT. IQR denotes the interquartile range about the median. (t) denotes the dynamic transmission model with weeks,
(4) 2 COVID -19 0.01% 377 1.6 90 148 (126) 110 (64, 187) 236 (150) 200 (130, 300) 1.2 90.8 (5) 4 COVID -19 0.01% 247 6.7 90 135 (105) 103 (63, 175) 150 (106) 121 (75, 196) 5.4 91.3 (6) R0(t) COVID -19 0.01% 281 4.6 90 139 (109) 107 (62, 181) 170 (116) 139 (88, 220) 3.7 91.4 (7) 2 SARS 0.1% 201 11.0 90 127 (94) 100 (61, 165) 122 (91) 96 (58, 159) 9.9 91.9 (8) 4 SARS 0.1% 120 25.6 90 101 (74) 81 (49, 131) 76 (68) 55 (30, 100) 20.9 93.4 (9) R0(t) SARS 0.1% 134 22.2 90 106 (76) 86 (52, 139) 83 (72) 60 (33, 108) 18.3 92.5 (10) 2 MERS 0.1% 166 16.0 90 116 (84) 92 (56, 152) 102 (84) 77 (45, 132) 13.5 92.2 (11) 4 MERS 0.1% 103 30.4 90 93 (70) 75 (44, 122) 67 (63) 46 (24, 88) 25.7 93.5 (12) R0(t) MERS 0.1% 105 29.8 90 96 (71) 77 (45, 125) 68 (62) 48 (25, 91) 25.4 93.3 (1) (2) (3) (4) (5) (6) (7) (8) (9) (10) (11) (12)
R
0I
0R
0t
=
3
Table A5. Summary Statistics of Optimal Type I Error Rate (top) and Sample Size (bottom)
Min 10% 25% 50% 75% 90% Max Baseline 0.1% 1.0% 2.7% 7.1% 19.9% 40.8% 85.3% 7.1% Min 10% 25% 50% 75% 90% Max Baseline 7 112 153 220 329 486 1,257 242
Figure A1. Scatterplot of optimal Type I error rate ( ) vs. sample size for different values of , the time needed to assess the treatment efficacy (week).
Figure A2. Scatterplot of optimal Type I error rate ( ) vs. sample size for different values of , the incubation period (week) of the disease.
This article is © 2020 by Shomesh Chaudhuri, Andrew W. Lo, Danying Xiao, and Qingyang Xu. The article is licensed under a Creative Commons Attribution (CC BY 4.0) International license
(https://creativecommons.org/licenses/by/4.0/legalcode), except where otherwise indicated with respect to
particular material included in the article. The article should be attributed to the author identified above.
Footnotes
Figure A3. Optimal Type I Error vs. for Absolute Risk of Being Susceptible. Optimal Type I error rate of nonadaptive
Bayesian randomized clinical trial monotonically increases with the basic reproduction number (assuming ,
and disease mortality of COVID-19) if we define the loss of making a Type I error as the absolute risk of being susceptible, . This alternative definition is not very realistic. For an epidemic with , the loss of Type I error converges to a large positive value as time approaches the end of the epidemic outbreak. However, at the end of the outbreak, there are no
more infected patients and thus no susceptible subjects. Therefore, the loss of Type I error should approach zero as . This is the case for the excess risk of susceptibility, , but not for the absolute risk of susceptibility,
R0 α R0 I = 0.1%0 L = 100D S t NL( ) S R < 20 S T NL( ) S t→T (S t −S(T))NL( ) S S t NL .( ) S
. Table scrolls horizontally for additional columns ↩
. https://projectalpha.mit.edu↩
. As reported at https://projectalpha.mit.edu for 2019Q4 ↩