Publisher’s version / Version de l'éditeur:
Vous avez des questions? Nous pouvons vous aider. Pour communiquer directement avec un auteur, consultez la première page de la revue dans laquelle son article a été publié afin de trouver ses coordonnées. Si vous n’arrivez Questions? Contact the NRC Publications Archive team at
[email protected]. If you wish to email the authors directly, please see the first page of the publication for their contact information.
https://publications-cnrc.canada.ca/fra/droits
L’accès à ce site Web et l’utilisation de son contenu sont assujettis aux conditions présentées dans le site LISEZ CES CONDITIONS ATTENTIVEMENT AVANT D’UTILISER CE SITE WEB.
4th NRC Symposium on Computational Fluid Dynamics, High Performance
Computing and Virtual Reality [Proceedings], pp. 1-11, 2005-12-06
READ THESE TERMS AND CONDITIONS CAREFULLY BEFORE USING THIS WEBSITE.
https://nrc-publications.canada.ca/eng/copyright
NRC Publications Archive Record / Notice des Archives des publications du CNRC :
https://nrc-publications.canada.ca/eng/view/object/?id=04aae324-aab4-4da2-ac7a-73a778ed0559 https://publications-cnrc.canada.ca/fra/voir/objet/?id=04aae324-aab4-4da2-ac7a-73a778ed0559
NRC Publications Archive
Archives des publications du CNRC
This publication could be one of several versions: author’s original, accepted manuscript or the publisher’s version. / La version de cette publication peut être l’une des suivantes : la version prépublication de l’auteur, la version acceptée du manuscrit ou la version de l’éditeur.
Access and use of this website and the material on it are subject to the Terms and Conditions set forth at
CFD investigation of balcony spill plumes in atria
http://irc.nrc-cnrc.gc.ca
C F D i n v e s t i g a t i o n o f b a l c o n y s p i l l p l u m e s i n
a t r i a
N R C C - 4 8 3 6 7
M c C a r t n e y , C . J . ; L o u g h e e d , G . D . ; W e c k m a n ,
E . J .
A version of this document is published in / Une version de ce document se trouve dans: 4th NRC Symposium on Computational Fluid Dynamics, High Performance Computing and Virtual Reality, Ottawa, Ontario, Dec. 6, 2005, pp. 1-11
The material in this document is covered by the provisions of the Copyright Act, by Canadian laws, policies, regulations and international agreements. Such provisions serve to identify the information source and, in specific instances, to prohibit reproduction of materials without written permission. For more information visit http://laws.justice.gc.ca/en/showtdm/cs/C-42
Les renseignements dans ce document sont protégés par la Loi sur le droit d'auteur, par les lois, les politiques et les règlements du Canada et des accords internationaux. Ces dispositions permettent d'identifier la source de l'information et, dans certains cas, d'interdire la copie de documents sans permission écrite. Pour obtenir de plus amples renseignements : http://lois.justice.gc.ca/fr/showtdm/cs/C-42
CFD Investigation of Balcony Spill Plumes in Atria
C. J. McCartney1, G. D. Lougheed1 and E. J. Weckman21
Institute for Research in Construction, National Research Council Canada, Ottawa, ON, K1A 0R6, Canada 2
Department of Mechanical Engineering, University of Waterloo, Waterloo, ON, N2L 3G1, Canada 1
E-mail: [email protected]
Abstract
This paper demonstrates an integrated method for using experimental data and CFD modeling to develop engi-neering correlations for atrium smoke management. Smoke management in buildings during fire events of-ten uses mechanical ventilation systems to maintain smoke layer elevation above a safe evacuation path. Design of these systems requires accurate correlations for the mass flow rates of the buoyant fire plumes. One design issue is fire plumes that flow out of a fire com-partment, under a balcony and up through an atrium or other large volume. Current engineering correlations for these balcony spill plumes are based on a combina-tion of one-tenth scale experimental data and theoretical analysis. The suitability of these correlations for full-scale designs has been questioned. A combined pro-gram of full-scale experimentation and CFD modeling has been conducted to analyze the accuracy of these correlations.
A full-scale experimental facility was constructed with a 5 m by 5 m by 15 m fire compartment connected to a four-storey atrium. Propane fires in the compartment produced balcony spill plumes which formed steady-state smoke layers in the atrium. Experimental vari-ables included fire size, compartment opening width, compartment fascia depth and draft curtain depth. A variable exhaust system was used to achieve various atrium smoke layer elevations for each of 100 com-partment configurations. Temperatures were measured in the compartment, atrium and exhaust system. The experimental data was used to calculate the atrium smoke layer elevation and balcony spill plume mass flow rate for each compartment configuration and fire size.
A CFD model of the experimental facility was imple-mented using the Fire Dynamics Simulator software (Version 3). Large-eddy simulations were performed with a constant radiative fraction and an infinitely fast mixture fraction combustion model. Data from these simulations was compared to the experimental data
with limited agreement. The CFD model was then ex-tended to a 50 m high atrium to overcome limitations in the CFD software and the experimental data. Grid sizes on the order of 10-1 m were evaluated in a grid sensitiv-ity analysis with balcony spill plume mass flow rate as the comparison variable. A parametric study focusing on the variation of plume mass flow rate with elevation was conducted using the same variables as the experi-mental program.
Results from the experimental program and parametric study are being compared to existing engineering corre-lations and zone model predictions. A new proposed correlation for the variation in balcony spill plume mass flow rate with elevation has been developed. The ex-perimental program also provides a unique data set for validation of full-scale balcony spill plume models.
Key words: atrium smoke management, balcony spill plumes, Fire Dynamics Simulator.
1 Introduction
Over the past decade, NRC’s Fire Research program (FR) has conducted a number of joint research projects with the American Society of Heating, Refrigeration and Air Conditioning Engineers (ASHRAE) addressing smoke management systems in atria [1, 2, 3]. This re-search has concentrated on developing effective fire safety engineering tools to allow designers to balance the economic and life safety costs of these systems. This paper describes a current joint research project investigating balcony spill plumes in atria.
Until recently, atrium smoke management systems were designed assuming that the fire would occur on the atrium floor. It was further assumed that sprinklers would limit the size and thus the smoke produced by fires in any compartments attached to the atrium. How-ever, some North American model codes now call for consideration of smoke exiting from these attached compartments as balcony spill plumes.
2 Balcony Spill Plumes
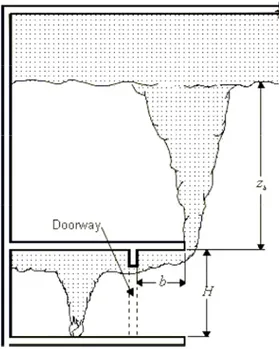
Atria with attached compartments are commonly found in office buildings and shopping malls. For a fire in an attached compartment that opens onto a balcony, smoke can flow out of the compartment, under the balcony and up through the atrium as a balcony spill plume, or BSP (Figure 1). As this buoyant line plume rises through the atrium, entrained air increases the mass flow rate of the plume. In order to design the atrium smoke manage-ment system to maintain a safe evacuation path, accu-rate calculation of the BSP mass flow accu-rate is required.
Figure 1. Balcony spill plume schematic.
Existing BSP correlations are primarily based on data from one-tenth scale physical models of shopping mall atria [1, 2]. Data from these experiments were used to develop a number of different correlations for BSP mass flow rates [3, 4]. These correlations express BSP mass flow rate as a function of elevation, fire size and fire compartment dimensions. The correlation used in North American system design guides ([5, 6]) was de-veloped by Law [3] as a simple correlation for use by designers:
m = Csp(QcW2)1/3(zb + 0.25H) (1)
where m is the BSP mass flow rate (kg/s) at elevation zb (m), Csp is a scaling factor of 0.36 (-), Qc is the fire’s convective heat release rate (kW), W is the plume width at the balcony edge normal to the plane of Figure 1 (m), zb is the atrium smoke layer elevation above the
bal-cony (m) and H is the balbal-cony elevation above the top of the fire source (m).
There is considerable controversy over the accuracy of the existing BSP correlations. The various correlations predict significantly different BSP mass flow rates, especially for atria with high elevations. The existing correlations, developed from scale models of low eleva-tion atria (< 4 storeys), may not be accurate when ap-plied to full-scale atria with higher elevations. Atrium smoke management systems designed using inaccurate BSP mass flow rates may result in either reduced life safety or unnecessary economic costs. Recent research on BSPs [7, 8] has not reduced the controversy.
3 Experimental Program
Data from full-scale experiments is needed to evaluate the accuracy of the existing BSP mass flow rate correla-tions and, if required, to develop new correlacorrela-tions. Since full-scale data characterizing BSPs in atria is lim-ited, NRC and ASHRAE have conducted a joint re-search project to obtain full-scale data and analyze the accuracy of the existing BSP correlations.
In recent years, NRC has conducted major research projects related to atrium smoke management [9, 10, 11, 12] in a full-scale atrium with overall dimensions of 12.2 m by 18.3 m by 12.5 m. This facility includes a smoke exhaust system located at the atrium ceiling with a variable capacity up to 25 m3/s.
3.1 Experimental Objectives
The main objective of the experimental program was to measure BSP mass flow rates produced by fires in a compartment attached to an atrium. Elements of the fire compartment geometry (i.e. opening width, fascia depth and draft curtain depth) were varied. The exhaust system flow rate was adjusted to achieve various atrium smoke layer depths for each geometry and fire size combination. BSP mass flow rates were measured for each unique combination of geometry and fire size. A literature review was conducted to assure that all current information on BSP was available. This infor-mation was used to design the experimental facility. Existing BSP correlations were reviewed to ensure that their primary parameters were included in the experi-mental program.
The steady-state atrium smoke layer elevation was the major dependent variable to be measured during the experiments. A mass balance occurs at this elevation between the BSP mass flow rate and the exhaust mass flow rate from the top of the smoke layer. The BSP
mass flow rate at this elevation can therefore be in-ferred from the more easily measured exhaust system mass flow rate. The atrium smoke layer elevation was calculated from the atrium thermocouple tree measure-ments.
The smoke production rates measured in the full-scale tests will be compared with estimates from existing BSP smoke rate correlations. These comparisons will be used to determine if the existing approaches accu-rately predict BSP smoke production rates or if alterna-tive correlations are required. If so, the experimental data will be analyzed to determine a suitable new corre-lation.
3.2 Experimental Facility
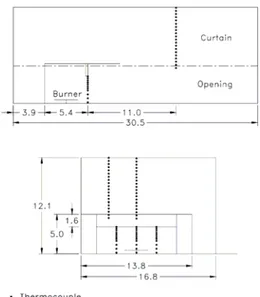
Figure 2 below shows the experimental facility. A 5 m by 5 m by 12 m compartment was installed at one end of the existing 12.2 m by 18.3 m by 12.5 m atrium. The front wall of the test compartment was modular in con-struction with opening widths ranging from 5 to 12 m and a removable 1.6 m fascia at the top of the opening. Removable draft curtains were also installed under the balcony at the edges of the compartment opening. The dimensions of the test compartment, balcony and fascia were consistent with previous one-tenth scale experi-ments [1, 2] and represented typical values found in North American atria. The selected balcony height provides a conservative result for the effect of the bal-cony height. The volume of the fire compartment was kept constant since it was not a parameter considered in the existing correlations. The nature of buoyant plume flow required that these experiments be conducted in-doors to minimize wind effects.
Figure 2. Experimental facility.
The fire source was located at the center of the fire compartment. A propane burner system was used to achieve steady, known heat release rates over extended periods of time. The propane flow rate was measured using rotameters to estimate the total heat release rate. A design fire size of 500 to 1 000 kW has been sug-gested for the majority of fire situations in sprinklered office buildings [9, 13]. Similarly, a design fire size of 2 500 kW covers most fire situations in retail malls [12]. Atrium smoke management system design guides ([5, 6]) suggest a design fire of 5000 kW for sprinklered retail applications. Based on this input, the experimen-tal program included fire sizes in the range from 500 to 5 000 kW. The fire compartment was lined with non-combustible mineral fibre insulation with low thermal conductivity to protect against repeated fire exposure and minimize conductive heat losses through the com-partment boundaries.
A mechanical smoke exhaust system was located at the atrium ceiling with a variable capacity of 0 to 25 m3/s. The mechanical exhaust system consisted of 16 vents with a combined area of 2.63 m2 and was instrumented to measure the exhaust air mass flow rate. Approxi-mately 100 tests were performed with various combina-tions of compartment geometry and fire size. Each test was conducted at five different exhaust flow rates in the range of 5 to 25 m3/s in order to achieve multiple steady-state atrium smoke layer elevations. The ex-haust flow rate was varied every 500 s since prelimi-nary tests showed that the atrium smoke layer reached a steady-state elevation within this time.
Since propane fires produce little visible smoke, accu-rate temperature measurements were required to deter-mine the depth of the atrium smoke layer. Temperature measurements were made in the atrium, in the test compartment and at the compartment opening.
4 CFD Modeling Study
This research project included a CFD modeling study performed in parallel with the experimental program. The objective of the CFD modeling study was to sup-plement the experimental data for evaluating BSP mass flow rate correlations. A validated CFD model will allow BSPs in atria with higher elevations and com-partments with different geometries to be simulated. As a more general objective, the CFD modeling study also provided information on the integrated use of CFD modeling and experimental data for the design and evaluation of atrium smoke management systems.
4.1 Fire Dynamics Modeling Issues
Accurate modeling of flows produced by combustion processes is a complex and difficult task due to their highly turbulent nature and the wide range of timescales for the underlying physical processes. Phase changes of solids to combustible gases must be accounted for and heat transfer processes, especially radiation, have a greater relative effect on the flow field solution than for most low-temperature flows. Most of the major proc-esses are transient. The need to resolve small temporal variations makes Large-Eddy Simulation (LES) a more suitable model than Reynolds Averaged Navier-Stokes (RANS).
Because of the variety of processes involved, fire mod-eling possesses an inherent trade-off between small- and large-scale resolution. Current workstations can perform simulations in a reasonable amount of time if the number of cells is in the 106 range. Converting to a linear scale, this yields a dynamic range (i.e. ratio of largest to smallest eddy length scales) on the order of approximately 102. For combustion processes occur-ring at length scales less than 1 mm and building ge-ometries on the order of 102 m, the dynamic range re-quired for accurate modeling of all relevant fire proc-esses is approximately 105. Since most simulations will lack the computational resources to achieve this dy-namic range, their accuracies may be limited. This limitation should be kept in mind when designing or interpreting fire dynamics simulations.
The accuracy of LES fire dynamics simulations de-pends primarily on the grid resolution, especially near the fire. If the fire source is inadequately resolved, the mixture fraction combustion model suffers inaccuracies in predicted heat release rates due to numerical diffu-sion. A measure of grid resolution of the fire source can be derived from the characteristic fire diameter, D*, defined as:
D* = (Q/ρ0 cpT0g1/2)2/5 (2)
where Q is the fire’s total heat release rate (kW), ρ0 is the ambient air density (kg/m3), cp is the heat capacity of air (kJ/K-kg), T0 is the ambient air temperature (K), and g is the acceleration due to gravity (m/s2). Assum-ing standard atmospheric conditions, Equation 2 simpli-fies to the following expression:
D* = 0.0606 Q2/5 (3)
The non-dimensional quantity D*/dx, where dx is the nominal grid cell size (m), can be used as a independent measure of fire resolution. Research at NRC into this
issue has shown that adequate accuracy for modeling of building fires can be achieved with a grid resolution which yields D*/dx > 14 [14].
4.2 Fire Dynamics Simulator (FDS)
The selection of appropriate CFD software is key to achieving accurate results for fire dynamics simula-tions. The software chosen for the CFD modeling study of BSPs is Fire Dynamics Simulator (Version 3), avail-able from the National Institute of Standards and Tech-nology [15]. FDS is specifically designed to model fluid flows from combustion processes and includes mechanisms for modeling combustion stoichiometry, smoke production and transport, and fuel pyrolysis. FDS is gaining popularity in both the research and en-gineering design communities due to its simplicity and open source nature.
FDS utilizes an explicit predictor-corrector scheme that has second order temporal and spatial accuracy. Spatial derivatives are approximated by second order central differences. Turbulence is modeled using a Smagorin-sky form LES model. Direct Numerical Simulation (DNS) calculations are also possible if a fine numerical grid is specified. Low Mach number combustion equa-tions [16] optimized for low-speed, buoyancy-driven flows are used to reduce computational requirements. FDS approximates the governing equations on a recti-linear grid. Non-rectirecti-linear objects can be modeled as equivalent combinations of rectilinear objects since FDS allows vorticity generation at the corners to be ignored. Multi-blocking allows the use of more than one rectangular mesh in a simulation for grid refine-ment. Grid transformations are limited to two direc-tions in any single mesh. Two-dimensional meshes and radial co-ordinate systems may also be specified. Standard boundary conditions are available including open vents, symmetry planes and thin and thick wall conduction. Solid surfaces are assigned thermal bound-ary conditions and information about the burning be-havior of the material (e.g. ignition temperature, heat release rate, density). Tabulated material property data are typically used to define these parameters. For LES simulations, heat and mass transfer to and from solid surfaces are calculated using empirical correlations. FDS uses a mixture fraction combustion model where mixture fraction is defined as the fraction of gaseous fuel at a given point in the flow field. This conserved scalar quantity determines where combustion may oc-cur in the flow domain. The mixture fraction model also accounts for conditions that may prevent
combus-tion including oxygen deplecombus-tion or temperature deficits. Mass fractions of the major reactants and products are related to the mixture fraction via state relations which are in turn derived from a combination of simplified analysis and experimental data. Mixing-controlled combustion and infinitely fast fuel oxidation are both assumed. The mixture fraction model treats fires as sources of combustion reactant(s) from which heat re-lease is calculated. This is in contrast with other CFD software that models fires as sources of heat and com-bustion products.
Radiative heat transfer is modeled by solving the radia-tion transport equaradia-tion for a non-scattering gray gas. A wide band radiation model is also available. The radia-tion equaradia-tion is solved using a finite volume method similar to that used for convective transport. Approxi-mately 100 discrete angles are used, requiring about 15 % of the total computational time for a simulation. FDS uses a constant radiative fraction for fuels. This is one of the major approximations in the radiation model since actual radiative fractions vary with flame tem-perature and combustion product concentrations. The Smokeview program distributed with FDS displays model results graphically and allows some basic pa-rameter editing of FDS input files. FDS offers many standard CFD visualizations including the Plot3D data format [17].
4.3 Fire Compartment Model
A limited number of fire compartment simulations were performed to aid in preliminary grid design. The FDS compartment model is shown in Figure 3. Accurate prediction of compartment temperatures and airflows was considered a first step to accurate modeling of the BSP and atrium hot layer. All surfaces were specified as inert and the compartment opening was specified as an open boundary condition. The fire was modeled as a steady release of propane. A variety of grid designs covering were evaluated. Simulation times of 120 s were chosen to achieve steady-state conditions. All simulations presented in this paper were performed on a Pentium IV workstation with a 2.5 GHz processor and 1.0 GB of RAM running Windows 2000.
Figure 3. Geometry of fire compartment model.
Table 1 lists grid design details for four different fire compartment models. In models C1 and C2, isometric grids were applied across the entire fire compartment including the burner. In models C3 and C6, gird trans-formation was used to apply higher grid resolution over the burner volume to achieve higher accuracy in this critical flow region.
Model Burner grid size (m) Compartment grid size (m) C1 0.1 0.1 C2 0.1 0.1 C3 0.1 0.2 C6 0.05 0.1 Table 1. Fire compartment model grid design details.
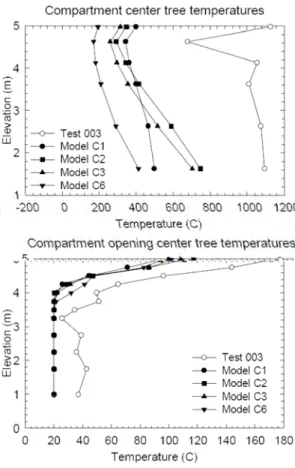
Figure 4 compares compartment temperature profiles for models C1 through C3 and C6 with experiment BSP-003. In experiment BSP-003, Q = 2.0 MW, W = 12 m and no fascia or draft curtains were present. For the 2.0 MW fire size modeled here, the corresponding value of D*/dx is 12.7, indicating that slightly inaccu-rate results should be expected. Greater accuracies were limited by the available computational resources.
Figure 4. Fire compartment temperature profiles. The CFD model underpredicted the flame and plume temperatures above the burner, resulting in low hot layer temperatures compared to the experimental data. The main parameter affecting the accuracy of the flame temperature prediction was control volume size. Due to limited computational resources, it was not possible to use small enough control volume sizes to accurately model the fire dynamics in the compartment. Control volume size limitations may or may not affect the pre-diction of the bulk BSP flow outside of the compart-ment.
4.4 Experimental Facility Model
A CFD model of the experimental facility was devel-oped to allow validation against the experimental data. The geometry of the experimental facility model is shown in Figure 5. All solid surfaces were modeled as inert since no combustible surfaces were present in the experimental facility and conductive losses were as-sumed to be minimal. Two open vents were specified in the north wall of the facility to model the curtain opening. The exhaust system was modeled as a 2.0 m by 14.8 m opening centered on the fire compartment opening with a specified volumetric flow rate of
20 m3/s. Three isometric computational meshes were defined in order to achieve full coverage of the flow domain with a reasonable number of control volumes: one mesh centered on the fire, a second covering the fire compartment, and a third covering the atrium. Simulation times of 120 s were chosen to achieve steady-state conditions.
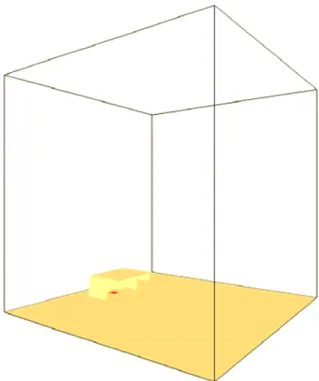
Figure 5. Geometry of experimental facility model. The objective of the CFD model of the experimental facility was to validate its ability to accurately predict the atrium smoke layer elevation and temperature. Fig-ure 6 shows the BSP temperatFig-ure distribution for model 39 with Q = 1.0 MW, W = 12 m and no fascia or draft curtains present. Results from model 39 showed that the BSP projected well into the atrium, which agreed qualitatively with visualizations obtained from smoke bomb tests in the facility. However, atrium smoke layer temperatures are underpredicted compared to ex-perimental data. The atrium smoke layer elevation was also poorly predicted.
Temperature and velocity profiles near the mesh inter-faces exhibited large local gradients which were physi-cally incorrect. This behaviour may be due to incorrect application of the multiple mesh feature of FDS or nu-merical errors inherent in the software. These errors are proposed as the cause of the inaccurate predictions of atrium smoke layer elevation and temperature. The use of multiple meshes in FDS to accurately model buoyant plume flow cannot be evaluated using this data. The CFD model of the experimental facility could not be validated using data from the experimental program. Analysis in progress at FR indicates that the experimen-tal data compares well with correlations for fire com-partment smoke layer elevation and temperature.
5 High-Elevation Atrium CFD Model
Preliminary experimental results indicated that the ex-haust system capacity was not large enough to maintain the atrium smoke layer elevation more than 2 m above the balcony. BSP mass flow rate data over a larger range of elevations was required for proper evaluation of the BSP correlations.
5.1 Model Description
A CFD model of a high-elevation atrium was developed to obtain BSP mass flow rate data over a larger range of elevations. Figures 7 and 8 below show the geometry of the atrium CFD model. A 12 m wide by 5 m deep by 5 m high fire compartment similar to the experimental facility was located at floor level in a 50 m cubic atrium. The fire compartment opening was varied be-tween 5 and 12 m. A 5 m wide balcony projected from the fire compartment. Variable height draft curtains were located at the edges of the fire compartment open-ing and ran the full depth of the balcony. A removable 1.6 m fascia was located at the fire compartment open-ing.
All surfaces were specified as inert and all flow domain boundaries except for the floor were specified as open boundary conditions. The fire was modeled as a steady release of propane throughout the simulation. One iso-metric computational mesh was defined over the entire flow domain. Simulation times of 300 s were chosen to achieve steady-state conditions. The fuel was specified as propane and a constant radiative fraction of 0.35 was used.
Figure 7. High-elevation atrium model geometry.
Figure 8. Fire compartment geometry.
5.2 Grid Sensitivity Analysis
A grid sensitivity analysis was performed on the high-elevation atrium model with two objectives: to deter-mine the most efficient grid size and to deterdeter-mine the atrium width and depth required to fully contain the BSP. The former ensures accuracy with minimal com-putational requirements and the latter prevents BSP mass loss from the flow domain sides from affecting the vertical BSP mass flow rate profiles.
A fire size of 2 000 kW and an opening width of 10 m were chosen as being in the middle of their respective ranges. The draft curtain and fascia depths were pre-sumed not to affect the bulk plume flow as significantly as the other two parameters and were therefore ignored in the grid sensitivity analysis. The atrium height was reduced to 25 m to allow timely solution of the simula-tions with the smaller grid sizes. BSP mass flow rates
were calculated across horizontal sections of the flow domain over its entire height.
The accuracy of LES fire dynamics simulations de-pends primarily on the grid resolution around the fire and across plume boundaries. In particular, previous work by the author shows that accurate modeling of plume dynamics in atria requires grid sizes in the range of 0.1 to 1.0 m [18]. Various grid sizes in this range were used in the grid sensitivity analysis. Figure 9 shows the BSP mass flow rate vs. elevation profiles for various grid sizes. Since the results for grid sizes of 0.25 and 0.5 m were very similar, an optimal grid size of 0.5 m was chosen as the optimal grid size.
Figure 9. Mass flow rate profile variation with grid size. To choose the atrium width and depth, various simula-tions were performed of a 2 000 kW fire and a 10 m compartment opening using the optimal grid size of 0.5 m. The velocity field at the flow domain boundaries was examined to estimate the amount of mass escaping from the flow domain sides. An arbitrary criterion of flow speed < 0.5 m/s was chosen to represent minimal mass loss. Based on this criterion, a minimum atrium size of 50 m by 50 m was required to fully contain the plume. This atrium size was maintained for all subse-quent simulations.
The grid sensitivity analysis yielded a 50 m by 50 m by 50 m atrium with a grid size of 0.5 m for a total of 106 control volumes. These simulations took an average of 12.11 h to solve a simulation time of 300 s for an aver-age efficiency ratio of 1:145.
5.3 Parametric Study
The objective of the CFD modeling study was to obtain BSP mass flow rate data for various fire compartment geometries and fire sizes. A parametric study was con-ducted using the same parameters as the experimental program: fire size, compartment opening width, draft curtain depth and fascia depth. Parameter values were chosen to span the range of values typically found in North American commercial and retail applications. Table 2 lists the parameter values used in the paramet-ric study.
Table 2. Parametric study parameter values.
Each simulation in the parametric study produced a vertical BSP mass flow rate profile. Figure 10 below shows the BSP mass flow rate profiles for selected simulations. The profiles vary linearly with elevation, a characteristic of buoyant line plumes which is sup-ported by both fundamental dimensional analyses and experimental work [19]. This supports the conclusion that the modeling results represented here accurately model plume dynamics.
Figure 10. Mass flow rate profile variation with fire size.
The mass flow rate trends in Figure 10 are nonlinear near the top of the flow domain. These nonlinearities were found in all simulations and were greater for lar-ger grid sizes. This nonlinear behaviour is attributed to the propagation of the open boundary condition at the top of the atrium into the flow domain. The zero pres-sure requirement at the boundary forces the flow within the domain to change. In reality, a small pressure dif-ference due to buoyancy would be present at the top of the atrium. This is considered a modeling error that does not affect the flow dynamics in the rest of the flow domain. Note that these nonlinearities were not due to BSP mass escaping from the flow domain since veloci-ties at the flow domain boundaries under 0.5 m/s were verified for each simulation.
Each mass flow rate profile from the parametric study was fitted using linear regression to curves of the form:
m = k z + m0 (4)
where m is the BSP mass flow rate (kg/s), k is a propor-tionality constant (kg/s-m), z is the elevation above the balcony edge (m) and m0 is an offset term representing the plume mass flow rate already present at the balcony edge (kg/s). Steady state data was obtained by averag-ing the mass flow rate data over the period t = 120 to 300 s. Non-linear data at the top of the flow domain was removed by considering only data between z = 15 and 35 m. These subsets yielded linear regressions with minimum R2 values of 0.999. Table 3 lists the linear regression parameters for selected simulations from the parametric study.
Equivalent linear regression parameters for Law’s equa-tion (1) can be defined as:
k’ = Csp(QcW2)1/3 ; m0’ = (0.25H)Csp(QcW2)1/3 (5) with variables defined above. Table 2 also lists the linear regression parameters for Law’s equation. The proportionality constants from the CFD simula-tions, k, are consistently smaller than those from Law’s equation, k’. Specifically, the average ratio of k/k’ is 0.58. This indicates that Law’s equation overpredicts
BSP mass flow rates at any elevation. This agrees with anecdotal evidence that Law’s equation is conservative. Based on the parametric study data, the following new correlation for BSP mass flow rate is proposed:
m = 0.52 Q1/3W1/5 z + m0 (6)
Detailed analysis of the offset term, m0, is not possible in this CFD modeling study due to poor resolution of the flow under the balcony. However, at high eleva-tions the first term in (6) is much greater than the offset term.
Comparing the new correlation (6) to Law’s equation (1), the power of the fire size term, Q, is the same but the power of the compartment opening width term, W, is reduced substantially. This reduction is attributed to the fact that a BSP tends to degenerate into an axisym-metric plume as it rises through an atrium rather than maintaining its finite line plume shape as assumed by the existing BSP correlations. Axisymmetric plumes have a very low reliance on the fire geometry, which in the case of a BSP is represented by the plume width at the compartment opening, W.
6 Conclusions
Comparison of BSP mass flow rates predicted by CFD simulations with those from existing correlations indi-cated that the latter are conservative. A new correlation based on the CFD simulation is proposed. Results from this research project will provide input to North Ameri-can design guides for atrium smoke management sys-tems.
This work demonstrates the integrated use of both ex-perimental data and CFD modeling to develop engi-neering correlations for atrium smoke management. In particular, the abilities and limitation of CFD for mod-eling of BSPs in atrium have been demonstrated.
Acknowledgements
The authors wish to acknowledge the staff at NRC’s National Fire Laboratory for their efforts in the design and construction of the experimental facility.
Table 3. Linear regression parameters for parametric study simulations and Law’s equation.
References
[1] H. P. Morgan, N. R. Marshall, Smoke control meas-ures in a covered two-story shopping mall having bal-conies as pedestrian walkways, BRE CP11/79, Building Research Establishment, Borehamwood, UK, 1979. [2] H. P. Morgan, N. R. Marshall, Smoke hazards in covered, multi-level shopping malls; an experimentally based theory for smoke production, BRE CP48/75, Building Research Establishment, Borehamwood, UK, 1975.
[3] M. Law, A note on smoke plumes from fires in multi-level shopping Malls, Fire Safety Journal, Vol-ume 10, p. 197-202, 1986.
[4] P. H. Thomas, On the upward movement of smoke and related shopping mall problems, Fire Safety Jour-nal, Volume 12, p. 191-203, 1987.
[5] CIBSE, Relationships for smoke control calcula-tions, Technical Memoranda TM19:1995, Chartered Institute of Building Services Engineers, London, 1995. [6] NFPA, Guide for smoke management systems in malls, atria, and large areas, NFPA 92B, National Fire Protection Association, Quincy, MA, 2000.
[7] M. Poreh, H. P. Morgan, N. R. Marshall, R. Harri-son, Entrainment by two-dimensional spill plumes, Fire Safety Journal, Volume 30, No. 1, p. 1-19, 1998. [8] P. H. Thomas, H. P. Morgan, N. Marshall, The spill plume in smoke control design, Fire Safety Journal, Volume 30, p. 21-46, 1998.
[9] G. D. Lougheed, Expected size of shielded fires in sprinklered office buildings, ASHRAE Transactions, 103, (1), p. 395-410, 1997.
[10] G. D. Lougheed, G. V. Hadjisophocleous, C. McCartney, B. C. Taber, Large-scale physical model studies for an atrium smoke exhaust system, ASHRAE Transactions, 105, (1), p. 676- 698, 1999.
[11] G. D. Lougheed, C. McCartney, B. C. Taber, Smoke movement for sprinklered fires, ASHRAE Transactions, 106, (Pt. 1), p. 605-619, 2000.
[12] G. D. Lougheed, C. McCartney, B. C. Taber, Sprinklered mercantile fires, ASHRAE Transactions, 107, (1), p. 730-743, 2001.
[13] D. Madrzykowski, R. Vettori, A sprinkler fire sup-pression Algorithm. J. of Fire Prot. Engr. 4: 151-164, 1992.
[14] A. Bounagui, N. Benichou, C. McCartney, A. Ka-shef, Optimizing the grid size used in CFD simulations to evaluate fire safety in houses, NRC 2nd Symposium on Computational Fluid Dynamics, Ottawa, Ontario, 2003.
[14] ASTM, E 2067-03 Standard practice for fullscale oxygen consumption calorimetry Fire Tests, American Society of Testing and Materials, West Conshohocken, PA, 2003.
[15] K. B. McGratten, et. al., Fire Dynamics Simulator (Version 3) – User’s Guide, National Institute of Stan-dards and Technology, 2002.
[16] R. G. Rehm, H. R. Baum, The equations of motion for thermally driven, buoyant Flows, Journal of Re-search of the NBS, 83:297–308, 1978.
[17] P. P. Walatka, P. G. Buning., PLOT3D User’s Manual (Version 3.5) - NASA Technical Memorandum 101067, NASA, 1989.
[18] G. V. Hadjisophocleous, C. J. McCartney, Guide-lines for the use of CFD simulations for fire and smoke modeling, ASHRAE Transactions, 2005 (in press). [19] G. Heskestad, Fire plumes, flame height, and air entrainment, The SPFE Handbook of Fire Protection Engineering (3rd ed.), p. 2-1 – 2-17, 2002.