Publisher’s version / Version de l'éditeur:
The journal of physical chemistry. C, Nanomaterials and interfaces, 113, 18, pp.
7579-7593, 2009-04-10
READ THESE TERMS AND CONDITIONS CAREFULLY BEFORE USING THIS WEBSITE.
https://nrc-publications.canada.ca/eng/copyright
Vous avez des questions? Nous pouvons vous aider. Pour communiquer directement avec un auteur, consultez la première page de la revue dans laquelle son article a été publié afin de trouver ses coordonnées. Si vous n’arrivez pas à les repérer, communiquez avec nous à PublicationsArchive-ArchivesPublications@nrc-cnrc.gc.ca.
Questions? Contact the NRC Publications Archive team at
PublicationsArchive-ArchivesPublications@nrc-cnrc.gc.ca. If you wish to email the authors directly, please see the first page of the publication for their contact information.
NRC Publications Archive
Archives des publications du CNRC
This publication could be one of several versions: author’s original, accepted manuscript or the publisher’s version. / La version de cette publication peut être l’une des suivantes : la version prépublication de l’auteur, la version acceptée du manuscrit ou la version de l’éditeur.
For the publisher’s version, please access the DOI link below./ Pour consulter la version de l’éditeur, utilisez le lien DOI ci-dessous.
https://doi.org/10.1021/jp900252e
Access and use of this website and the material on it are subject to the Terms and Conditions set forth at
Photoluminescent colloidal CdS nanocrystals with high quality via
noninjection one-pot synthesis in 1-Octadecene
Ouyang, Jianying; Kuijper, Jasmijn; Brot, Simon; Kingston, David; Wu,
Xiaohua; Leek, Donald M.; Hu, Michael Z.; Ripmeester, John A.; Yu, Kui
https://publications-cnrc.canada.ca/fra/droits
L’accès à ce site Web et l’utilisation de son contenu sont assujettis aux conditions présentées dans le site LISEZ CES CONDITIONS ATTENTIVEMENT AVANT D’UTILISER CE SITE WEB.
NRC Publications Record / Notice d'Archives des publications de CNRC:
https://nrc-publications.canada.ca/eng/view/object/?id=1505a4e6-bf5b-4705-b745-ec4becc4709f https://publications-cnrc.canada.ca/fra/voir/objet/?id=1505a4e6-bf5b-4705-b745-ec4becc4709fPhotoluminescent Colloidal CdS Nanocrystals with High Quality via Noninjection One-Pot
Synthesis in 1-Octadecene
Jianying Ouyang,† Jasmijn Kuijper,†Simon Brot,†David Kingston,‡Xiaohua Wu,§ Donald M. Leek,†Michael Z. Hu,|
John A. Ripmeester,† and Kui Yu*,†
Steacie Institute for Molecular Sciences, Institute for Chemical Process and EnVironmental Technology, and Institute for Microstructural Sciences, National Research Council of Canada, Ottawa, Ontario K1A 0R6, Canada, and Oak Ridge National Laboratory, Oak Ridge, Tennessee 37931-6181.
ReceiVed: January 10, 2009; ReVised Manuscript ReceiVed: February 25, 2009
High-quality colloidal photoluminescent CdS quantum dots (QDs) were synthesized via a noninjection one-pot approach in noncoordinating solvent 1-octadecene. This synthetic approach uses cadmium acetate dihydrate and elemental sulfur as Cd and S sources, respectively, together with one long-chain fatty acid (CH3-(CH2)n-COOH) as surface ligands and 2,2′-dithiobisbenzothiazole (MBTS) to increase sulfur activity. The CdS QDs were synthesized at elevated temperatures such as 240-300 °C, and the kinetics of nucleation/ growth was monitored via the temporal evolution of the optical properties of the growing CdS QDs. Various synthetic parameters were investigated, such as the feed molar ratios of (0.5-8)Cd/1S and (2-64)S/1MBTS, reactant concentrations of 5-80 mmol/Kg, and growth temperature of 220-350 °C. The feed molar ratios of (1-2)Cd/1S and (8-32)S/1MBTS are suggested to be the optimal synthetic window, together with the S feed concentration of 10-20 mmol/Kg and the growth temperature of 240-260 °C. Moreover, ligand effects such as ligand length and concentration were thoroughly investigated. With an increase of the chain length of the fatty acid, the size of the resulting CdS QDs was systematically reduced. The acids of moderate carbon-chain length (n ) 10-16) bestowed CdS QDs in high quality regarding narrow size distribution (∼17-22 nm in full width at half-maximum), high nanocrystal yield, and high quantum yield (up to 30%). Meanwhile, the acids with longer carbon chain led to small-sized nanocrystals in low concentration, due to large steric hindrance retarding severely the nucleation and growth, as indicated by the late appearance of nanocrystal absorption and slow increase in size. The acids with shorter carbon chain resulted in large-sized nanocrystals in low concentration, due to small steric hindrance causing ready nucleation and growth, as indicated by the large and fast increase in size. Therefore, the steric hindrance of varied-length fatty acids affects the reactivity of Cd2+ with great impacts on the nanocrystal nucleation/growth and thus the nanocrystal size and surface passivation. Furthermore, with an increase in the acid concentration, the size and size distribution of the resulting CdS QDs increased, together with a decrease in nanocrystal yield, due to an enhanced solubility of the CdS nanocrystals and thus a hindered nucleation with a low nuclei concentration.
1. Introduction
Materials chemistry has received significant attention since the 1990s to synthesize colloidal photoluminescent (PL) semi-conductor nanocrystals, also called quantum dots (QDs) which are spherical in shape. Due to their superior optical properties including narrow emission, broad absorption, and high photo-stability, they have great potential in various applications, such as optoelectronic devices and biolabeling/imaging/sensing areas.1,2
Among the extensively studied II-VI QDs, CdS QDs are excellent as candidates of blue PL emitters. Recently, their syntheses by wet-chemistry were reviewed; there are two main approaches to colloidal CdS QDs, namely hot-injection and noninjection.3The hot-injection approach typically involves a
swift injection of precursor(s) into a hot reaction mixture which was heated to high temperature (e.g., 300-330 °C), followed by the subsequent growth at relatively low temperature (e.g., 250-300 °C).4In contrast, the noninjection approach does not
involve a high-temperature injection of precursor(s); instead, all reactants were loaded at a low temperature with the release of Cd2+by the Cd precursor at elevated temperature to initiate
nucleation,followedbythegrowthatslightlyhighertemperature.5a-d
These two approaches are basically two contrast synthesis protocols different in the manners of precursor addition and temperature programming and thus different in nucleation/ growth mechanisms.
In 2004, Cao and co-workers reported a noninjection one-pot synthesis of high-quality colloidal PL CdS QDs.5b The
synthesis employed elemental sulfur as the S source and two initiators to motivate sulfur reactivity, together with in situ formed cadmium myristate as the Cd precursor. The growth of the CdS QDs was performed in a noncoordinating solvent of 1-octadecene (ODE) at 240 °C. The feed molar ratios of S/initiator affecting the growth were reported, but little informa-tion is available on the other synthetic parameters affecting the growth and optical properties of the CdS QDs. Similar nonin-jection approaches were extended to synthesize high-quality colloidal PL CdSe and CdTe QDs.5cGenerally, the noninjection
approach is much more reproducible and ready to scale up than the hot-injection approach, without the request of the mass
* To whom correspondence should be addressed. Email: kui.yu@nrc.ca.
†Steacie Institute for Molecular Sciences.
‡Institute for Chemical Process and Environmental Technology. §Institute for Microstructural Sciences.
|Oak Ridge National Laboratory.
J. Phys. Chem. C 2009, 113, 7579
10.1021/jp900252e CCC: $40.75 2009 American Chemical Society Published on Web 04/10/2009
transportation in a short time at high temperature and the afterward fast temperature decrease to separate the nucleation and growth stages for narrow size distribution. In addition, the noninjection synthesis is usually carried out in noncoordinating solvents such as ODE instead of coordinating solvents; thus, it is relatively easy to examine the nucleation/growth kinetics.4c
Also, it has been demonstrated that the acid used as surface ligands prominently affects the kinetics of the nanocrystal nucleation/growth in ODE.6a,b A balanced nucleation/growth
achieved with the proper precursor reactivity is essential for nanocrystals in high quality in terms of bright bandgap emission, narrow bandwidth, and little trap emission. Such balanced kinetics can be realized through the control of the used acids, including the chain length, concentration, and chemical nature. However, little information is available on the acid affecting the growth and optical properties of the CdS nanocrystals from noninjection-based syntheses.5b
Many more efforts have been made to hot-injection ap-proaches to II-VI, III-V, and IV-VI QDs than those to noninjection approaches. The ligand effects in hot-injection approaches have been documented. In 2002, it was reported that the size of the CdS QDs via a hot-injection in ODE could be tuned with the concentration of the acid (namely, oleic acid, OA). Relatively large nanocrystals were obtained with relatively high OA concentrations; it was suggested that the monomer reactivity was decreased with an increase in OA concentrations.4c
Also in 2002, it was suggested that fatty acids with intermediate chain lengths, such as myristic acid (C14) and palmitic acid (C16), together with the 3Acid/1In molar ratio, were optimal for the formation of high-quality InP QDs; it was argued that the longer acids slowed down the nucleation and growth.7aIn
2003, the acid effects were addressed in the synthesis of CdTe QDs, including the chemical nature of the acid (carboxylic acid vs phosphonic acid), varied chain lengths, and chain configu-ration (saturated vs double-bonded). It was claimed that both the bonding strength and steric effect of the acid used affect dramatically the monomer reactivity, and thus influence the size, shape, crystal structure, and optical properties of the resulting nanocrystals.7bSimilar acid effects were also discussed in 2004
in the synthesis of CdSe QDs and magnetic oxide nanocrystals.7c,d
Basically, these acid effects reported were examined in hot-injection approaches in ODE, and the effects were argued to be related to the acid steric hindrance as well as bonding strength to the metal cations and thus the monomer reactivity.
Our research group has been dedicating to develop quality QDs via noninjection approaches. A series of high-quality colloidal PL QDs have been recently developed, including regular QDs (RQDs) of gradiently alloyed ZnCdS,8a
homogeneously alloyed CdSeS,8band PbS8cas well as
magic-sized QDs (MSQDs) of CdSe,6a,bCdTe,6cand CdTeSe.6dIt is
worthy of notice that the precursor leading to the formation of the MSQDs with our noninjection approaches is Cd(OOC-CH3)x(OOC-(CH2)n-CH3)2-x, which is different from that
lead-ing to the formation of RQDs, namely Cd(OOC-(CH2)n-CH3)2.
Cd(OOC-CH3)x(OOC-(CH2)n-CH3)2-xreleases Cd2+slowly
in ODE due to its poor solubility and thus the low [Cd2+]
released results in the thermodynamically driven formation of the MSQDs instead of RQDs.6a,b
The present study addresses our efforts on the development of noninjection one-pot synthesis to colloidal PL CbS QDs in ODE. The synthesis used cadmium acetate dihydrate and elemental sulfur as Cd and S sources, respectively, together with myristic acid as surface ligands and 2,2′-dithiobisbenzothiazole (MBTS) to enhance sulfur activity. Our synthesis bears similarity
to the previously reported approach,5bbut is simpler regarding
the use of only one S activator MBTS. This report presents our thorough investigation on the synthetic parameters affecting the growth of the CdS QDs and their optical properties, which was not reported before.5bThe growth kinetics was monitored by
the temporal evolution of the optical properties of the growing CdS QDs. It was found that the feed molar ratios of Cd/S and S/MBTS, reactant concentrations, and growth temperature drastically affect the growth of the CdS QDs. An optimal synthetic window leading to high-quality PL CdS QDs was found to be with the feed molar ratios of (1-2)Cd/1S and (8-32)S/1MBTS, S feed concentration ([S]) of 10-20 mmol/ kg, and the growth temperature of 240-260 °C. Moreover, the acid chemical nature and concentration have strong influences on the growth kinetics and optical qualities of the resulting CdS QDs. With the fixed feed molar ratios of 1Cd/1S and 16S/ 1MBTS as well as [S] 10 mmol/kg, the investigated acid effects consist of, mainly, the chain length of the fatty acids (in the range of 8-24 of the total carbon atoms) and the acid concentration (in the range of the feed molar ratio of (2-48)Acid/ 1Cd). Both the chain length and concentration of the acid have significant impacts on the size, size distribution, nanocrystal yield, and PL efficiency of the resulting CdS QDs. Basically, the size increases with a decrease in the ligand length and an increase in the acid concentration. High-quality CdS QDs were achieved with the acids of moderate chain length in the range of C12-18. On the other hand, few CdS QDs were formed with the use of strong acids such as n-octadecylphosphonic acid (ODPA). The mechanism underlying these acid effects could be explained by several factors, including the steric hindrance affected by the acid length, which greatly influences the nucleation/growth and surface passivation. In addition, high acid concentrations lead to an increase in the CdS nanocrystal solubility and thus hinder the nucleation; accordingly, the nuclei concentration is low, leading to a low yield of nanocrystals with large size and broad size distribution. Also, the bonding strength of the acid to the Cd cation affects the Cd2+ reactivity. The
stronger the bonding strength, the lower the Cd2+ reactivity,
the smaller the nuclei concentration, and the larger the nano-crystal size with broad size distribution and decreased QY.
2. Experimental Section
2.1. Synthesis of CdS Nanocrystals. All of the following materials were commercially available and used as received: cadmium acetate dihydrate (Cd(OAc)2·2H2O, Alfa Aesar,
99.999%), sulfur (precipitated, Anachemia), 2,2′-dithiobisben-zothiazole (Aldrich, 99%), 1-octadecene (Aldrich, tech. 90%), and the acids as surface ligands. The acids used were all from Aldrich with the highest purity (g99%): caprylic acid (C8, the number denotes the total number of carbons and the same for the other fatty acids), capric acid (C10), lauric acid (C12), myristic acid (MA, C14), palmitic acid (C16), stearic acid (SA, C18), oleic acid (OA, C18 with one double bond in the middle), arachidic acid (C20), behenic acid (C22), lignoceric acid (C24), and n-octadecylphosphonic acid (ODPA).
The growth of the CdS QDs was carried out in a reaction flask containing the two source compounds, Cd(OAc)2·2H2O
and elemental S, respectively, together with MA as surface ligands, MBTS, and ODE. All of the chemicals were loaded at room temperature with the subsequent growth at elevated temperature such as 240 °C. In a typical synthesis, S (0.05 mmol), MBTS (3.23 µmol), and ODE (∼3.0 g) were sonicated together for 1 h, which was then added into a three-necked 50-mL round-bottom flask containing Cd(OAc)2·2H2O (0.05
mmol), MA (0.10 mmol), and ODE (∼2.0 g). Subsequently, the reaction mixture was heated up to 120 °C with stirring under vacuum (∼50 mTorr). A clear solution was obtained after ∼2 h. Under a flow of purified nitrogen, the resulting solution was heated up to 240 °C at a rate of ∼10 °C/min. When the temperature reached 200 °C, the growth of the CdS QDs was monitored via the temporal evolution of the optical properties of the growing CdS nanocrystals. It is noteworthy that when cadmium myristate was made ex situ, similar growth kinetics was observed with the resulting CdS QDs exhibiting similar optical qualities.
To investigate the acid effects affecting the growth and optical properties of the CdS QDs, the syntheses were carried out with the optimal synthetic window, namely the feed molar ratios of 1Cd/1S and 16S/1MBTS and [S] 10 mmol/Kg in 5 g of ODE. Varied-length fatty acids (C8-24) were investigated with a fixed feed molar ratio of 2Acid/1Cd, and various acid concentrations were investigated with feed molar ratios of (2-48)MA/1Cd.
2.2. Optical Properties.To monitor the temporal evolution of the optical properties of the growing nanocrystals, a small amount of aliquots (∼0.2 mL) of the reaction mixture was quickly taken at 0 min/200 °C, 0 min/220 °C, and 0-180 min/ 240 °C. The optical spectra, namely absorption and photolu-minescence spectra were collected at room temperature, with the raw reaction aliquots dispersed in hexane at a certain concentration. The absorption spectra were collected using a 1-nm data collection interval (Perkin-Elmer Lambda 45 ultraviolet-visible (UV-vis) spectrometer). The photolumi-nescence spectra were collected with the excitation wavelength of 350, 370, or 400 nm, and a data sampling increment of 2 nm (Fluoromax-3 spectrometer, equipped with a 450 W Xe lamp as the excitation source, Jobin Yvon Horiba, Instruments SA). Gaussian-fitted and baseline-subtracted integration were per-formed using built-in Fluoromax3 software functions to yield emission peak, peak width (full width at half-maximum, fwhm, in nm), and peak area (intensity). The PL quantum yield (QY) was estimated by comparing the integrated emission of a given nanocrystal sample in dilute hexane solution with an optical density ∼0.1 (at the excitation wavelength) with that of quinine sulfate in 0.05 M H2SO4 (lit. QY 0.546), together with the
correction of the difference of the refractive index of the two solvents, namely hexane and water.8a
2.3. TEM and XRD. The QD samples were intensively purified for transmission electron microscopy (TEM) and powder X-ray diffraction (XRD) characterization.8aThe TEM
samples were prepared by the evaporation of dilute nanocrystal dispersions in chloroform on 300-mesh carbon-coated copper grids. The TEM work was performed on a JEOL JEM-2100F field emission source transmission electron microscope operating at 200kV. For the present study, high resolution TEM images were obtained with a Gatan UltraScan 1000 CCD camera attached to the JEM-2100F. High angle annular dark field scanning transmission electron microscopy (HAADF-STEM) images were obtained using a Fischione annular dark field detector attached to the JEM-2100F. The XRD samples were prepared by depositing the nanocrystals on low-background quartz plates, and the XRD patterns were recorded at room temperature with Bruker Axs D8 X-ray diffractometer using Cu KR radiation in the θ - θ mode. The generator was operated at 40 kV and 40 mA; data were collected between 5° and 80° in 2θ with a step size of 0.1° and a counting time of 5 s per step.
3. Results and Discussion
Our noninjection one-pot approach in ODE to high-quality colloidal PL CdS nanocrystals features high synthetic reproduc-ibility and scale-up capability. Meanwhile, ODE is a noncoor-dinating solvent, with minimum reactions with the reacting moieties. Therefore, the employed noninjection synthesis is superior to the conventional hot-injection approach, to system-atically study the synthetic parameters affecting the nucleation and growth of the nanocrystals. The results and discussion consists of seven parts: with myristic acid (MA) as the capping agent and the 2MA/1Cd feed molar ratio, our thorough investigation on the synthetic parameters including the effects of (0.5-8)Cd/1S feed molar ratios in section 3-1, (64-2)S/ 1MBTS feed molar ratios in section 3-2, [S] 5-80 mmol/Kg in section 3-3, and reaction temperature of 220-350 °C in section 3-4; with various acids as the capping agents, the effects of chain length with the 2Acid/1Cd feed molar ratio in section 3-5, concentrations of the used MA in section 3-6; nanocrystal storage stability in section 3-7.
Figure 1 shows the temporal evolution of the absorption (top-left) and photoemission (top-right) of the growing CdS QDs with feed molar ratios of 1Cd/1S and 16S/1MBTS and [S] 10 mmol/kg. The growth temperature and periods were indicated. Little absorption is observed when the growth temperature was below 200 °C (curve 1), suggesting that few CdS nanocrystals were formed. The presence of distinctive absorption started when the growth temperature reached 220 °C; the corresponding CdS nanocrystals exhibited the first excitonic absorption peaking at ∼379 nm (curve 2), indicating the presence of the CdS nanocrystals. It was reported that cadmium myristate has a decomposition point at ∼226 °C;5chowever, cadmium myristate
should dissolve in ODE at temperature below 120 °C. When the temperature reached 240 °C, the nanocrystals exhibited absorption with well-defined substructures together with the redshift of the peaks along the reaction from 0-180 min (curves 3-12). The nanocrystals with the 0 and 180 min growth periods at 240 °C exhibited their first excitonic absorption peaking at 391 nm (curve 3) and 413 nm (curve 12), respectively. The corresponding bandgap PL emission developed continuously with the peak position red shifting from 409 nm (curve 3) to 428 nm (curve 12). A little trap emission is noticed at the longer wavelength side of the bandgap emission; such degree of trap emission is very much suppressed.5bThe optical properties are
summarized in the bottom panel with the absorption and emission peak positions (bottom-left) and the fwhm (∼17-22 nm) and QY (increased continuously to 17%) (bottom-right). Figure 2 shows the TEM (top), XRD (middle), and the optical properties (bottom) of the CdS QDs obtained from a synthetic batch with the same feed molar ratios as the batch shown in Figure 1 but with the reactant concentration of 40 mmol/kg and 20 g ODE; thus, this batch was scaled up 16 times. The high resolution TEM image shows nearly monodispersed spherical QDs with clear crystal fringes; the corresponding XRD pattern reveals a cubic crystal structure, which is common for the regular nanocrystals synthesized via noninjection-based syntheses.5,8
Also, the corresponding absorption exhibits fine substructures suggesting narrow size distribution; the bandgap emission is as narrow as 20 nm in fwhm with ∼10% QY. The size is ∼4.2 nm estimated from TEM and ∼4.85 nm from the bandgap absorption peak position (440 nm).9Figure 2 demonstrates that
the scale up of our noninjection one-pot synthesis is ready (with reasonable synthetic reproducibility).
3.1. Effects of Cd/S Feed Molar Ratios.Figure 3 presents the absorption and emission spectra of the CdS QDs from six
synthetic batches with different Cd/S feed molar ratios but a fixed feed molar ratio of 16S/1MBTS and the concentration of the limiting agent of either S or Cd of 10 mmol/Kg and reaction temperature of 240 °C. For each batch, the temporal evolution of the optical properties of the growing nanocrystals was monitored for study of the growth kinetics and presented in the Supporting Information, Figure S1. It is clear that the different Cd/S feed molar ratios ranging from 1Cd/2S to 8Cd/1S resulted in the nanocrystals with different sizes and optical properties. With the Cd/S feed molar ratios smaller than 1, the growth was quite fast. For example, with 1Cd/2S, the growth was the fastest: yellow precipitates appeared after 45 min at 240 °C. The resulting CdS QDs exhibited little bandgap emission throughout the whole growth periods, which might be due to the presence of defects resulted from the fast growth. With 1Cd/ 1.4S, the reaction mixture became cloudy after 45 min at 240 °C; meanwhile, the absorption spectra lost fine substructures and the corresponding emission became broad with the decrease in QY. Therefore, it is clear that when S was excess, the growth was fast leading to the fast depletion of the concentration of the released Cd2+and soluble (CdS)
xincluding monomers and
oligomers (all of which are referred to as “Cd2+species”) and
thus the size defocusing (see Figure S1 for details).10
With (1-2)Cd/1S, the growth of the CdS QDs was steady with the redshift of the absorption and emission; the growing QDs exhibited narrow bandwidth (∼23 and ∼18 nm at 120 min, respectively) and continuously enhanced QY (∼13% and ∼16% at 120 min, respectively). With our noninjection approach, the (1-2)Cd/1S feed molar ratios are preferred for the CdS QDs exhibiting intense bandgap emission with narrow bandwidth and little trap emission.
With 4Cd/1S, the presence of an additional CdS nanocrystal ensemble with relatively small size after ∼60 min at 240 °C is worthy of notice. The additional QD ensemble may be resulted from a secondary nucleation and growth, which may be caused by the decomposition of the excess cadmium precursor around 60 min at 240 °C (see Figure S1).
With 8Cd/1S, the presence of CdS MSQDs was detected during the growth periods of 0 min/220 °C and 45 min/240 °C; the MSQDs exhibited sharp absorption peaking at 321-329 nm. Afterward, the CdS MSQDs disappeared, while the CdS RQDs remained which were relatively small in size but relatively high in particle concentration (as judged by their optical density doubled approximately as compared to those from the rest of the batches shown in Figures 3 and S1). The excess cadmium precursor in batch 8Cd/1S was suggested to decompose due to
Figure 1. Temporal evolution of the absorption (top left, offset) and photoemission (top right) of the growing CdS nanocrystals with feed molar ratios of 1Cd/1S and 16S/1MBTS and [S] 10 mmol/kg. The growth periods (in minutes) and temperature are indicated. The PL excitation wavelength was 350 nm. The temporal optical properties are summarized: (bottom left) bandgap emission and absorption peak positions are represented by (0) and (9), respectively; (bottom right) PL fwhm and QY% are represented by (O) and (b), respectively.
the presence of black materials around 7 min at 240 °C, which may induce the secondary nucleation, leading to the growth (in both size and number) of the CdS RQDs together with the significant growth (in number) of the CdS MSQDs. The presence of 0 min/220 °C CdS MSQDs in batch 8Cd/1S may be favored by the existence of the excess of Cd2+ which improves the
thermal stability of the CdS MSQDs. It has been acknowledged that high Cd/Se feed molar ratios favor the growth and thermal stability of CdSe MSQDs.6a,b
Therefore, the Cd/S feed molar ratios affect significantly the growth kinetics of the CdS nanocrystals. To the best of our
knowledge, the present study is the first on the drastic impacts observed about the cation/anion feed molar ratios affecting the growth of colloidal semiconductor QDs. Compared with the effects of the Cd/Se feed molar ratios on the optical properties of the resulting CdSe RQDs via hot-injection approaches in coordinating solvents,11the present effects of the cation/anion
feed molar ratios affecting the growth of the CdS QDs via the noninjection approach in noncoordinating solvent ODE, are relatively significant.
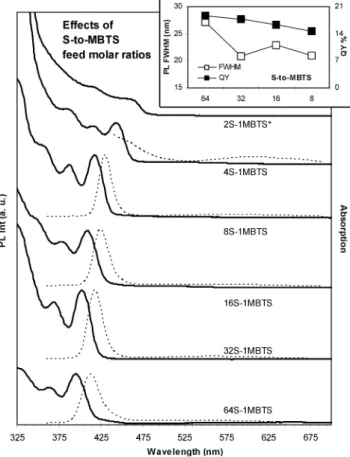
3.2. Effects of S/MBTS Feed Molar Ratios.Figure 4 shows the absorption and emission spectra of the CdS QDs from six synthetic batches with different S/MBTS feed molar ratios, ranging from 64S/1MBTS to 2S/1MBTS, and a fixed feed molar ratio of 1Cd/1S and [S] 10 mmol/Kg, and reaction temperature of 240 °C. For each batch, the temporal evolution of the optical properties of the growing nanocrystals was monitored and presented in the Supporting Information, Figure S2.
With 64S/1MBTS, the 120 min/240 °C CdS QDs exhibited bandgap emission with relatively large fwhm (∼27 nm) and high QY (∼19%). With (32-8)S/1MBTS, the resulting CdS QDs exhibited bandgap emission with narrow fwhm (∼21-23 nm) and high PL QY (∼18-15%). With (4-2)S/1MBTS, the growth of the resulting CdS QDs was relatively fast, and the CdS QDs were low in product yield and exhibited little bandgap PL emission.
MBTS is an activator to sulfur.12Therefore, it is reasonable
to expect that S/MBTS feed molar ratios affect the reactivity of sulfur, and thus the kinetics of the nucleation and growth of the resulting CdS QDs. Figures 4 presents evidently that low S/MBTS feed molar ratios lead to large nanocrystals (see also Figure S2). When S/MBTS feed molar ratios were decreased
Figure 2. Typical TEM image (top) and powder XRD pattern (middle curve 1) of the CdS nanocrystals from a large-scale synthetic batch with feed molar ratios of 1Cd/1S and 16S/1MBTS, and [S] 40 mmol/ Kg and 20 g ODE. The growth was 120 min/240 °C. The XRD pattern of bulk cubic CdS is also shown (middle curve 2), with the diffraction peaks indexed. The corresponding absorption and emission (excited at 350 nm) spectra of the as-synthesized CdS QD ensemble (dispersed in hexane) are shown (bottom), with PL fwhm ∼20 nm and QY ∼10%.
Figure 3. Cd/S feed molar ratio effects demonstrated by the absorption spectra (solid lines) and emission spectra (dashed lines, excited at 350 nm) of the CdS QDs from the synthetic batches with a fixed feed molar ratio of 16S/1MBTS and [S] 10 mmol/kg. The optical spectra are offset with the different Cd/S feed molar ratios indicated; the growth was 120 min/240 °C, except 20 min/240 °C for batch 1Cd/2S**. The optical density was normalized as 30 µL/3 mL, except for batch 8Cd/1S*, which was 15 µL/3 mL.
from 64S/1MBTS to 2S/1MBTS, the sulfur reactivity was increased leading to large-sized nanocrystals. Therefore, the more the MBTS amount, the higher the S activity and the larger the nanocrystal size.
So far, we have addressed the effects of the Cd/S and S/MBTS feed molar ratios affecting the growth of the CdS QDs. It should be pointed out that these two synthetic parameters engage together, with high Cd/S and low S/MBTS feed molar ratios favor the secondary nucleation/growth, leading to the presence of two CdS RQD ensembles. For example, the secondary nucleation and growth of the CdS RQDs leading to the presence of two ensembles was not observed in batch 2Cd/ 1S with 16S/1MBTS within 180 min/240 °C growth (as shown in Figure S1), but was observed with batch 2Cd/1S with 8S/ 1MBTS at 120 min/240 °C (see the Supporting Information, Figure S3.). Also the presence of two ensembles became more and more substantial with the 4Cd/1S feed molar ratio batches when the MBTS amount increased from 64S/1MBTS to 8S/ 1MBTS (see Figure S3.). The presence of the CdS MSQDs was also affected by these two synthetic parameters; examples are shown in Figure S4, with batches 8Cd/1S with (16-32)S/ 1MBTS and batches 4Cd/1S with (32-64)S/1MBTS. Batch 8Cd/1S with 16S/1MBTS is a good choice to observe the presence of the CdS MSQDs.
3.3. Effects of the S Feed Concentrations.Figure 5 shows the absorption and emission spectra of the CdS QDs (with the growth of 120 min at 240 °C) from five synthetic batches with
different [S] ranging from 5-80 mmol/Kg and fixed 1Cd/1S and 16S/1MBTS feed molar ratios, and reaction temperature of 240 °C. For each batch, the temporal evolution of the optical properties of the growing nanocrystals was monitored and presented in the Supporting Information, Figure S5.
To synthesize high-quality colloidal PL QDs, the reactant concentration is an important synthetic parameter which affects the growth of the nanocrystals. When [S] was 10-20 mmol/ Kg, the CdS QDs were synthesized with optimal optical properties, as evidenced by their rich absorption substructures and narrow PL emission (with fwhm of 22.9 and 20.8 nm, respectively) and high QY (16% and 19%, respectively). When [S] was increased to 40-80 mmol/Kg, the resulting CdS QDs still exhibited narrow size distribution with PL fwhm of 21.6 and 23.4 nm, respectively, but significantly reduced QY (6.6% and 6.4%, respectively). When [S] was decreased to 5 mmol/ Kg, the resulting CdS QDs exhibited broadened size distribution with PL fwhm of 25.4 nm and low QY (9.4%). Regarding the nanocrystal yield (as judged from the optical density in Figure 5), the batches with [S] 10-40 mmol/Kg are similar, but batch [S] 80 mml/Kg was reduced and batch [S] 5 mmol/Kg was significantly reduced. Regarding the growth rate of the nanoc-rystals (as judged from the absorption peak positions shown in Figure 5), the nanocrystals exhibited an increase in size with [S] increasing from 10-80 mol/Kg. However, the nanocrystals from batch [S] 5 mmol/Kg were similar in size as those from batch [S] 80 mmol/Kg; such large size resulted from batch [S] 5 mmol/Kg may be due to the significantly low nuclei concentration with relatively high Cd2+species concentration
available.
Figure 4. S/MBTS feed molar ratio effects demonstrated by the absorption spectra (solid lines) and emission spectra (dashed lines, excited at 350 nm) of the CdS QDs from the synthetic batches with a fixed feed molar ratio of 1Cd/1S and [S] 10 mmol/kg. The optical spectra are offset with the different S/MBTS feed molar ratios indicated; the growth was 120 min/240 °C, except 45 min/240 °C for batch 2S/ 1MBTS*. The optical density was normalized as 30uL/3 mL. The inset summarizes the PL fwhm (nm, left y axis, 0) and QY% (right y axis, 9) of the corresponding CdS QDs.
Figure 5. Reactant concentration effects demonstrated by the absorp-tion spectra (solid lines) and emission spectra (dashed lines, excited at 350 nm) of the CdS QDs from the five synthetic batches with fixed feed molar ratios of 1Cd/1S and 16S/1MBTS. The optical spectra are offset with the different S concentration ([S]) indicated; the growth was 120 min/240 °C. The optical density was normalized as [S] × sample concentration ) 400/3 (mmol/Kg) × /mL). The inset sum-marizes the PL fwhm (nm, left y axis, 0) and QY% (right y axis, 9) of the corresponding CdS QDs.
3.4. Effects of Growth Temperature.Figure 6 shows the absorption and emission spectra of the 180 or 8 min CdS QDs from five synthetic batches with different growth temperature ranging from 220 to 350 °C, and fixed 1Cd/1S and 16S/1MBTS feed molar ratios and [S] 10 mmol/Kg. For each batch, the temporal evolution of the optical properties of the growing nanocrystals was monitored and presented in the Supporting Information, Figure S6. The explored growth temperature range was chosen based on the following facts: (a) pure cadmium myristate was reported with its decomposition at ∼226 °C,5c
(b) the CdS QDs started to form at 220-230 °C (as shown in Figure 1), and (c) the noncoordinating solvent commercially available with the highest boiling point is n-tetracosane (n-C24H50, bp ∼391 °C).
For the CdS QDs with the growth temperature as low as 220 °C, the growth was steady up to 180 min monitored. The 180-min growth CdS QDs exhibited absorption substructures to a certain degree and the PL emission with fwhm 24.8 nm and high QY 21.6%. However, the yield of the nanocrystals was significantly reduced to about one-half of the yields of the other synthetic batches shown in Figures 6 and S6.
For the CdS QDs with the growth temperature of 240-260 °C, the growth was steady up to 180 min monitored. The 180-min growth CdS QDs exhibited optimal optical properties as evidenced by the rich absorption substructure and narrow PL emission fwhm (22.0 nm) and high QY (16.6% for batch 240 °C and 27.5% for batch 260 °C).
When the growth temperature was as high as 300 °C, the growth was steady within 8 min and the resulting CdS QDs exhibited rich absorption substructures and narrow bandwidth
(21.0 nm in fwhm) but reduced PL QY (13.8%); afterward, the growth became faster with the absorption losing substructures, accompanied by an increase in PL fwhm (23-35 nm), the decrease in PL QY (5-8%), and the decrease in optical density. Thus, the growth after 8 min reached the size defocusing stage. When the growth temperature was 350 °C, similar kinetics was observed; the 8-min growth CdS QDs exhibited PL fwhm 24.4 nm and QY 13.0%. After 45 min growth, the QDs exhibited little bandgap emission.
It is clear that the higher the growth temperature (from 300 to 350 °C), the faster the growth and the larger the nanocrystals. However, batch 220 °C does not follow this rule; the resulting 180-min growth QDs are larger than those from batch 240 °C and batch 260 °C. 220 °C is close to the decomposition point of cadmium myristate; the relatively low temperature bestows the relatively small energy to overcome the energy barrier of nucleation as well as the relatively slow decomposition of the cadmium precursor. The low nuclei concentration resulted in high Cd2+species concentration available for a fast growth of
the nanocrystals; indeed, the nanocrystal yield of batch 220 °C was about half of those of the rest of the batches (shown in Figures 6 and S6). On the other hand, the very high growth temperature such as 300 and 350 °C results in very fast growth after 8 min; the significant depletion of the Cd2+ species
concentration led to an early occurrence of the bandwidth broadening and QY decreasing. Therefore, the optimal growth temperature is suggested to be 240-260 °C, resulting in the CdS QDs with optimal optical properties via the balanced nucleation and growth.
The phase transition from the cubic to hexagonal structure was documented for CdS and CdSe nanocrystals after thermal annealing between 300-400 °C.13Thus, it would be interesting
to know whether there is a crystal structure transition from cubic, typically resulted from the noninjection synthesis, to hexagonal when the growth temperature is increased from 220 to 350 °C. The CdS QDs grown at 300 °C also exhibited a cubic crystal structure, as shown in the Supporting Information, Figure S7. Thus, the crystal structure may be determined at the nucleation stage with the temperature of 220-230 °C, and 300 °C is not high enough to cause the crystal structure transition of the CdS QDs.
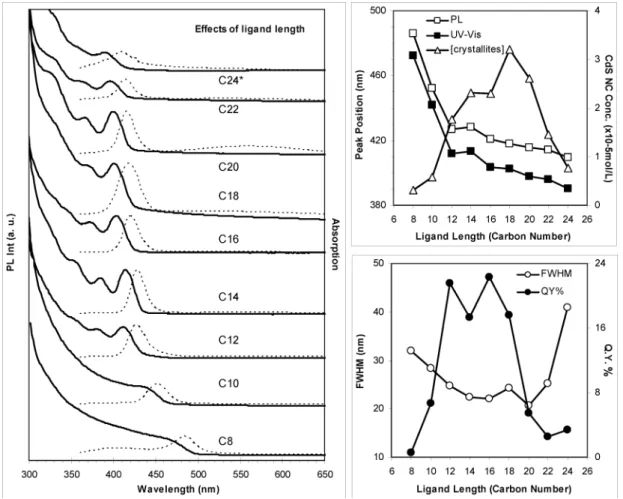
3.5. Effects of the Carbon Chain Length.Figure 7 shows the temporal evolution of the absorption (left, offset) and emission (right, normalized) spectra of the growing CdS nanocrystals with C10 (top) and C18 (bottom) acids as surface ligands. The temporal evolution of the absorption and emission monitored of the growing CdS nanocrystals with the C8-24 fatty acids as their surface ligands are presented in the Supporting Information, Figure S8. To demonstrate directly the impact of the carbon chain length of the acid used on the kinetics of the nucleation and growth and optical properties of the resulting CdS QDs, Figure 8 (left) presents the absorption and emission spectra of the 180 min/240 °C growth CdS nanocrys-tals from nine batches with the C8-24 fatty acids, and Figure 8 (right) summarizes the corresponding optical properties, including absorption and emission peak positions and nano-crystal concentration (right-top), together with QY and PL fwhm (right-bottom). The optical properties and nanocrystal concentra-tion of the 90 min/240 °C CdS QDs from these batches are summarized and presented in the Supporting Information, Figure S9.
3.5.1. Effects on Size. For the 0 min/240 °C growth, CdS
crystallites from the nine synthetic batches at the beginning reaction stage, as shown in Figures 7 and S8 and summarized
Figure 6. Growth temperature effects demonstrated by the absorption spectra (solid lines) and emission spectra (dashed lines, excited at 350 nm) of the CdS QDs from the synthetic batches with the fixed feed molar ratios of 1Cd/1S and 16S/1MBTS and [S] 10 mmol/Kg. The optical spectra are offset with the different growth temperature indicated; the growth periods were 180 min, except 8 min for batches 300 and 350 °C. The optical density was normalized as 30uL/3 mL, except for batch 350 °C* due to the presence of gel-like materials. The inset summarizes the PL fwhm (nm, left y axis, 0) and QY% (right y axis, 9) of the corresponding CdS QDs.
in Table 1, with an increase in the carbon chain length of the acids from C8 to C24, the size of the corresponding CdS QDs decreased from ∼5.2 to ∼2.8 nm. Furthermore, with C22 and C24 acids, the resulting CdS QDs exhibited noticeable absorp-tion peaks only after the 2- and 20-min growth periods, respectively. Therefore, the increase in the carbon chain length of the acid retards severely the nucleation due to their enhanced steric hindrance.
For the 180 min/240 °C growth CdS QDs from the nine synthetic batches at the later/end stage of the reaction, as summarized in Figure 8 and Table 1, with an increase in the carbon chain length of the acids, the most obvious result is a decrease in size in the resulting nanocrystals as indicated by the monotonically blue shift of the bandgap absorption and emission (Figure 8 left and right top). When the carbon chain increases from C8 to C12, the blue shift is drastic with the emission decreasing from 486 to 427 nm and absorption from 472 to 412 nm. When the carbon chain changes from C14 to C18, the blueshift is mild with the emission decreasing from 428 to 418 nm and absorption from 413 to 402 nm. When the carbon chain increases from C20 to C24, the blue shift is small with the emission decreasing from 416 to 409 nm and absorption from 398 to 390 nm. Similar effects of the ligand length on the
size were observed in the synthesis of Fe3O4nanocrystals via
the pyrolysis of Fe-fatty acid complexes.7dThe 180-min growth
CdS QDs capped with C8, C10, C12-C18, and C20-C24 ligands are thus ∼6.3, 4.9, 3.8-3.5, and 3.3-3.1 nm, respec-tively.9
For the CdS QDs from each synthetic batch as shown in Figures 7 and S8, their bandgap absorption and emission exhibit continuous red shift during the whole reaction period monitored up to 180 min at 240 °C. From 0-180 min growth periods, as listed in Table 1, when C10 acid was used, the CdS QDs exhibited ∼43 nm redshift of the absorption, corresponding to ∼1.6 nm increase in size. When C12 acid was used, the absorption red shift was ∼31 nm, corresponding to ∼1.0 nm increase in size. When C14-18 acids were used, the red shift was ∼21-22 nm, corresponding to ∼0.7 nm increase in size. When C20-24 acids were used, the red shift was ∼17-8 nm, corresponding to ∼0.5-0.2 nm increase in size. Apparently, the increase in the carbon chain length of the acid slows down the nanocrystal growth.
3.5.2. Effect on Size Distribution.The size distribution of the CdS QDs, indicated by their absorption and emission bandwidth, is also affected significantly by the used acids. As summarized in Figure 8 right bottom, the 180 min/240 °C
Figure 7. Temporal evolution of absorption (left, offset, normalized as 30 µL/3 mL) and photoluminescent emission (right, excited at 350 nm, normalized) of the growing CdS nanocrystals. The used acids were C10 (top) and C18 (bottom). The growth periods (in minutes) and temperature are indicated by different colors. The CdS QDs were dispersed in hexane. The syntheses were carried out with the feed molar ratios of 2Acid/1Cd, 1Cd/1S, and 16S/1MBTS and [S] 10 mmol/Kg.
growth CdS nanocrystals exhibit a decrease in PL fwhm from C8 to C20 acid and then an increase from C20 to C24 acid. Thus, when the acids such as C14 acid were used, the size distribution of the resulting CdS QDs is relatively small.
For the growing CdS QDs from individual synthetic batch with C8-20 acids (as shown in Figures 7 and S8), their bandwidth exhibits an initial decrease and an afterward increase to plateau, when monitored at 240 °C for 180 min. Such a trend on the development of the size distribution is in agreement with a size “focusing” in the early stage and “defocusing” in the later stage during the growth of II-VI and III-V QDs via hot-injection approaches.10When C8 and C10 acids were used, the
smallest fwhm was ∼23 nm at 1 min and the largest was ∼31 nm at 45 min of the growth periods. Such broadening in size distribution during the growth was accompanied by the corre-sponding rapid growth in size.
When C12 acid was used, the resulting CdS QDs exhibited their PL fwhm 25-28 nm throughout 180 min growth periods. Such broadness in size distribution was due to the high growth rate. When C14-18 acids were used, in general, the PL fwhm of the CdS QDs maintained small for long growth periods, suggesting narrow size distribution due to their slow growth with mild size defocusing.10 For example, the CdS QDs with
C14 acid as their surface ligands exhibited small PL fwhm of 17-20 nm up to 90-min growth, followed by a mild broadening with the PL fwhm from ∼18 nm at 90 min to ∼22 nm at 180 min. With C20 acid, the CdS QDs exhibited a small PL fwhm of 18-22 nm within the 180 min growth.
With C22 acid, the CdS QDs exhibited a continuous decrease in PL fwhm from ∼28 nm to ∼22 nm throughout the reaction. Such a broad size distribution in the early growth stage but narrowed down in the later stage suggested the presence of size
Figure 8. (left) Effects of the carbon chain length of the acids used as surface ligands demonstrated by the absorption spectra (solid lines) and emission spectra (dashed lines, excited at 350 nm) of the CdS QDs from the synthetic batches with the C8 to C24 acids used as the surface ligands. The growth period/temperature was 180 min/240 °C, and the optical spectra are offset from batch C8 to batch C24. The CdS QDs were dispersed in hexane and the optical density was normalized as 30 µL/3 mL, except for batch C24*, which was 100 µL/3 mL. (right) The corresponding nanocrystal optical properties and concentrations are summarized (excitation 370 nm was used for QY estimation). All of the syntheses were carried out with the feed molar ratios of 2Acid/1Cd and 1Cd/1S and 16S/1MBTS and [S] 10 mmol/Kg.
TABLE 1: Bandgap Absorption Peak Positions (in nm) and Corresponding Sizes (in nm, Estimated from the Absorption Peak Position9) of the Growing CdS QDs from the Batches with the C8-24 Fatty Acids as Ligands, with 0- and 180-min Growth at 240 °C
C8 C10 C12 C14 C16 C18 C20 C22 C24 0 min/240 °C absorption, nm 449 399 381 391 381 380 381 382 at 2 min 383 at 20 min 180 min/240 °C absorption, nm 472 442 412 412 403 402 398 396 390
0 min/240 °C size, nm 5.23 3.35 2.81 3.10 2.81 2.79 2.81 2.84 2.87 180 min/240 °C size, nm 6.27 4.93 3.79 3.79 3.48 3.45 3.32 3.26 3.07 size increase, nm 1.04 1.58 0.98 0.69 0.67 0.66 0.51 0.42 0.20
focusing with long growth periods after nucleation. Such a trend could be related to the presence of high Cd2+species
concentra-tion due to the slow nucleaconcentra-tion and growth.10With C24 acid,
the bandwidth maintained as large as ∼40 nm, after the presence of the absorption at 20 min. The significant extension of the nucleation stage is due to the large steric hindrance of the lengthy carbon chain; such continuous nucleation was evident also by the size increase of ∼0.2 nm only within the 180 min growth periods.
Therefore, the length of the carbon chain of the acid plays an important role in both nucleation and growth stages. When C12-22 acids were used, the resulting 180 min-growth CdS QDs exhibited relatively narrow size distribution, as compared to those when the shorter and longer acids were used, which were C08, C10, and C24 acids.
3.5.3. Effects on Nanocrystal Yield.The crystallite concen-trations can be calculated by Beer-Lambert law using the extinction coefficients reported in literature.9As summarized
in Figure 8 right top, when C14-20 were used, the resulting 180-min growth CdS QDs are relatively high in crystallite concentration, as compared to those when shorter or longer acids were used. It is easy to understand that the resulting crystallite
concentration ([CdS QDs]) is affected by several factors including the reactivity (and mobility) of the Cd2+species: Cd2+
+S2-/(CdS)
x(soluble) / (CdS)n(nuclei) / CdS QDs. Low
Cd2+and (CdS)
xconcentrations lead to low crystallite
concen-tration.
With the long-chain fatty acids due to large steric hindrance, it is difficult for the nucleation/growth to proceed; thus, the long-chain acids lead to low crystallite concentration. Meanwhile, with the short-chain fatty acids, it is easy for the nucleation/ growth to proceed, leading to a large amount of nuclei but with a quick consumption of the Cd2+ species including the Cd2+
released and soluble (CdS)x. Due to the low Cd2+ species
concentration, these early formed nuclei are not thermally stable and decompose into the Cd2+species along the reaction (with
an increase in temperature). Consequently, the concentration of the nuclei decreases, leading to the formation of large-size nanocrystals but with low yield.
Therefore, the fatty acid with a moderate carbon chain length (such as C14) leads to the balanced nucleation and growth kinetics with the mild consumption of the Cd2+species and thus
high nanocrystal yield.
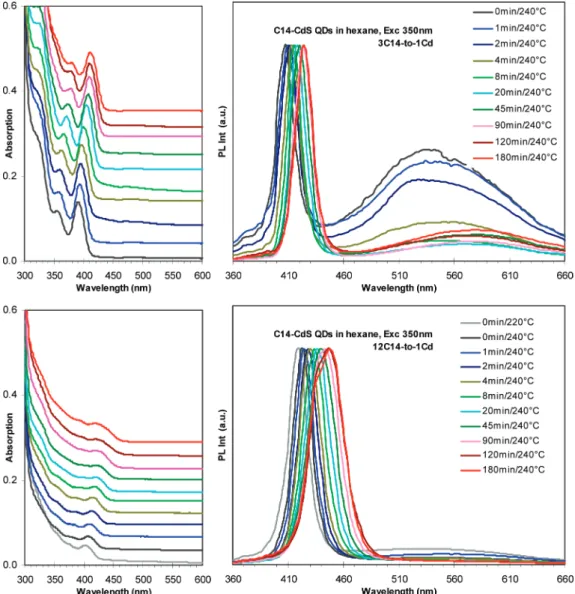
Figure 9. Temporal evolution of absorption (left, offset, normalized as 45 µL/3 mL) and photoluminescent emission (right, excited at 350 nm, normalized) of the growing CdS nanocrystals from the synthetic batches with the feed molar ratios of 3MA/1Cd (top) and 12MA/1Cd (bottom). The growth periods (in minutes) and temperature are indicated by different colors. The CdS QDs were dispersed in hexane. The syntheses were carried out with the feed molar ratios of 1Cd/1S and 16S/1MBTS and [S] 10 mmol/Kg.
3.5.4. Effects on PL Efficiency.The carbon chain length of the fatty acid also has strong impacts on the emission efficiency of the resulting CdS QDs. As shown in Figure 8 right bottom, for the 180-min growth CdS QDs, relatively high QYs were achieved with C12-18 acids, whereas low QYs were obtained when the shorter or longer acids were used. The change of the QY of the CdS QDs as the function of the ligand length is discussed in section 3.5.5.
For the growing CdS QDs from one synthetic batch (as shown in Figures 7, 8, and S8), when C12-18 acids were used, the resulting CdS QDs exhibited a steady growth in size and a steady increase in QY along the reaction; after 90 min of growth/ annealing at 240 °C, their QY reached as high as 17-25%. When the shorter and longer acids were used, the resulting CdS QDS exhibited low QY (in range of 0.6-7%).
Therefore, C12-18 acids are categorized as the optimal group. The other acids with either shorter or longer carbon chains are categorized as the nonoptimal group. The CdS QDs capped with the optimal group ligands exhibit both narrow size distribution and high QY with high nanocrystal concentration. In summary, an appropriate carbon chain length of the fatty acid is essential to achieve balanced nucleation and growth, which leads to the CdS nanocrystals of high quality in terms of narrow size distribution, high particle concentration, and high quantum yield.
3.5.5. Mechanisms of the Carbon Chain Length of the Acid Affecting the Size, Size Distribution, Concentration, and
Emission Efficiency.Experimentally, the C8-24 fatty acids
play significant roles affecting the size, size distribution,
nanocrystal yield, and emission efficiency of the CdS QDs synthesized via our noninjection approach. Now, let us turn our attention to the mechanisms of the acid chain length affecting the kinetics of the nucleation and growth and surface passivation of the CdS QDs. From the diffusion point of view, the hydrocarbon tail of a long-chain acid slows down the diffusion of a Cd2+ion due to its steric hindrance, resulting
in low Cd2+reactivity. Thus, the long-chain acid slows down
the nucleation and growth, and the possible addition of the Cd2+onto the crystal lattice is not easy. From the viewpoint
of crystal integration, the packing of the long-chain ligands on the crystal surface decreases in order, and the interaction between the surface Cd atom with the ligand becomes ineffective due to the ligand bulkiness (with possible entanglement). In addition, the long hydrophobic tail of the ligand favors relatively to leave the nanocrystal surface to solvent ODE, as compared to the short-chain counterpart. Thus, the long-chain acids lead to small-sized nanocrystals with low yields and low emission efficiency due to poor surface passivation. Figure S8-f in the Supporting Information demonstrates the poor stability of the as-synthesized C24-capped CdS QDs dispersed in hexane. The optical density decreased continuously after their dispersed in hexane, suggesting the fast disappearance of the nanocrystals.
In contrast, with the short-chain acids, the corresponding Cd2+
reactivity is high due to ready diffusion and easy integration, leading to fast nucleation and growth. However, the drastic depletion of the Cd2+species leads to a low nuclei concentration
Figure 10. (left) Effects of the concentration of the acid used as surface ligands demonstrated by the absorption spectra (solid lines, normalized as 45 µL/3 mL) and emission spectra (dashed lines, excited at 350 nm). The optical spectra are offset with the different acid amount indicated; the growth period/temperature was 90 min/240 °C. The CdS QDs were dispersed in hexane. (right) The corresponding nanocrystal optical properties and concentrations are summarized (excitation 370 nm was used for QY estimation). Note that the optical density of batch 12MA/1Cd was only 0.06, but with high QY. All the syntheses were carried out with the feed molar ratios of 1Cd/1S and 16S/1MBTS and [S] 10 mmol/Kg.
(as mentioned in section 3.5.3). Meanwhile, the fast growth in size results in broad size distribution and the presence of defects in the crystals with low QY. Consequently, the short-chain acids lead to large-sized nanocrystals with large size distribution, low nanocrystal yield, and low emission efficiency.
Therefore, to synthesize colloidal PL nanocrystals of high quality, the use of one fatty acid with an appropriate carbon chain length, such as C12-18, is essential. Such an acid leads to reasonable Cd2+reactivity and thus balanced nucleation and
growth of the resulting nanocrystals for high quality.
To test the above statement on the Cd2+reactivity affecting
the growth of the nanocrystals, syntheses with reaction tem-perature of 240 and 300 °C were carried out, together with the use of other acids. As mentioned, the Cd2+reactivity is related
to its diffusion mobility, which increases with reaction temper-ature. Examples of the CdS QDs with the growth temperature of 240 and 300 °C are shown in the Supporting Information, Figure S8-a with C8 acid, Figure S8-b with C14 acid, and Figure S8-c with C18 acid. It is clear that high reaction temperature favors the formation of large nanocrystals; such an effect is more
Figure 11. Storage stability monitored by the optical properties of the C14 (MA)-capped (top) and C18 (SA)-capped (bottom) CdS QDs. The storage periods were 33 months (top) and 31 months (bottom). The CdS QDs were synthesized with the feed molar ratios of 2Acid/1Cd, 1Cd/1S, 16S/1MBTS, and [S] 10 mmol/Kg; the growth was 180 min/240 °C.
evident with the short-chain acids than with the long-chain acids. When C8 acid was used, the 300 °C growth CdS QDs exhibited no bandgap emission, probably due to the presence of defects during their fast growth. When C14 acid was used, the growth around 20 min at 300 °C was much faster than that when C18 acid was used.
In addition to the reaction temperature, the configuration of the acid carbon chain also plays a role affecting the diffusion mobility of a Cd2+in ODE. Oleic acid is more bending than
stearic acid due to the existence of a cis-double bond in the middle of the carbon chain. As shown in Figure S8-d, when oleic acid (OA-C18) was used, the resulting CdS QDs were relatively high in concentration but relatively low in QY, as compared to those when stearic acid (SA-C18) was used. Accordingly, the difference in the nanocrystal yield might be related to relatively high reactivity of the Cd2+ (due to the
relatively high mobility of the OA ligand in ODE); meanwhile, the difference in the emission efficiency might be related to the relatively fast growth and/or relatively loose packing of the OA ligand on the nanocrystal surface. Interestingly, OA was documented as a preferred acid leading to more stable nanoc-rystals than other saturated fatty acids.7b
Also, it is necessary to point out that the reactivity of the Cd2+is related greatly to the affinity of the anion group of the
acid used to the Cd cation. The acids tested as surface ligands including carboxylic acids and phosphonic acids; the latter does not favor the formation of CdS QDs. One example is shown in the Supporting Information, Figure S8-e, with n-octadecylphos-phonic acid (ODPA) as the ligands and 300 °C as the growth temperature. There were few CdS QDs formed with the growth temperature of 240 °C, due to the strong affinity of the phosphonic acid with Cd atoms; the resulting Cd-ODPA precursor was very stable with low reactivity. However, such low reactivity could be overcome with high reaction temperature, such as 300 °C. Thus, the Cd2+ reactivity is related to the
temperature: the higher the reaction temperature, the higher the reactivity. The fact that the reactivity of the Cd-phosphonic acid precursor is lower than that of the Cd-carboxylic acid precursor was also confirmed in the syntheses of InP and CdTe QDs.5c,7a
In conclusion of the investigation on the nature of the acid, myristic acid, the fatty acid with the total carbon number of 14, is our preference to high-quality CdS QDs via our nonin-jection approach in ODE.
3.6. Effects of Acid Concentration. The effects of acid concentrations on the growth kinetics and optical properties of the CdS QDs synthesized via our noninjection approach were investigated, with myristic acid (MA, C14) chosen as the model acid and the feed molar ratios of 2MA/1Cd up to 48MA/1Cd. Figure 9 shows the temporal evolution of the absorption (offset) and emission (normalized) spectra of the growing CdS nanoc-rystals from the synthetic batches with the 3MA/1Cd (top) and 12MA/1Cd (bottom) feed molar ratios and 240 °C as the growth temperature. The temporal evolution of the absorption and emission spectra of the growing CdS nanocrystals from six synthetic batches with feed molar ratios of 2, 3, 6, 12, 24, and 48MA/1Cd are shown in Supporting InformationFigure S10. Figure 10 (left) presents the absorption and emission spectra of the 90 min-growth CdS nanocrystals from the six batches. Figure 10 (right) summarizes the optical properties and nanocrystal concentrations obtained. The optical properties and nanocrystal concentrations of the 4, 20, and 90 min CdS QDs from the six synthetic batches are addressed in Supporting Information Figure S11.
For the CdS QDs from the synthetic batches with the (2-6)MA/1Cd feed molar ratios, their growth was relatively steady, leading to the 90-min growth CdS nanocrystals with relatively small sizes, narrow size distributions, high concentra-tions, and reasonable QYs. With the 12MA/1Cd feed molar ratio, the 90-min growth CdS nanocrystals exhibited the highest QYs (as shown in Figure 10 right-bottom), which may be related to the good surface passivation under such a high acid concentration. With the (24-48)MA/1Cd feed molar ratios, the resulting 90-min CdS QDs exhibited very low QY with large sizes and broad size distributions and low particle yields; the effects of the large acid concentrations are similar to those of the short-chain fatty acids.
In general, high acid concentrations lead to nanocrystals with large sizes, broad size distributions, and low concentrations. Such a relationship may be due to the increase of the CdS nanocrystal solubility, leading to retarded nucleation and low nuclei concentrations.
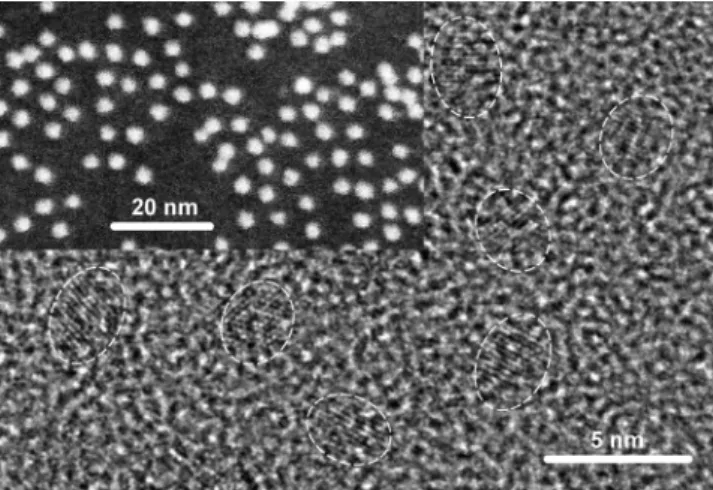
3.7. Storage Stability. Figure 11 demonstrates the storage stability of the CdS QDs from the synthetic batches with C14 acid (top) and C18 acid (bottom) used; the resulting CdS QDs were stored in their synthetic media for 33 and 31 months, respectively. Figure 11 shows the change of the PL intensity before and after the storage with the normalization of the absorption. It is clear that both the C14-capped QDs and C18-capped QDs possess high storage stability, with little change of the fine substructures of their absorption after storage. The 31-month-old C18-capped QDs were directly imaged by TEM as shown Figure 12. Moreover, the storage stability of C14-capped QDs is higher than that of C18-C14-capped QDs, as judged by the change of their PL intensity before and after storage; such difference may suggest that the packing of the C14 ligands on the CdS QD surface might be relatively good as compared to that of the C18 ligands.
4. Conclusions
The present study addresses the synthesis of colloidal photoluminescent CdS quantum dots with high quality regarding bright bandgap emission with little trap emission and narrow bandwidth. The synthesis was carried out in a noncoordinating solvent 1-octadecene via a noninjection one-pot approach, with cadmium acetate dihydrate and elemental sulfur as Cd and S
Figure 12. TEM image of the 31-month-old C18-capped CdS QDs with the 180 min/240 °C growth from the synthetic batch with the feed molar ratios of 2C18/1Cd, 1Cd/1S, 16S/1MBTS, and [S] 10 mmol/ Kg. The inset is a HAADFSTEM (high angle annular dark field -scanning transmission electron microscope) image.
sources, respectively, together with myristic acid (MA, C14, with a 2MA/1Cd feed molar ratio) as surface ligands and 2,2′-dithiobisbenzothiazole (MBTS) to promote sulfur reactivity. We investigated thoroughly the growth of the CdS QDs affected by the synthetic parameters, which were the Cd/S and S/MBTS feed molar ratios, reactant concentrations, and growth temper-ature. Our study suggests that the Cd/S feed molar ratio drastically affect the growth, together with the S/MBTS feed molar ratio. The high Cd/S and low S/MBTS feed molar ratios promote the secondary nucleation and the CdS MSQDs. Also, our study suggests that the low reactant concentration (such as [S] 5 mmol/Kg) and the low reaction temperature (such as 220 °C) led to low nuclei concentrations and thus large-sized nanocrystals with poor optical properties. The high reactant concentration (such as [S] 40-80 mmol/Kg) and the high reaction temperature (such as 300-350 °C) led to fast growth with the resulting CdS QDs exhibiting low PL QY. Accordingly, the (1-2)Cd/1S and (8-32)S/MBTS feed molar ratios were preferred for the growth of high quality CdS QDs, together with the [S] 10-20 mmol/Kg and reaction temperature of 240-260 °C. The resulting CdS QDs has a cubic crystal structure. The present synthesis is ready and features high synthetic reproduc-ibility and large scale capability.
The effects of the length and concentration of the fatty acid used as surface ligands were also investigated thoroughly. The size of the resulting CdS QDs systematically decreased with an increase of the chain length (from C8 to C24) of the fatty acid. When the acid with a moderate carbon chain length, such as C14, was used, the resulting CdS QDs exhibited high QY with narrow size distribution and high concentration. The shorter acids, such as C8 and C10, led to large-sized CdS QDs with low QY, large size distribution, and low concentration. The longer acids, such as C22 and C24, resulted in small-sized CdS QDs with low QY, large size distribution, and low concentration. These effects could be explained, mainly, by the steric hindrance leading to different reactivity of the Cd2+. The acids with long
chains resulted in low reactivity of the Cd2+in ODE due to
low diffusion capability caused by large steric hindrance, which retarded the nucleation and growth. Also, such acids led to poor surface passivation due to low degree of order on the surface and readiness of leaving the surface to ODE. The acid with short chains with small steric hindrance in ODE resulted in high reactivity of the Cd2+due to high diffusion capability. The fast
nucleation led to the rapid decrease of the Cd2+ species
concentration and thus the decomposition of the early formed nuclei; the fast growth led to the presence of defects in the resulting nanocrystals and thus with low QY. The acids with moderate carbon chain lengths resulted in balanced nucleation and growth, together with superior surface passivation, leading to the CdS QDs of high quality. In addition, the acid concentra-tion has a great impact. The high concentraconcentra-tion of myristic acid exhibited similar effects as the acid with shorter carbon chain length: the increase of the MA concentration resulted in the increase in size and size distribution and decrease in concentra-tion of the CdS QDs. At high acid concentraconcentra-tions, such as with the (24-48)MA/1Cd feed molar ratios, the resulting CdS QDs exhibited low QYs, due to fast growth in size with the presence of defects. The higher the acid concentration, the higher the CdS nanocrystal solubility, the more difficult the nucleation, the lower the nuclei and nanocrystal concentration, and the faster growth in size with larger size distribution and more defects. Thus, all the synthetic parameters/formulation and reaction temperature, investigated, affecting the formation and optical
properties of the CdS nanocrystals can be understood by the symbolized equations:
Acknowledgment.J.O. thanks Natural Sciences and Engi-neering Research Council of Canada (NSERC) for visiting fellowships at National Research Council of Canada (NRC). J.K. thanks the internship of her school, the Hogeschool Fontys Eindhoven (Netherland), and S.B. thanks the internship of his school, Joseph Fourier University (Grenoble-France, Material Science and Engineering at Polytech). M.Z.H.’s contribution was partially sponsored by the relevant LDRD and Seed Money fund at the Oak Ridge National Laboratory.
Supporting Information Available: Detailed growth kinet-ics monitored by the temporal evolution of the absorption and emission of the growing CdS nanocrystals from the various batches with the different Cd/S and S/MBTS feed molar ratios, S concentrations, and growth temperature are available, together with the XRD pattern of the 300 °C growth CdS QDs. The effects of the high Cd/S and low S/MBTS feed molar ratios on the secondary nucleation and growth leading to the presence of two CdS RQD ensembles are addressed, together with the presence of the CdS MSQDs. The temporal evolution of the absorption and emission spectra of the growing CdS QDs from the batches with the various acids as their surface ligands, with the various MA/Cd feed molar ratios, the summary of the optical properties and nanocrystal concentration from these batches, and TEM. This material is available free of charge via the Internet at http://pubs.acs.org.
References and Notes
(1) (a) Coe-Sullivan, S.; Woo, W.-K.; Steckel, J. S.; Bawendi, M. G.; Bulovic, V. Org. Electron. 2003, 4, 123–130. (b) Mueller, A. H.; Petruska, M. A.; Achermann, M.; Werder, D. J.; Akhadov, E. A.; Koleske, D. D.; Hoffbauer, M. A.; Klimov, V. I. Nano Lett. 2005, 5, 1039–1044. (c) Zhao, J.; Bardecker, J. A.; Munro, A. M.; Liu, M. S.; Niu, Y.; Ding, I.-K.; Luo, J.; Chen, B.; Jen, A. K.-Y.; Ginger, D. S. Nano Lett. 2006, 6, 463–467. (d) Gur, I.; Fromer, N. A.; Chen, C.-P.; Kanaras, A. G.; Alivisatos, A. P. Nano
Lett. 2007, 7, 409–414. (e) Saunders, B. R.; Turner, M. L. AdV. Colloid
Interface Sci. 2008, 138, 1–23. (f) Anikeeva, P. O.; Madigan, C. F.; Halpert, J. E.; Bawendi, M. G.; Bulovic´, V. Phys. ReV. B 2008, 78, 085434.
(2) (a) Bruchez, M., Jr.; Moronne, M.; Gin, P.; Weiss, S.; Alivisatos, A. P. Science 1998, 281, 2013–2016. (b) Chan, W. C. W.; Nie, S. Science
1998, 281, 2016–2018. (c) Medintz, I. L.; Uyeda, H. T.; Goldman, E. R.; Mattoussi, H. Nat. Mater. 2005, 4, 435–446. (d) Michalet, X.; Pinaud, F. F.; Bentolila, L. A.; Tsay, J. M.; Doose, S.; Li, J. J.; Sundaresan, G.; Wu, A. M.; Gambhir, S. S.; Weiss, S. Science 2005, 307, 538–544. (e) Medintz, I. L.; Clapp, A. R.; Brunel, F. M.; Tiefenbrunn, T.; Tetsuo Uyeda, H.; Chang, E. L.; Deschamps, J. R.; Dawson, P. E.; Mattoussi, H. Nat. Mater. 2006, 5, 581–589. (f) Liu, W.; Howarth, M.; Greytak, A. B.; Zheng, Y.; Nocera, D. G.; Ting, A. Y.; Bawendi, M. G. J. Am. Chem. Soc. 2008, 130, 1274– 1284.
(3) Yu, K.; Ouyang, J.; Vincent, M.; Chabloz, D.; Wilkinson, B.; Perier, F. Synthesis and Characterization of Colloidal Semiconductor Quantum
Dots as Blue Photoluminescent Emitters’, in Doped Nanomaterials and NanodeVices; Chen, W., Ed.; American Scientific Publishers: Stevenson Ranch, CA,2009.
(4) (a) Murray, C. B.; Norris, D. J.; Bawendi, M. G. J. Am. Chem.
Soc. 1993, 115, 8706–8715. (b) Peng, Z. A.; Peng, X. J. Am. Chem. Soc.
2001, 123, 183–184. (c) Yu, W. W.; Peng, X. Angew. Chem., Int. Ed. 2002,
41, 2368–2371. (d) Steckel, J. S.; Zimmer, J. P.; Coe-Sullivan, S.; Stott, N. E.; Bulovic, V.; Bawendi, M. G. Angew. Chem., Int. Ed. 2004, 43, 2154– 2158. (e) Zhong, X.; Liu, S.; Zhang, Z.; Li, L.; Wei, Z.; Knoll, W. J. Mater.
Chem. 2004, 14, 2790–2794.
(5) (a) Park, J.; An, K.; Hwang, Y.; Park, G.; Noh, H.-J.; Kim, J.-Y.; Park, J.-H.; Hwang, N.-M.; Hyeon, T. Nat. Mater. 2004, 3, 891–895. (b) Cao, Y. C.; Wang, J. J. Am. Chem. Soc. 2004, 126, 14336–14337. (c) Yang, Y. A.; Wu, H.; Williams, K. R.; Cao, Y. C. Angew. Chem., Int. Ed.
Cd2++S2-/ (CdS)
x(soluble) /
(CdS)n(nuclei) / CdS QDs
2005, 44, 6712–6715. (d) Park, J.; Joo, J.; Kwon, S. G.; Jang, Y.; Hyeon, T. Angew. Chem., Int. Ed. 2007, 46, 4630–4660. (e) Pan, D.; Jiang, S.; An, L.; Jiang, B. AdV. Mater. 2004, 16, 982–985.
(6) (a) Ouyang, J.; Zaman, B.; Yan, F.; Johnston, D.; Li, G.; Wu, X.; Leek, M. D.; Ratcliffe, C. I.; Ripmeester, J. A.; Yu, K. J. Phys. Chem. C
2008, 112, 13805–13811. (b) Yu, K.; Ouyang, J.; Zaman, B.; Johnston, D.; Yan, F.; Li, G.; Ratcliffe, C. I.; Leek, M. D.; Wu, X.; Stupak, J.; Jakubek, Z.; Whitfield, D. J. Phys. Chem. C 2009, 113, 3390-3401. (c) Wang, R.; Ouyang, J.; Nikolaus, S.; Brestaz, L.; Zaman, Md. B.; Wu, X.; Leek, M. D.; Ratcliffe, C. I.; Yu, K. Chem. Commun. 2009, 962–964. (d) Wang, R.; Calvignanello, O.; Ratcliffe, C. I.; Wu, X.; Leek, D. M.; Zaman, Md. B.; Kingston, D.; Ripmeester, J. A.; Yu, K. J. Phys. Chem. C 2009, 113, 3402-3408.
(7) (a) Battaglia, D.; Peng, X. Nano Lett. 2002, 2, 1027–1030. (b) Yu, W. W.; Wang, Y. A.; Peng, X. Chem. Mater. 2003, 15, 4300–4308. (c) Bullen, C. R.; Mulvaney, P. Nano Lett. 2004, 4, 2303–2307. (d) Jana, N. R.; Chen, Y.; Peng, X. Chem. Mater. 2004, 16, 3931–3935.
(8) (a) Ouyang, J.; Ratcliffe, C. I.; Kingston, D.; Wilkinson, B.; Kuijper, J.; Wu, X.; Ripmeester, J. A.; Yu, K. J. Phys. Chem. C 2008, 112, 4908–
4919. (b) Ouyang, J.; Vincent, M.; Descours, P.; Boivineau, T.; Kingston, D.; Zaman, Md. B.; Wu, X.; Yu, K. J. Phys. Chem. C 2009, 113, 5193-5200. (c) Liu, T.-Y.; Li, M.; Ouyang, J.; Zaman, M. B.; Wang, R.; Wu, X.; Yeh, C.-S.; Lin, Q.; Yang, B.; Yu, K. J. Phys. Chem. C 2009, 113, 2301– 2308.
(9) Yu, W. W.; Qu, L.; Guo, W.; Peng, X. Chem. Mater. 2003, 15, 2854–2860.
(10) (a) Peng, X.; Wickham, J.; Alivisatos, A. P. J. Am. Chem. Soc.
1998, 120, 5343–5344. (b) Qu, L.; Yu, W. W.; Peng, X. Nano Lett. 2004,
4, 465–469.
(11) (a) Qu, L.; Peng, X. J. Am. Chem. Soc. 2002, 124, 2049–2055. (b) Yu, K.; Zaman, M. B.; Singh, S.; Wang, W.; Ripmeester, J. A. J. Nanosci.
Nanotechnol. 2005, 4, 659. (c) Yu, K.; Zaman, M. B.; Ripmeester, J. A. J.
Nanosci. Nanotech. 2005, 4, 669.
(12) Coran, A. Y. J. Appl. Polym. Sci. 2003, 87, 24–30.
(13) Bandaranayake, R. J.; Wen, G. W.; Lin, J. Y.; Jiang, H. X.; Sorensen, C. M. Appl. Phys. Lett. 1995, 67, 831–833.
JP900252E
![Figure 3. Cd/S feed molar ratio effects demonstrated by the absorption spectra (solid lines) and emission spectra (dashed lines, excited at 350 nm) of the CdS QDs from the synthetic batches with a fixed feed molar ratio of 16S/1MBTS and [S] 10 mmol/kg](https://thumb-eu.123doks.com/thumbv2/123doknet/14157024.472697/6.883.483.795.64.473/figure-effects-demonstrated-absorption-spectra-emission-spectra-synthetic.webp)