Publisher’s version / Version de l'éditeur:
Questions? Contact the NRC Publications Archive team at
PublicationsArchive-ArchivesPublications@nrc-cnrc.gc.ca. If you wish to email the authors directly, please see the first page of the publication for their contact information.
https://publications-cnrc.canada.ca/fra/droits
L’accès à ce site Web et l’utilisation de son contenu sont assujettis aux conditions présentées dans le site LISEZ CES CONDITIONS ATTENTIVEMENT AVANT D’UTILISER CE SITE WEB.
Research Report (National Research Council of Canada. Institute for Research in
Construction), 2009-03-31
READ THESE TERMS AND CONDITIONS CAREFULLY BEFORE USING THIS WEBSITE.
https://nrc-publications.canada.ca/eng/copyright
NRC Publications Archive Record / Notice des Archives des publications du CNRC :
https://nrc-publications.canada.ca/eng/view/object/?id=83761bfd-0551-44f4-8ea7-912428e7d611 https://publications-cnrc.canada.ca/fra/voir/objet/?id=83761bfd-0551-44f4-8ea7-912428e7d611
NRC Publications Archive
Archives des publications du CNRC
For the publisher’s version, please access the DOI link below./ Pour consulter la version de l’éditeur, utilisez le lien DOI ci-dessous.
https://doi.org/10.4224/20377330
Access and use of this website and the material on it are subject to the Terms and Conditions set forth at
Fire Performance of Houses. Phase I. Study of Unprotected Floor
Assemblies in Basement Fire Scenarios. Part 4 - Results of Test UF-05
(Metal-Plate Wood Trusses)
Su, J. Z.; Bénichou, N.; Bwalya, A. C.; Lougheed, G. D.; Taber, B. C.;
Leroux, P.; Kashef, A.; Thomas, J. R.
Fire Performance of Houses
Phase I
Study of Unprotected Floor
Assemblies in Basement Fire
Scenarios
Part 4 – Results of Test UF-05
(Metal-Plate-Connected Wood
Trusses)
Research Report: IRC-RR-249
Date: March 31, 2009
Authors: J.Z. Su, N. Bénichou, A.C.
Bwalya, G.D. Lougheed, B.C.
Taber, P. Leroux, A.H. Kashef,
J.R. Thomas
INSTITUTE FOR RESEARCH IN CONSTRUCTION
Fire Research Program
TABLE OF CONTENTS
TABLE OF CONTENTS
... i
LIST OF FIGURES
... iii
LIST OF TABLES
... iv
ABSTRACT
... v
1 INTRODUCTION
... 1
1.1 Background
... 1
1.2 Goals of the Research
... 2
1.3 General Research Approach
... 2
1.4 Scope of the Research Projects
... 3
1.5 Content of this Document
... 3
2 EXPERIMENTAL STUDY
... 4
2.1 Geometry - Compartments in the Facility
... 4
2.1.1 Fire Compartment in Basement
... 4
2.1.2 First Storey
... 5
2.1.3 Second Storey
... 5
2.2 Lining Materials in Compartments
... 7
2.3 Openings and their States
... 7
2.4 Fuel Load in the Fire Compartment
... 7
2.5 Instrumentation in the Different Compartments and Exterior
... 9
2.5.1 Fire Compartment in Basement
... 9
2.5.2 First Storey
... 10
2.5.3 Second Storey
... 11
2.5.4 Exterior
... 12
2.6 Testing Procedure
... 12
2.7 Construction Details of the Floor Assembly
... 13
2.7.1 Floor Assembly with Metal-Plate-Connected Wood Trusses
... 13
2.8 Instrumentation of the Floor Assembly
... 18
2.8.1 Temperatures in the Floor Assembly
... 18
2.8.2 Flame Penetration of the Floor Assembly
... 20
2.8.3 Deflection of the Floor Assembly
... 21
2.9 Loading of the Floor Assembly
... 21
3 RESULTS OF THE TEST
... 23
3.1 Recording of Results
... 23
3.2 Observations and Recordings
... 23
3.3 Time-temperature Curves at Different Locations
... 23
3.3.1 Temperatures in the Compartments
... 23
3.3.2 Temperatures at the Window in the Basement
... 31
3.3.3 Temperatures on the First Storey at the Top of the Stairs from the Basement
... 31
3.3.4 Temperatures on the Second Storey at the Top of the Stairs
... 32
3.3.5 Temperatures at the Outside Doorway on the First Storey
... 32
3.3.6 Temperatures First Storey on the Unexposed Side of the Floor Assembly
... 34
3.3.7 Temperatures on the Exposed Side of the Floor Assembly
... 36
3.5 Flame Penetration Results
... 47
3.5.1 For Test UF-05
... 47
3.6 Detection Times
... 48
3.7 Results of Smoke and Gas Measurements and Tenability Analysis
... 49
3.7.1 Exposure to Toxic Gases
... 51
3.7.2
Exposure to Heat... 57
3.7.3
Visual Obscuration by Smoke ... 58
3.7.4
Summary of Estimation of Time to Incapacitation... 61
3.8 The Sequence of Events
... 67
4 SUMMARY
... 68
5 ACKNOWLEDGMENTS
... 68
LIST OF FIGURES
Figure 1. Possible chronological sequence of events affecting the life safety of
occupants in a fire situation... 2
Figure 2. Three-storey facility... 4
Figure 3. Basement level layout... 5
Figure 4. First storey layout... 6
Figure 5. Second storey layout ... 6
Figure 6. Fuel package ... 8
Figure 7. Arrangement of the fuel package in the fire compartment ... 9
Figure 8. Fire Compartment instrumentation ... 10
Figure 9. First storey instrumentation... 11
Figure 10. Second storey instrumentation ... 12
Figure 11. Metal-plate wood truss layout details... 14
Figure 12. End connection details and supports ... 15
Figure 13. Subfloor layout details... 16
Figure 14. Subfloor screw pattern and screw description ... 17
Figure 15. Thermocouples locations ... 18
Figure 16. Thermocouples locations reflecting the different sections shown in Figure 15 ... 19
Figure 17. Wire mesh device to detect flame penetration... 20
Figure 18. Loading blocks and locations of the deflection measurement points on the unexposed side of the floor ... 21
Figure 19. Device to hold the loading blocks ... 22
Figure 20. TC Trees in the basement for UF-05 ... 26
Figure 21. TC trees in the first storey for UF-05... 28
Figure 22. TC trees in the second storey bedrooms for UF-05... 30
Figure 23. Temperatures at the window in the basement for UF-05... 31
Figure 24. Temperatures on the first storey at the top of the stairs from the basement for UF-05 ... 32
Figure 25. Temperatures on the second storey at the stairs for UF-05 ... 33
Figure 26. Temperatures at the outside doorway on the first storey for UF-05... 33
Figure 27. Temperatures at the unexposed side of subfloor for UF-05 ... 35
Figure 28. Temperatures at the exposed side for UF-05 ... 44
Figure 29. Deflection points measured ... 45
Figure 30. Deflection measurements for rows 1, 2 and 3 for UF-05 ... 47
Figure 31. Results of flame sensors at different joints ... 48
Figure 32. CO measurements for Test UF-05... 63
Figure 33. O2 measurements for Test UF-05 ... 64
Figure 34. CO2 measurements for Test UF-05 ... 64
Figure 35. Optical density measurements for Test UF-05 ... 65
Figure 36. Time remaining to incapacitation versus onset of exposure for Test UF-05 ... 66
LIST OF TABLES
Table 1. Reserve Live Load Capacity ... 22
Table 2. Smoke Alarm Activation Times after Ignition ... 49
Table 3. Maximum CO and CO2 Concentrations and Minimum O2 Concentration ... 51
Table 4. Tenability Limits for Incapacitation or Death after 5-min Exposure... 52
Table 5. Time to Specified FED for Exposure to O2 Vitiation, CO2 and CO ... 55
Table 6. FED due to CO, CO2, O2 Vitiation at Specified Time ... 56
Table 7. Time to the Specified FED for Exposure to Convected Heat ... 58
Table 8. Time to the Specified Smoke Optical Density ... 61
Table 9. Summary of Estimation of Time to Specified FED and OD... 62
ABSTRACT
This report documents part of the research project involving a series of full-scale fire experiments in a test facility that simulated a two-storey single-family house with a severe, fast growing fire originating in an unfinished basement to study the fire performance of the floor/ceiling assembly constructed over the basement. The report presents the results and analysis of Test UF-05 carried out in the test house with an unprotected metal-plate wood truss floor/ceiling assembly above the basement with an open basement doorway (no door in the doorway leading from the first storey to the basement). A number of measurements were taken at various locations during the test such as temperatures, smoke alarm activation times, smoke optical density, floor deflection and concentrations of CO, CO2 and O2. For this test, untenable conditions on
FIRE PERFORMANCE OF HOUSES PHASE I
STUDY OF UNPROTECTED FLOOR ASSEMBLIES IN BASEMENT FIRE SCENARIOS Part 4 – Results of Test UF-05 (Metal-Plate-Connected Wood Trusses)
J.Z. Su, N. Bénichou, A.C. Bwalya, G.D. Lougheed, B.C. Taber, P. Leroux, A.H. Kashef and J.R. Thomas
1 INTRODUCTION 1.1 Background
Risk of fires in buildings and concerns about their potential consequences are always present. Canada’s fire death rate has continuously declined for the last three decades; much of this decline is attributed to the introduction of residential smoke alarms (this is also the case in the United States). With the advent of new materials and innovative products for use in construction of single-family houses, there is a need to understand what impacts these materials and products will have on occupant life safety under fire conditions and a need to develop a technical basis for the evaluation of their fire performance.
The National Building Code of Canada (NBCC) [1] generally intends that major structural load-bearing elements (floors, walls and roofs) have sufficient fire resistance to limit the probability of premature failure or collapse during the time required for occupants to evacuate safely [2]. Historically, the NBCC has not specified a minimum level of fire performance (fire resistance) of these structural elements in single-family houses. In Canada, the Canadian Construction Materials Centre (CCMC) is called upon to evaluate the use of new materials and innovative construction products for compliance with the NBCC. Some of the more recent innovative structural products, seeking recognition for use in housing, are made of new composite and non-traditional materials that may have unknown fire behaviour. When evaluating new structural products, part of the CCMC challenge is related to the fact that no guidance or criteria are provided in the NBCC regarding the fire performance of structural systems used in single-family houses. The Canadian Commission on Construction Materials Evaluation (CCCME) guides the operation of CCMC. Through the CCCME, CCMC sought the views of the Canadian Commission on Building and Fire Codes (CCBFC), which guides the development of the NBCC. After review and discussion, both the CCBFC and CCCME agreed that a study on the factors that affect the life safety of occupants of single-family houses should be conducted.
1.2 Goals of the Research
The National Research Council of Canada Institute for Research in Construction (NRC-IRC) undertook research into fires in single-family houses to understand the impact of residential construction products and systems on occupant life safety.
This research project sought to achieve the following goals:
1. To determine the significance of the fire performance of structural materials used in houses to the life safety of occupants.
2. To identify methods of measuring the fire performance of unprotected structural elements used in houses.
3. To measure and establish the fire performance of traditional house construction to facilitate the evaluation of the fire performance of innovative construction products and systems.
1.3 General Research Approach
Figure 1 shows a possible chronological sequence of relevant critical events that might occur in a fire scenario. It is acknowledged that the chronology of the occurrence of events may differ, and in some cases can shift in ordering.
Figure 1. Possible chronological sequence of events affecting the life safety of occupants in a fire situation
The research sought to establish, through experimental studies and using specific fire test scenarios, the typical sequence of the following events (measured from initiation of a fire), using a test facility intended to represent a typical code-compliant single-family house:
1. Sounding of smoke alarms (Event 1 as shown in Figure 1).
2. Loss of tenability within the environment of the first, second or subsequent storey(s) (Event 3).
3. Loss of integrity of the floor assembly and/or loss of its function as a viable egress route on the first or second storey(s)1 (Event 4).
The research also sought to establish a basis for prediction or estimation of the required safe egress times expected for ambulatory occupants assuming a tenable indoor environment and a structurally sound evacuation route. A review of the literature on the waking effectiveness of occupants to smoke alarms, the delay time to start evacuation and the timing of escape in single-family houses was conducted. The objective of the review was to identify a range of estimated times families would take to awake, prepare and move out of their home after perceiving the sound of a smoke alarm during the night in winter conditions (Event 2 shown in Figure 1). This literature review was a separate but parallel study to the experimental studies. The results of the literature review are provided in Reference [3].
1.4 Scope of the Research Projects
The overall research consisted of a number of phases of experimental studies with each phase investigating a specified structural element based on specified fire scenarios. Phase 1 (2004 to 2007) of the experimental study focused on basement fires and their impacts on the structural integrity of unprotected floor assemblies above a basement and the tenability conditions in a full-scale test facility. It is acknowledged that, a basement is not the most frequent site of household fires but it is the fire location that is most likely to create the greatest challenge to the structural integrity of the 1st storey structure, which typically provides the main egress routes. The study of fires originating in basements also provides a good model for the migration of combustion products throughout the house and its egress paths. The data collected during this phase of the project provided important indicators for identifying and evaluating the sequence for the occurrence of critical events shown in Figure 1.
This research focused on the life safety of occupants in single-family houses. The safety of emergency responders in a fire originating in single-family houses was not within the scope of this research project. Technical data collected during this research could aid in clarifying the potential risks associated with firefighting activities.
1.5 Content of this Document
This report documents the results of the initial phase of work involving an experimental study of the structural fire performance of the floor/ceiling assembly (1st floor) constructed over the basement level of a test house. Specifically, this report contains the data and analysis of Test UF-05 of the Phase I study carried out in the test house with an unprotected metal-plate wood truss floor/ceilingassembly. This includes results on the fire scenarios, tenability, structural integrity, and the sequence of Events 1, 3 and 4, as illustrated in Figure 1.
the state of the egress route on the second storey is relevant to the evaluation of the performance of the above-grade wall structures and floor structure over the first storey.
2 EXPERIMENTAL STUDY
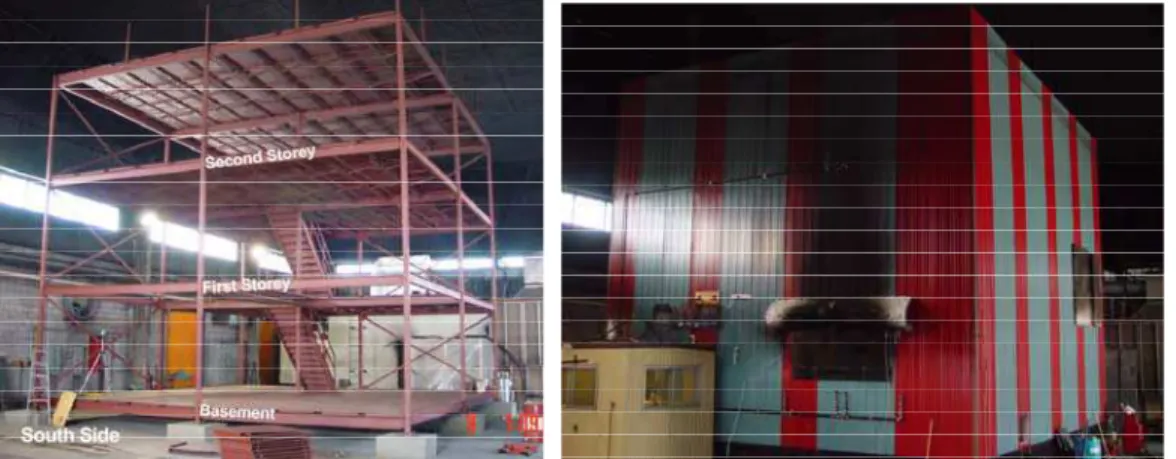
To undertake this research, NRC-IRC constructed a three-level experimental facility, representing a typical two-storey detached single-family house with a basement. The facility allows the study of structural fire performance, as well as smoke movement and tenability under fire conditions for single-family houses. The facility has a total floor area of approximately 95 m2 per storey and is shown in Figure 2.
Figure 2. Three-storey facility
2.1 Geometry - Compartments in the Facility
2.1.1 Fire Compartment in Basement
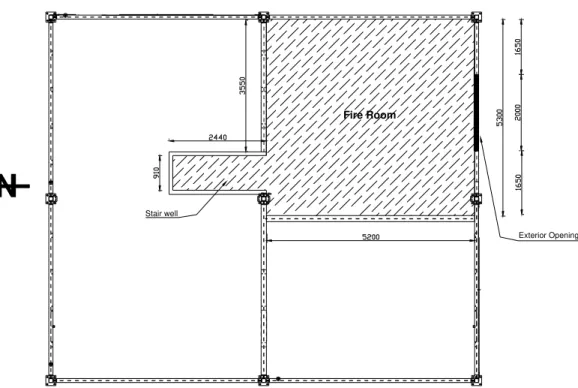
The layout of the basement is shown in Figure 3. The basement was partitioned to create a fire room representing a 27.6 m2 basement living area, or about 1/4 of the total basement area. This compartment size was chosen based on a survey carried out by NRC [4]. The area of the basement that was not used for the fire compartment was blocked off during the fire tests. The height of the basement was 2.44 m. The ceiling clear height depended on the depth of the floor assembly being tested. A rectangular exterior opening measuring 2.0 m wide by 0.5 m high and located 1.8 m above the floor was provided in the south wall of the fire room. The size of the opening was chosen based on the results of the survey carried out by NRC [4]. A 0.91 m wide by 2.05 m high doorway opening located on the north wall of the fire room led into an empty stairwell enclosure (without a staircase). At the top of this stairwell, a 0.81 m wide by 2.05 m high doorway led into the first storey, as shown in Figure 4. This doorway either had no door (open basement doorway) or had a door in the closed position (closed basement doorway), depending on the scenario being studied. There is no requirement for a basement door in the NBCC. Section on “Openings and their States” provides more details.
Fire Room
Stair well
Exterior Opening
N
Figure 3. Basement level layout (dimensions in mm)
2.1.2 First Storey
The first storey had an open-plan layout with no partitions, as shown in Figure 4. A test floor assembly was constructed on the first storey directly above the fire room for each experiment. The remainder of the floor on the first storey was constructed out of non-combustible materials. The height of the storey was about 2.44 m. As shown in Figure 4, this storey had 2 door openings: a door opening to the outside (dimensions of 0.89 m by 2.07 m) and a door opening that connected the basement to the first storey (dimensions of 0.81 m by 2.05 m). This storey also connected to the 2nd storey by a staircase in the middle of the storey area. This staircase to the second storey was not enclosed. The floor being tested was positioned in the southeast quarter of the first storey, on top of the fire compartment.
2.1.3 Second Storey
The layout of the second storey is shown in Figure 5. This storey was partitioned to contain two identical bedrooms with dimensions of 3.75 m by 4.47 m connected by a corridor with dimensions of 1.1 m x 4.45 m. The height of the storey was 2.44 m. In all tests, the door of the southeast bedroom remained closed whereas the door on the southwest bedroom was kept open. The size of the door openings was 0.81 m by 2.05 m. The remaining area of the second storey that was not used was blocked off during the fire test.
Stair well door 810 x 2050 Exterior door 890 x 2070
UP
DOWN
Figure 4. First storey layout(dimensions in mm)
South East Bedroom 4470 X 3750 Co rr id o r 4 4 5 0 X 1 1 0 0
South West Bedroom 4470 X 3750
N
2.2 Lining Materials in Compartments
The compartments were lined with different materials. For the basement level, the walls of the fire compartment were lined with 12.7 mm thick regular gypsum board. There was no ceiling finish in the fire compartment, so the floor assembly, including both the framing supports (trusses) and the underside of the subfloor (oriented strand board, OSB), was unprotected and exposed. For the first and second storeys, cement board covered the walls, and the ceilings were covered with 12.7-mm thick regular gypsum board. There was no finished floor in the 1st storey, so the upper surface of the OSB subfloor used on the floor assembly being tested was exposed. In the remainder of the compartment on the first storey, the floor was noncombustible. The OSB that was used for the subfloor was chosen on the basis of a study on the performance of different OSBs when exposed to fire [5].
2.3 Openings and their States
The openings included: on the basement level, a rough window opening; on the first storey, a door opening to the outside and a door opening at the top of the empty stairwell enclosure (contained no stairs) leading from the basement level; on the second storey, a door opening in the corridor at the top of the stairs leading from the first storey and door openings from the corridor leading to each of the two bedrooms. The size of all the doorways were typical of those used in housing. The single window opening in the basement (2.0 m x 0.5 m) represents an area equal to the size of two typical basement windows.
The doors on the door openings were inexpensive moulded-fibreboard hollow-core interior doors with minimum size styles and rails or solid-core exterior wood doors. The rough window opening in the basement level was covered with a noncombustible panel that could open at the appropriate time in each fire test.
At the start of a test, the rough window opening in the basement and the exterior door on the first storey leading to the outside were closed. Both were opened at critical times during a test (see Section 2.6 Testing Procedure). The doorway on the first storey leading to the basement had no door (open basement doorway) in Test UF-05. On the second storey, during the test, the door to the southwest bedroom was open, and the door to the southeast bedroom was closed.
There was no heating, ventilating and air-conditioning or plumbing system installed in the test house, i.e., no associated mechanical openings in the floor.
2.4 Fuel Load in the Fire Compartment
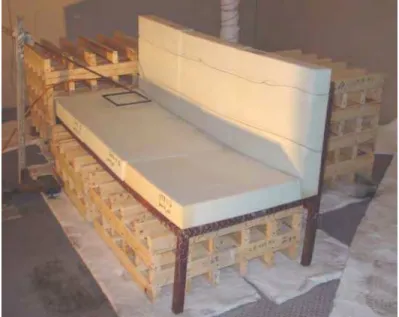
The selection of the fuel load and its arrangement in the fire compartment was a critical element in this experimental work. A study was conducted to select the fire scenario and fuel package, which was used in this phase of the project [6]. This fuel package consisted of a mock-up sofa constructed with 9 kg of exposed polyurethane foam (PUF),
the dominant combustible constituent of upholstered furniture, and 190 kg of wood cribs beside and underneath the mock-up sofa. A photograph of the fuel package is shown in Figure 6. The mock-up sofa was constructed with 6 blocks of flexible polyurethane foam (with a density of 32.8 kg/m3) placed on a metal frame. Each block was 610 mm long by 610 mm wide and 100 mm or 150 mm thick. The 150-mm thick foam blocks were used for the backrest and the 100 mm thick foam blocks for the seat cushion. The PUF foam was used without any upholstery fabric that is used in typical upholstered furniture. The wood cribs were made with spruce lumber pieces, each piece measuring 38 mm x 89 mm x 800 mm. For the small cribs located under the mock-up sofa, four layers with six pieces per layer were used. The other two cribs used eight layers.
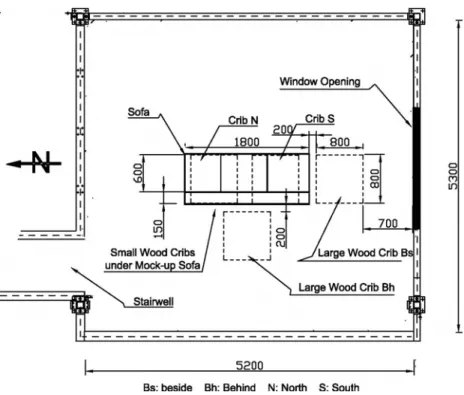
The placement of the fuel package in the basement fire compartment is illustrated in Figure 7. The mock-up sofa was located at the center of the floor area. The mock-up sofa was ignited in accordance with the ASTM 1537 test protocol [7] and the wood cribs provided the remaining fire load to sustain the fire for the desired period of time.
Figure 7. Arrangement of the fuel package in the fire compartment
(dimensions in mm)
2.5 Instrumentation in the Different Compartments and Exterior
The following is a summary of the instrumentation installed inside and around the exterior of the test facility.
2.5.1 Fire Compartment in Basement
The instrumentation in the basement fire room included the following:
• Four vertical arrays of thermocouples located at the quarter points of the fire room to measure temperatures at heights of 0.4, 0.9, 1.4, 1.9 and 2.4 m above the floor level. • Thermocouples located at the basement exterior opening (window) to measure the temperature at the simulated window and the temperature of the gas plume after the mock-window was opened.
• A residential photoelectric smoke alarm located near the stairwell. • Air velocity measurements at the basement exterior opening (window).
• Differential pressure measurement between the fire compartment and the exterior of the test facility, located 2.0 m above the floor.
• Video recording of the burning fuel package.
• Thermocouples measuring temperatures in the wood cribs.
The positioning of the instrumentation in the fire compartment on the basement is shown in Figure 8.
Thermocouples CO / CO2 / O2 Smoke Alarms Air Velocity Pressure Video Legend
Figure 8. Fire Compartment instrumentation
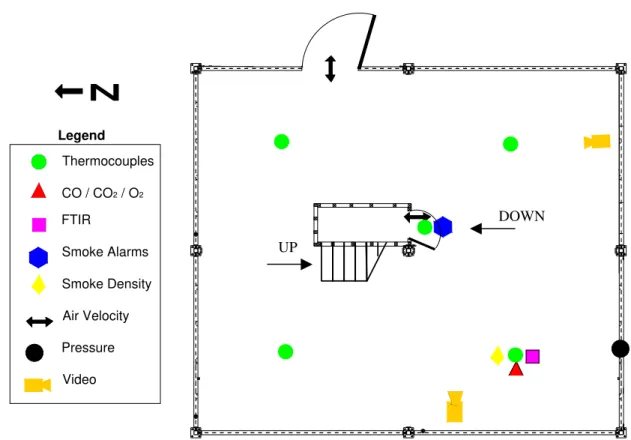
2.5.2 First Storey
The instrumentation on the first storey included the following:
• Four vertical thermocouple arrays at the quarter points of the whole floor area.
• One vertical thermocouple array located at the door opening of the stairwell from the basement level.
• Gas sampling ports at the southwest quarter point, including: • CO/CO2/O2 at 0.9 m and 1.5 m above the floor.
• Fourier Transform Infrared Spectroscopy (FTIR) at 1.5 m above the floor.
• Smoke density measurements at the southwest quarter point at 0.9 m and 1.5 m above the floor.
• Residential ionization and photoelectric smoke alarms located on the ceiling near the doorway to the basement.
• Air velocity measurements located at top of the basement stairwell at ceiling height and at 1.5 m above the floor.
• Differential pressure measurement between the fire compartment in the basement level and the first storey.
• Video recording from two locations.
Legend Thermocouples CO / CO2 / O2 FTIR Smoke Alarms Smoke Density Air Velocity Pressure Video DOWN UP
Figure 9. First storey instrumentation
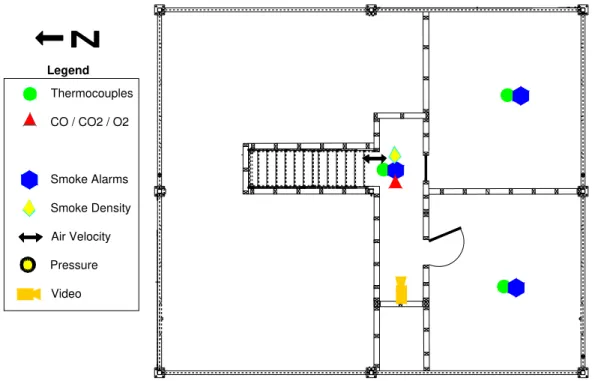
2.5.3 Second Storey
The instrumentation on the second storey included the following:
• One vertical thermocouple array in the corridor at the top of the stairs. • One vertical thermocouple array in the center of each bedroom.
• Residential ionization and photoelectric smoke alarms located on the ceiling in the corridor at the top of the stairs.
• Residential ionization and photoelectric smoke alarms located on the ceiling at the centre of each bedroom.
• Gas analysis (CO/CO2/O2) in the corridor at the top of the stairs at 0.9 m and 1.5 m
above the floor.
• Smoke density measurements in the corridor at the top of the stairs at 0.9 m and 1.5 m above the floor.
• Air velocity measurements located at the top of the stairs at ceiling height and at 1.5 m above the floor.
• Video recording in the corridor.
Thermocouples CO / CO2 / O2 FTIR Smoke Alarms Smoke Density Air Velocity Pressure Video Legend
Figure 10. Second storey instrumentation
2.5.4 Exterior
Instrumentation of the facility exterior included the following:
• Air velocity measurements located at the basement window opening.
• Air velocity measurements located at the exterior door opening on the first storey. • Video recording of the exterior window opening in the fire compartment on the
basement level and the exterior door opening on the first storey.
2.6 Testing Procedure
The mock-up sofa was ignited in accordance with the ASTM 1537 test protocol [7] and data was collected at 5 s intervals throughout each test.
The non-combustible panel that covered the fire room’s exterior rough window opening during the initial stage of each test was manually removed when the temperature measured at the top-center of the opening reached 300°C. The removal of the panel was to provide ventilation air necessary for combustion.
The exterior door on the first storey was opened at 180 s after ignition and left open, simulating a situation where some occupants, who would have been in the test house, escaped leaving the exterior door open while other occupants may still have been inside the house.
The test was terminated by extinguishing the fires using a manually operated sprinkler system when one of the following occurred (singly or in combination):
• Excessive flame penetration through the floor assembly; • Structure failure of any part of the floor assembly; • Compromise of safety of the test facility.
2.7 Construction Details of the Floor Assembly
Eleven full-scale floor assemblies were tested in this first phase of the project. In each test, the floor assembly was installed in the three-storey test facility to create the ceiling portion over the fire compartment in the basement level. The floor assemblies had no ceiling sheathing attached on the underside, leaving the framing members and the subfloor exposed and unprotected from exposure to the fire from the burning fuel package.
For each type of floor assembly tested, the floor joist/truss spans were either chosen from the appendices of the NBCC or calculated based on the ultimate and serviceability limit states. Therefore, the floor joists/trusses could either span the entire length of the fire compartment space or require an intermediate beam support for shorter spans. When designing the assembly, various aspects were considered including what is typically used for framing and subfloor materials in housing today, consideration of serviceability limit states, typical spacing, typical spans, typical depths, etc. As well, the assembly was loaded at 50% of the specified load in the NBCC (see Section 2.9).
Details on the test assembly (metal-plate wood trusses) are provided below. 2.7.1 Floor Assembly with Metal-Plate-Connected Wood Trusses
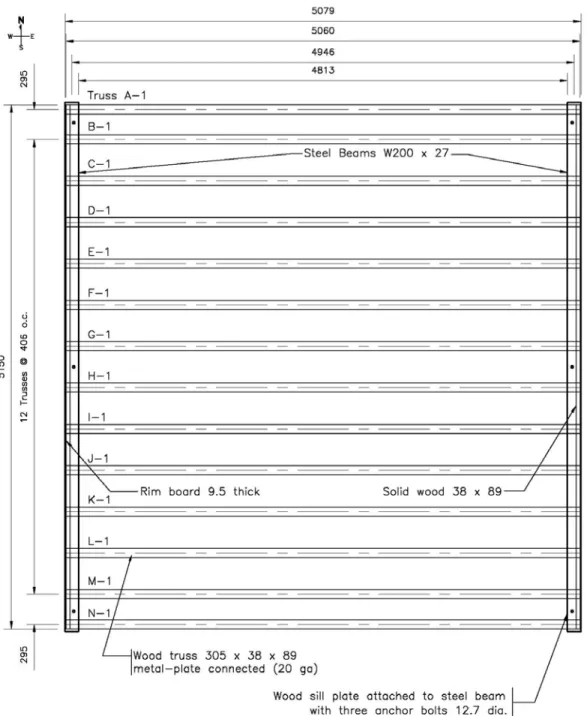
The test, documented in this report, was conducted using a wood frame floor assembly constructed using metal-plate wood trusses and an OSB subfloor. The overall dimension of the wood truss assembly was 5079 mm by 5150 mm. Specific dimensions of the various components of the assembly are provided in Figure 11 to Figure 14.
The wood trusses were 305 mm deep, with members of dimensions 38 mm x 89 mm. The metal plates (20 gauge, 0.92 mm thick) had teeth 9.5 mm long and 0.0124 teeth per square millimeter (8 per square inch). The trusses were spaced at 400 mm on centre (see Figure 11). Based on calculations of maximum strength and deflection, the truss span length chosen was 4.813 m (see Figure 11). This span allowed the wood trusses to extend across the entire length of the fire compartment (with no need for an intermediate support). Figure 12 shows the supporting beams.
Figure 11. Metal-plate wood truss layout details (all dimensions in mm)
The metal-plate wood truss floor assembly was supported by two horizontal beams, each of which was supported by two columns (a total of four columns for the assembly) as illustrated in Figure 12. The beams were bolted to the columns, which were stiffened by bars and rested stably on the floor under the weight of the assembly and beams.
Figure 12. End connection details and supports (all dimensions in mm)
Figure 12 also shows the details of the end connection. Ceramic fibre blankets were used to fill any gaps between the assembly and the end walls. Ceramic fibre blankets were also used to protect the steel beams and columns so that they were not subjected to fire and would not fail during the test.
In the metal-plate wood truss test assembly, rim boards (headers) 9.5 mm thick x 305 mm deep, were placed around the assembly as shown in Figure 11. In addition, a solid wood 38 mm x 89 mm was added at the top ends of the trusses to provide lateral support, see Figure 11 and Figure 12.
OSB was used as the subfloor material in the floor assembly. The specific OSB material used was selected based on a separate study documented in reference [5]. The subfloor panels were 15.1 mm thick in the assembly, with a full panel size being 1.2 x 2.4 m. The longer panel edges had a tongue and groove profile while the short panel edges were square-butt ends. Figure 13 shows the layout of the subfloor. The screw pattern and description of screws used to attach the OSB panels to the wood trusses are shown in Figure 14.
2.8 Instrumentation of the Floor Assembly
2.8.1 Temperatures in the Floor Assembly
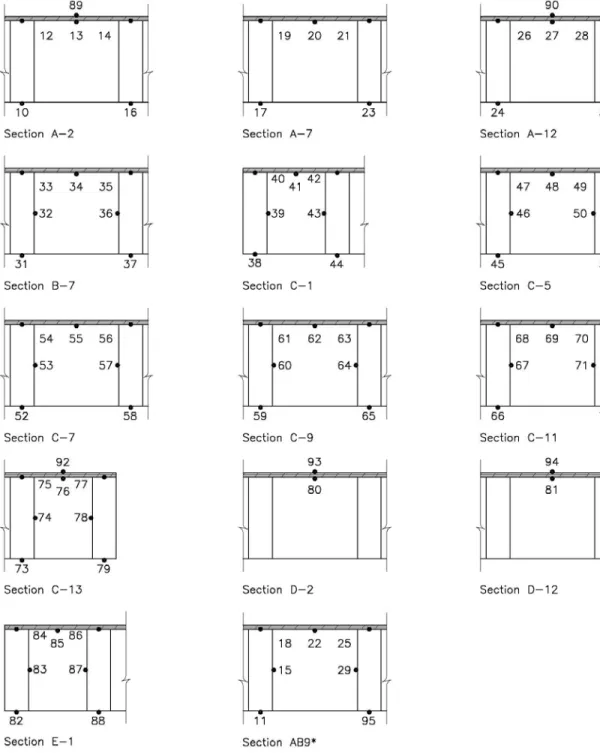
Ninety-four Type K (20 gauge) chromel-alumel thermocouples, with a thickness of 0.91 mm, were used for measuring temperatures at a number of locations throughout the assembly. The thermocouple locations on the unexposed and exposed sides of the assembly are shown in Figure 15 and Figure 16. The locations were chosen to monitor the conditions of the assembly at critical locations during the fire test.
Figure 16. Thermocouples locations reflecting the different sections shown in Figure 15
2.8.2 Flame Penetration of the Floor Assembly
Flame penetration through the floor assembly is considered to be an initial indicator of the impending failure of the assembly. A device was developed and used for the test to better determine the time for flames to penetrate the floor. The special device consisted of a wire mesh placed at 3 locations on the unexposed surface of the floor assembly, specifically at three of the tongue and groove joints, as shown in Figure 17. A detailed description of the device is provided in reference [8].
2.8.3 Deflection of the Floor Assembly
The floor deflection was measured at 9 points. The measurement technique utilized 9 rods that were touching the tops of 9 concrete blocks placed on the unexposed surface of the floor assembly at the locations shown in Figure 18. This ensured that the downward movement of the subfloor was monitored during the fire exposure. The deflections were recorded using the electro-mechanical method described in reference [9].
N
Figure 18. Loading blocks and locations of the deflection measurement points on the unexposed side of the floor
2.9 Loading of the Floor Assembly
The load applied on the floor assemblies was equal to the self-weight (dead load) of the assembly plus an imposed load (live load) of 0.95 kPa (i.e., half of that prescribed by the NBCC [1] for residential occupancies, i.e., half of 1.90 kPa). The rationale to use this combination was based on the fact that in a fire situation, only part of the prescribed load is available. In fact, a number of international standards (Eurocode [10], New Zealand and Australian standards [11 and 12], and ASCE [13])use a load combination similar to the one used in this study for fire design purposes. The total imposed load applied to the floor was equal to 0.95 kPa multiplied by the floor area; this is equivalent to approximately 25 kN.
The loading method consisted of 144 concrete blocks (totalling 2490 kg) distributed uniformly on the floor as shown in Figure 18. The blocks were 190 x 190 x 390 mm (nominal 8" x 8" x 16") and weighed 17.3 kg each. To prevent the blocks from falling into
the basement and causing any damage, a restraining system was designed using a series of pipes attached to beams on both ends, which were secured to the steel frame of the 3-storey house, as shown in Figure 19. The pipes were inserted through the hollow cores of the concrete blocks prior to the fire test. The weight of the pipes was included in the total imposed load.
Figure 19. Device to hold the loading blocks
Calculations of the maximum imposed loads (live load) that the floors were capable of supporting (based on the span used and production of maximum allowable bending stress/deflection, whichever applies, calculated in accordance with CAN/ULC-S101 standard [14]) indicate that the floor had a large strength reserve. The calculated reserves in %, based on comparison of the loading requirement with maximum imposed loads, which govern in this case, are shown in Table 1.
Table 1. Reserve Live Load Capacity
Maximum imposed load (kPa) Test Number Imposed load (kPa) Strength Deflection Reserve of live load capacity (governed by strength) (%) Reserve of live load capacity (governed by deflection) (%) UF-05 0.95 2.77 5.28 66% 82%
3 RESULTS OF THE TEST
3.1 Recording of Results
Compartments and the floor assembly were instrumented with smoke alarms, thermocouples, gas analyzers (CO, CO2 and O2), smoke density instruments, pressure
measurement instruments, and video cameras. The measurements of temperatures, gas concentrations, smoke density, and pressure were recorded at 5-second intervals using a Solotron data acquisition system.
In the following sections, discussions of the different recorded results are carried out. Figures showing various quantities have been organized as follows:
• Figure 20 to Figure 26 show the test results for temperatures vs. time in the compartments, and at different openings (basement window opening, door opening to the basement, door opening to the outside), and at the top of the stairs (between the basement and first storey, and between the first and second storeys).
• Figure 27 shows the test results for temperatures vs. time on the unexposed side of the floor assembly.
• Figure 28 shows the test results for temperatures vs. time on the exposed side of the floor assembly.
• Figure 30 shows the test results for deflection vs. time on the unexposed side of the floor assembly.
• Figure 31 shows the results from the flame-sensing devices.
• Figure 32 to Figure 36 show the smoke and gas measurement results (CO, CO2,
O2 and optical density) and tenability conditions vs. time in the compartments.
• Figure 37 shows the test results for the sequence of fire events in Test UF-05. Although velocity measurements were recorded at various openings during the experiments, they are not discussed in this report. However, these results may be useful for fire modeling purposes in the future.
3.2 Observations and Recordings
Table A 1 shows the test summary for UF-05. This includes a short description of the test, the times for various events, and the detection times for all smoke alarms that operated. The test was stopped after indications of either the structural or load-bearing failure of the floor.
3.3 Time-temperature Curves at Different Locations
3.3.1 Temperatures in the Compartments
In the following sections, the temperatures in the basement, first storey, and second storey are discussed. All thermocouple trees provided measurements at 0.4, 0.9, 1.4, 1.9 and 2.4 m above the floor level. Figure 20 to Figure 22 show these temperatures.
3.3.1.1 Basement
Figure 20 (a, b, c, and d) shows the temperatures in the basement fire compartment at the 4 room quarter points, southeast (SE), southwest (SW), northeast (NE) and northwest (NW), respectively.
The temperatures rose to a maximum of 700 to 800ºC in the first 120 to 140 s. The initial peak temperature was likely due to the high rate of heat release from the mock-up sofa near its peak burning rate. As shown in the figure, the initial temperature rise was faster at the 2.4 m height than the other heights because the hot smoke layer formed first at the ceiling and flames also impinged on the ceiling.
Just after the maximum temperature was reached, there was a slight decrease in temperatures likely due to the combined effect of opening the basement window at 115 s and the fact that a significant portion of the polyurethane foam component of the fuel package had been consumed. The temperatures decreased further after the exterior door on the first storey was opened, which created a movement of air and smoke between the basement and first storey. The fresh air coming from the basement window also increased combustion of the wood cribs and the exposed floor assembly, which caused the temperatures to begin increasing steadily again, reaching maximum temperatures of over 800ºC in most cases.
Finally, the temperatures started decreasing again just after about 470 s when the floor collapsed and the fire was extinguished using sprinklers. It should be noted that the temperatures (due to the mock-up sofa burning) were lower in the case of the NE tree. This may be partially attributed to the fact that the NE corner was less impacted by the fire, as it was farthest away from the fire source and that most of the hot gases were moving to the upper storeys through the SE to NW path.
The combustion was dominated by the mock-up sofa during the first 120 to 140 s, while the wood cribs and floor assembly, including the subfloor, provided the fuel for combustion after this period. The sudden peaks in the time-temperature curves may be due to the ignition of combustible (wood) at different locations of the floor during the fire test.
3.3.1.2 First storey
Figure 21 (a, b, c, and d) shows the temperatures measured at the thermocouple tree locations on the first storey at the 4 compartment quarter points, SE, SW, NE and NW, respectively. The temperatures increased due to the heating of the floor from below and the hot gases and smoke migrating from the basement to the first storey. The temperatures peaked at about 200 to 220 s and started decreasing after this time due to the opening of the exterior door and fresh air coming into the first storey. The highest temperatures were recorded at the SE thermocouple tree because the fire in the basement fire compartment was just underneath this thermocouple tree. Very close to 470 s, there was a sharp increase in temperatures, which was an indication that flame had penetrated through the floor. The temperatures decayed after the extinguishment of the fire.
a) Basement SE quadrant Time (s) 0 100 200 300 400 500 600 700 800 900 T e m per at ur e ( ºC) 0 200 400 600 800 1000 2.4 m 1.9 m 1.4 m 0.9 m 0.4 m b) Basement SW quadrant Time (s) 0 100 200 300 400 500 600 700 800 900 T e m per at ur e ( ºC) 0 200 400 600 800 1000 2.4 m 1.9 m 1.4 m 0.9 m 0.4 m
c) Basement NE quadrant Time (s) 0 100 200 300 400 500 600 700 800 900 T e m per at ur e ( ºC) 0 200 400 600 800 1000 2.4 m 1.9 m 1.4 m 0.9 m 0.4 m d) Basement NW quadrant Time (s) 0 100 200 300 400 500 600 700 800 900 T e m per at ur e ( ºC) 0 200 400 600 800 1000 2.4 m 1.9 m 1.4 m 0.9 m 0.4 m
a) 1st Storey SE quadrant Time (s) 0 100 200 300 400 500 600 700 800 900 T e mp eratu re (º C ) 0 200 400 600 800 1000 2.4 m 1.9 m 1.4 m 0.9 m 0.4 m b) 1st Storey SW quadrant Time (s) 0 100 200 300 400 500 600 700 800 900 T em per atur e ( ºC) 0 200 400 600 800 1000 2.4 m 1.9 m 1.4 m 0.9 m 0.4 m
c) 1st Storey NE quadrant Time (s) 0 100 200 300 400 500 600 700 800 900 T e m per at ur e ( ºC) 0 200 400 600 800 1000 2.4 m 1.9 m 1.4 m 0.9 m 0.4 m d) 1st Storey NW quadrant Time (s) 0 100 200 300 400 500 600 700 800 900 T e m per at ur e ( ºC) 0 200 400 600 800 1000 2.4 m 1.9 m 1.4 m 0.9 m 0.4 m
3.3.1.3 Second storey
Figure 22 (a) and Figure 22 (b) show the temperatures in the SE and SW bedrooms, respectively. The door to the SE bedroom was closed while the door to the SW bedroom was open. Ambient temperature was measured for about the first 220 s for the SE bedroom and 140 s for the SW bedroom.
After these times, the temperatures, at different heights within the rooms, started increasing. This increase was greater for the SW bedroom than the SE bedroom because the door to the SW bedroom was open. Smoke entered the SE bedroom mainly through gaps around the door.
Maximum temperatures of about 50 and 170ºC were reached at the 2.4 m height above the floor level for the SE and SW bedrooms, respectively. For the SW bedroom, the temperatures first peaked around 300 s and subsequently decreased probably due to fresh air coming from the opening of the exterior door on the first storey. The temperatures started increasing again around 470 s due to the intensive burning in the basement.
a) 2nd Storey SE bedroom Time (s) 0 100 200 300 400 500 600 700 800 900 T e m p erature (ºC) 0 20 40 60 80 100 120 140 160 180 200 2.4 m 1.9 m 1.4 m 0.9 m 0.4 m b) 2nd Storey SW bedroom Time (s) 0 100 200 300 400 500 600 700 800 900 T e m p erature (ºC) 0 20 40 60 80 100 120 140 160 180 200 2.4 m 1.9 m 1.4 m 0.9 m 0.4 m
3.3.2 Temperatures at the Window in the Basement
Five thermocouples were located in the basement window opening. Three were located along the vertical centreline of the opening, 125 mm from the bottom, 250 mm from the bottom and 375 mm from the bottom, respectively. The remaining two thermocouples were located 375 mm up from the bottom of the opening and 500 mm in from each side of the opening.
Figure 23 shows the temperatures recorded at the basement window for Test UF-05. The temperatures increased to 600ºC in the first 120 s. The window was opened 115 s after ignition when the temperatures reached 300ºC at the window. After 120 s, due to air entering and smoke exiting the basement window opening, the temperatures scattered, depending on whether or not the flames touched the thermocouples (the bottom TC was probably below the neutral plane).
Time (s) 0 100 200 300 400 500 600 700 800 900 T e m per at ur e ( ºC) 0 200 400 600 800 1000 top, east top, centre top, west mid, entre bottom, centre
Figure 23. Temperatures at the window in the basement for UF-05
3.3.3 Temperatures on the First Storey at the Top of the Stairs from the Basement Figure 24 shows the temperatures at the top of the stairs on the first storey at different heights. The conditions remained at ambient temperature for about the first 60 s. After this, temperatures, at different heights, started increasing due to the migration of hot gases and smoke from the basement to the upper storeys. A maximum temperature of about 760ºC was reached and then there was a decline in temperatures after the exterior door on the first storey was open and fresh air started entering the compartment. The temperatures then remained constant for about 200 s. After this time (460 s), the temperatures started increasing again due to the extensive burning of the wood cribs and flame penetration through the floor. The temperatures started decaying around
500 s after the extinguishment of the fire was initiated. In Figure 24, the maximum temperature was not reached at the 2.4 m level but at the 0.9, 1.4 and 1.9 m levels. This is probably an indication that cooler air was entering into the basement at both the upper level and lower level of the basement doorway.
Time (s) 0 100 200 300 400 500 600 700 800 900 T e m per at ur e ( ºC) 0 200 400 600 800 1000 2.4 m 1.9 m 1.4 m 0.9 m 0.4 m
Figure 24. Temperatures on the first storey at the top of the stairs from the basement for UF-05
3.3.4 Temperatures on the Second Storey at the Top of the Stairs
Figure 25 shows the temperatures at the top of the stairs on the second storey at different heights. The conditions remained at ambient temperature for about the first 120 s. After this time, temperatures started increasing due to the migration of hot gases and smoke from the basement to the upper storeys. A maximum temperature of about 240ºC was reached at the 2.4 m height. The temperatures started decaying around 510 s after the extinguishment of the fire was initiated.
3.3.5 Temperatures at the Outside Doorway on the First Storey
Figure 26 shows the temperatures at the exterior doorway on the first storey. The temperatures were at the ambient value for about the first 110 s. After this time, the temperatures increased reaching 240ºC at 220 s due to smoke and hot fire gases exiting through the open exterior door. The temperature decreased after the first peak. Just after 460 s, there was a sharp increase in temperatures (due probably to flame penetration through the floor producing more radiation and hot gases in the vicinity of the exterior door). The maximum temperature reached was about 440ºC just after 480 s. The temperatures started decaying at 490 s, after the extinguishment of the fire was
Time (s) 0 100 200 300 400 500 600 700 800 900 T empe ratur e ( ºC) 0 200 400 600 800 1000 2.4 m 1.9 m 1.4 m 0.9 m 0.4 m
Figure 25. Temperatures on the second storey at the stairs for UF-05
Time (s) 0 100 200 300 400 500 600 700 800 900 T e m p er a tur e ( ºC) 0 100 200 300 400 500 600
3.3.6 Temperatures First Storey on the Unexposed Side of the Floor Assembly
Figure 27 (a and b) shows the temperatures measured by thermocouples No. 1 to 9 and No. 89 through 94 located on the unexposed side (top) of the OSB subfloor of the floor assembly (see Figure 15 and Figure 16).
For TCs 1 to 9, the temperatures remained at ambient temperature for the first 200 s. After this, the temperatures increased gradually until 470 s; thereafter, the temperatures show a faster rate of increase at all locations. This faster increase in temperature rise was due to the positioning of the thermocouples in the vicinity of the fire. This was also an indication that flames penetrated through the subfloor and the floor was being breached at many locations (close to the end of the test). The maximum temperature reached about 300°C, measured at the time that corresponded to the time when there was a sharp increase in temperatures measured at the thermocouple trees on the first storey (see Figure 21). Subsequently, the temperatures decreased after the extinguishment of the fire. Temperatures measured at locations 89 to 94 show similar trends but different values.
It is worth mentioning that failure under standard fire test conditions [14],on the basis of temperature, is defined as a temperature rise of 140°C above ambient temperature for the average of the nine padded thermocouples or a temperature rise of 180°C above ambient temperature at any single point on the unexposed side.
a) Unexposed TCs under insulated pad on top of subfloor Time (s) 0 100 200 300 400 500 600 700 800 900 T emper a tu re ( ºC) 0 200 400 600 800 1000 Location 1 Location 2 Location 3 Location 4 Location 5 Location 6 Location 7 Location 8 Location 9
b) Bare TCs on the unexposed (top) side of subfloor Time (s) 0 100 200 300 400 500 600 700 800 900 T emp er atur e ( ºC ) 0 200 400 600 800 1000 Location 89 Location 90 Location 91 Location 92 Location 93 Location 94
3.3.7 Temperatures on the Exposed Side of the Floor Assembly
The location of each grouping of thermocouples is identified by the Section label (A, B, C, D, E and AB) and the truss space shown on Figure 15 and Figure 16. For example, C-1 is the group of thermocouples located along Section C in Truss Cavity 1.
For the thermocouple groupings within the truss cavities with seven thermocouples at each section, the individual thermocouples are identified as follows: bottom of north truss (Bot WT North (1)), mid-height of north truss (Mid WT North (2)), between the north truss and the subfloor (SF/WT North (3), on the subfloor mid-distance between the two trusses (SF/Cav (4)), between the south truss and the subfloor (SF/WT South (5), mid-height of south truss (Mid WT South (6)) and bottom of south truss (Bot WT south (7)). For Section A, there are cavities that have only five thermocouple since the locations do not allow for Mid WT North (2) and Mid WT South (6).
The temperatures on the exposed side of the floor assembly were measured at a number of locations distributed in such a way as to learn, as much as possible, the effect of the fire on the floor assembly. As shown in Figure 15 and Figure 16 (Location of Thermocouples), in the locations at Sections B, C, E and AB, seven thermocouples were installed: 2 at the bottom of two adjacent trusses, 2 in the cavity at mid-height of the two trusses, 2 between the subfloor and the two trusses, and 1 in the cavity at the subfloor at mid-distance between the 2 trusses. Section A, five thermocouples were installed: 2 at the bottom of two adjacent trusses, 2 between the subfloor and the two trusses, and 1 in the cavity at the subfloor at mid-distance between the 2 trusses. Section D had only 1 thermocouple in the cavity at the subfloor at mid-distance between the 2 trusses.
3.3.7.1 Test UF-05
Figure 28 (a) to Figure 28 (m) show the temperatures measured by the thermocouples located on the exposed side of the floor. For all the locations with 5 or 7 thermocouples (A-2, A-7, A-12, B-7, C-1, C-5, C-7, C-9, C-11, C-13, E-1, and AB-9), in almost every case the trend was similar with a sharp increase in temperatures for all the exposed thermocouples in the first 120 s to 160 s. For the thermocouples located at the interface between the top of a truss and the subfloor (SF/WT), the temperature rise in most cases was relatively slow and gradual due to the shielding of the thermocouples by the trusses. When the temperatures for SF/WT North (3) and SF/WT South (5) show a temperature increase, which is sudden in some cases, it is an indication that gaps were forming between the top of the trusses and the subfloor at these points and that the thermocouples were being exposed to the hot gases from the fire.
The increase in temperature happened at different times for the different locations. The difference in time between the two SF/WT (North and South) thermocouples is partly due to the view factor relative to the burning fuel package. In some cases, the bulk of the fuel package was 'positioned' South of the thermocouple grouping. Consequently, the thermocouple at top of the North truss experienced a greater heat insult from both the convective and radiative effects from the burning fuel. For the thermocouple groupings with the bulk of the fuel package located to the North, the reverse effect
Of particular mention is Section C-9 where the temperatures at SF/WT North (3) and SF/WT South (5) reached almost the same peak values as the temperatures at the exposed thermocouples in the first 120 s. This is an indication that gaps due to structural movement and charring of the wood at the interface of the trusses and subfloor occurred much earlier at this location than other locations as it was directly above the mock-up sofa and very close to the wood cribs.
For the exposed thermocouples, the highest peak temperature (a value of just over 800ºC) was recorded at sections B-7, C-7 and C-9 (located very close or directly over the burning sofa mock-up and the wood cribs). In most cases, there was a drop in temperature measured by the exposed thermocouples just after about 140 to 180 s, which may be attributed to the fresh air coming from the open basement window and also the opening of the exterior door at 180 s. The decrease in temperature was short and then the temperatures started increasing again.
There were cases where there was no obvious drop in the temperature (C-1 and E-1). This is because these locations were not close to the fuel package and thus had limited radiative impact from the fuel.
For Section D, points D-2 and D-12 have the same trend as the exposed thermocouples in sections A-2 and A-12.
At approximately 460 s, the temperatures at some locations show a slight increase probably because the flames penetrated the floor and allowed more fresh air to enter and slightly more burning to occur in the basement. The temperatures start decaying after the extinguishment of the fire was initiated.
a) Thermocouples in cavity A-2 Time (s) 0 100 200 300 400 500 600 700 800 900 T e m per at ur e ( ºC) 0 200 400 600 800 1000 Bot WT North (1) TC 10 SF/WT North (3) TC 12 SF/Cav (4) TC 13 SF/WT South (5) TC 14 Bot WT South (7) TC 16
b) Thermocouples in cavity A-7
Time (s) 0 100 200 300 400 500 600 700 800 900 T em per at ur e ( ºC) 0 200 400 600 800 1000 Bot WT North (1) TC 17 SF/WT North (3) TC 19 SF/Cav (4) TC 20 SF/WT South (5) TC 21 Bot WT South (7) TC 23
c) Thermocouples in cavity A-12 Time (s) 0 100 200 300 400 500 600 700 800 900 T e m per at ur e ( ºC) 0 200 400 600 800 1000 Bot WT North (1) TC 24 SF/WT North (3) TC 26 SF/Cav (4) TC 27 SF/WT South (5) TC 28 Bot WT South (7) TC 30 d) Thermocouples in cavity B-7 Time (s) 0 100 200 300 400 500 600 700 800 900 T em per at ur e ( ºC) 0 200 400 600 800 1000 Bot WT North (1) TC 31 Mid WT North (2) TC 32 SF/WT North (3) TC 33 SF/Cav (4) TC 34 SF/WT South (5) TC 35 Mid WT South (6) TC 36 Bot WT South (7) TC 37
e) Thermocouples in cavity C-1 Time (s) 0 100 200 300 400 500 600 700 800 900 T e m per at ur e ( ºC) 0 200 400 600 800 1000 Bot WT North (1) TC 38 Mid WT North (2) TC 39 SF/WT North (3) TC 40 SF/Cav (4) TC 41 SF/WT South (5) TC 42 Mid WT South (6) TC 43 Bot WT South (7) TC 44 f) Thermocouples in cavity C-5 Time (s) 0 100 200 300 400 500 600 700 800 900 T em per at ur e ( ºC) 0 200 400 600 800 1000 Bot WT North (1) TC 45 Mid WT North (2) TC 46 SF/WT North (3) TC 47 SF/Cav (4) TC 48 SF/WT South (5) TC 49 Mid WT South (6) TC 50 Bot WT South (7) TC 51
g) Thermocouples in cavity C-7 Time (s) 0 100 200 300 400 500 600 700 800 900 T e m per at ur e ( ºC) 0 200 400 600 800 1000 Bot WT North (1) TC 52 Mid WT North (2) TC 53 SF/WT North (3) TC 54 SF/Cav (4) TC 55 SF/WT South (5) TC 56 Mid WT South (6) TC 57 Bot WT South (7) TC 58 h) Thermocouples in cavity C-9 Time (s) 0 100 200 300 400 500 600 700 800 900 T em per at ur e ( ºC) 0 200 400 600 800 1000 Bot WT North (1) TC 59 Mid WT North (2) TC 60 SF/WT North (3) TC 61 SF/Cav (4) TC 62 SF/WT South (5) TC 63 Mid WT South (6) TC 64 Bot WT South (7) TC 65
i) Thermocouples in cavity C-11 Time (s) 0 100 200 300 400 500 600 700 800 900 T e m per at ur e ( ºC) 0 200 400 600 800 1000 Bot WT North (1) TC 66 Mid WT North (2) TC 67 SF/WT North (3) TC 68 SF/Cav (4) TC 69 SF/WT South (5) TC 70 Mid WT South (6) TC 71 Bot WT South (7) TC 72 j) Thermocouples in cavity C-13 Time (s) 0 100 200 300 400 500 600 700 800 900 T em per at ur e ( ºC) 0 100 200 300 400 500 600 700 800 Bot WT North (1) TC 73 Mid WT North (2) TC 74 SF/WT North (3) TC 75 SF/Cav (4) TC 76 SF/WT South (5) TC 77 Mid WT South (6) TC 78 Bot WT South (7) TC 79
k) Thermocouples in cavity D-2 and D-12 Time (s) 0 100 200 300 400 500 600 700 800 900 T e m per at ur e ( ºC) 0 200 400 600 800 1000 Cavity D-2 TC 80 Cavity D-12 TC 81
l) Thermocouples in cavity E-1
Time (s) 0 100 200 300 400 500 600 700 800 900 T em per at ur e ( ºC) 0 200 400 600 800 1000 Bot WT North (1) TC 82 Mid WT North (2) TC 83 SF/WT North (3) TC 84 SF/Cav (4) TC 85 SF/WT South (5) TC 86 Mid WT South (6) TC 87 Bot WT South (7) TC 88
m) Thermocouples in cavity AB9 Time (s) 0 100 200 300 400 500 600 700 800 900 T e m p er atur e ( ºC) 0 200 400 600 800 1000 Bot WT North (1) TC 11 Mid WT North (2) TC 15 SF/WT North (3) TC 18 SF/Cav (4) TC 22 SF/WT South (5) TC 25 Mid WT South (6) TC 29 Bot WT South (7) TC 95
Figure 28 (m). Temperatures at the exposed side for UF-05
3.4 Deflection Measurements Results and Structural Performance
Figure 29 shows the 9 deflection measurement points (as well as explained previously; see also Figure 11 for the closest truss to the deflection points). The points of measurement were chosen as they were located in the middle of the fire compartment just above the fire load where the impact of the fire on the structural integrity of the floor assembly was anticipated to be the greatest. Some measurement points were aligned with one of the trusses, while the other row was positioned between trusses.
3.4.1 For Test UF-05
Figure 30 (a) shows the deflections measured in the first row (1, 2, and 3). Up to 250 s, the deflections were very small. After this time, the deflections increased at a relatively moderate rate, reaching a total of 100 mm at 400 s for point No. 1, 120 mm at 350 s for point No. 2, and 100 mm after 360 s for point No. 3. After these times, all the deflections were constant, which is an indication that the rods had reached their maximum gauge length and were not touching the concrete blocks. The measured deflections were not the maximum values before floor failure.
Figure 30 (b) shows the deflections measured in the second row (4, 5, and 6). Up to 200 s, the deflections were very small. After this time, the deflections increased at a relatively moderate rate, reaching a total of about 100 mm at 330 s for points 4 and 6, and 120 mm at 330 for point 5. After these times, the deflections were constant for points 4 and 6, which is an indication that the rods had reached their maximum gauge
points were not the maximum values at points 4 and 6 before floor failure. For point number 5, the deflection reached 200 mm at 470 s and then increased sharply indicating that the concrete blocks were moving fast and falling to the basement.
Figure 30 (c) shows the deflections measured in the third row (7, 8, and 9). Up to 200 s, the deflections were very small. After this time, the deflections increased at a relatively moderate rate, reaching a total of 100 mm at 400 s for point No. 7, 120 mm at 380 s for point No. 8, and 130 mm after 380 s for point No. 9. After these times, all the deflections were constant, which is an indication that the rods had reached their maximum gauge length and were not touching the concrete blocks. The measured deflections were not the maximum values before floor failure. In fact the floor failure did not occur until 469 s based on visual observations through the window opening of the fire room.
Second Row ( 6, 5, 4)
a) Floor Deflection, Row 1 Time (s) 0 100 200 300 400 500 600 700 800 900 D e fl ecti o n ( mm) -500 -400 -300 -200 -100 0 #1, NW corner #2, centre north #3, NE corner
b) Floor Deflection, Row 2
Time (s) 0 100 200 300 400 500 600 700 800 900 Def le c tion ( m m ) -500 -400 -300 -200 -100 0 #4, east centre #5, centre #6, west centre
c) Floor Deflection, Row 3 Time (s) 0 100 200 300 400 500 600 700 800 900 Def lec ti on ( m m ) -500 -400 -300 -200 -100 0 #7, SW corner #8, south centre #9, SE corner
Figure 30 (c). Deflection measurements for rows 1, 2 and 3 for UF-05
3.5 Flame Penetration Results
Flame penetration through the floor assembly is one of the important aspects of fire performance that is of interest in this project since this is also a failure criterion in standard fire resistance testing. Flames and combustion products penetrating through the floor can impact on the time available for evacuation. Any opening(s) created by the flames penetrating the subfloor or excessive deflection provide a means for hot fire gases to migrate from the basement fire room to the upper storey(s). As well, the holes would also add to the overall weakening of the subfloor. To determine whether there was flame penetration through the floors, both a flame-sensing device and the time-temperature curves on the unexposed side of the floors were used.
3.5.1 For Test UF-05
Figure 31 shows the results of the flame-sensing devices. Three wire meshes were installed on the top of three joints (East, Centre and West) on the unexposed side of the floor as shown in Figure 17 (instrumentation figure). There was a sudden increase in the voltage output of the flame-sensing device when flames penetrated through the floor and struck the wire meshes. As indicated by Figure 31, heavy flame penetration occurred at the joints at 460 s to 470 s, which is very close to the failure of the assembly.
As shown in Figure 27 (a) (thermocouples 1 to 9 and 89 to 94 on the unexposed side), all locations show an increase in temperatures at about 470 s. This may be an indication that flames penetrated through the floor at this time. This time is also close to the time recorded by the flame-sensing device towards the end of the test. In addition,
Figure 21 shows time-temperature curves at different heights at the middle of different quadrants of the first storey. As illustrated in the figure, there was an increase in temperatures at about 470 s indicating the possibility of flames penetrating to the unexposed side of the floor and hot smoke migrating to the upper storeys.
Limited amount of flames started to penetrate through the centre of the floor assembly at around 240 s likely due to the fact that this was the location experiencing a more aggressive attack by the fire plume from the fuel package located directly beneath it. In addition, the deflection of the floor was expected to be greater at the centre of the floor assembly, causing the joints to open earlier.
Time (s) 0 100 200 300 400 500 600 700 800 900 Vo lt s 0 2 4 6 8 10 East Joint Centre Joint West Joint
Figure 31. Results of flame sensors at different joints
3.6 Detection Times
Residential photoelectric and ionization smoke alarms were installed on the ceiling in each bedroom, second storey corridor, first storey and the basement fire compartment. These smoke alarms were powered by batteries and were not interconnected. The ionization smoke alarm was not installed in the basement fire room in order to avoid dealing with radioactive materials in the cleanup of debris after the fire test. Since photoelectric smoke alarms are generally slower in detecting flaming fires than ionization smoke alarms, using the photoelectric smoke alarm in the basement resulted in a more conservative estimate for the activation time for the fire scenario used in the experiment. New smoke alarms were used in each experiment.
took up to 100 s longer for the smoke alarms in the second storey corridor to activate and up to 230 s longer for the smoke alarms in the closed bedroom to activate. This highlights the importance of having the smoke alarms interconnected to activate simultaneously when one of them detects a fire. Note that the ionization smoke alarm located on the first storey detected the basement fire first at 40 s in Test UF-05 (5 s earlier than the photoelectric smoke alarm located in the basement fire room).
Table 2. Smoke Alarm Activation Times after Ignition (in seconds)
Location Basement Fire room
First storey Second storey corridor SE bedroom (door closed) SW bedroom (door open) Alarm Type P I P I P I P I P UF-05 45 40 65 130 145 245 275 155 165 Notes:
1. See section on instrumentation in compartment (Figure 8 to Figure 10) 2. I: ionization, P: photoelectric, SE: South East, SW: South West
3.7 Results of Smoke and Gas Measurements and Tenability Analysis
Fires produce heat, narcotic and irritant gases, and smoke that obscures vision. The temperature and the production of combustion products depend upon the fire characteristics, enclosure geometry and ventilation. The increased temperature and combustion products can, either individually or collectively, create conditions that are potentially untenable for occupants.
Tenability analysis involves examination of the production of heat and toxic products of combustion during the fire tests. It also involves estimation of the potential exposure of occupants, who would have been in the test house, to heat and toxic smoke and of the potential effects as a result of the exposure. The purpose of tenability analysis is to provide an estimation of the time available for escape — the calculated time interval between the time of ignition and the time after which conditions become untenable for an individual occupant.
There are various endpoints for tenability analysis, such as incapacitation, lethality/fatality, etc. For this project, incapacitation – a state when people lose the physical ability to take effective action to escape from a fire – was chosen as the endpoint for the tenability analysis related to heat and toxic products of combustion. The time available for escape thus calculated is the interval between the time of ignition and the time after which conditions become incapacitating for an individual occupant.
ISO 13571 and the SFPE Handbook of Fire Protection Engineering provide guidance and methodologies for evaluating the time available for occupants to escape from a fire [15, 16]. These methodologies are used in this report to calculate the time available for escape as an input to the hazard analysis for each fire scenario used in the project. The methodologies include a fractional effective dose (FED) approach to quantify the time at which the accumulated exposure to each fire effluent exceeds a specified threshold criterion for incapacitation. This time then is taken to represent the time available for escape relative to the specified threshold.