Publisher’s version / Version de l'éditeur:
Journal of the American Ceramic Society, 90, February 2, pp. 670-672, 2007-02-01
READ THESE TERMS AND CONDITIONS CAREFULLY BEFORE USING THIS WEBSITE.
https://nrc-publications.canada.ca/eng/copyright
Vous avez des questions? Nous pouvons vous aider. Pour communiquer directement avec un auteur, consultez la première page de la revue dans laquelle son article a été publié afin de trouver ses coordonnées. Si vous n’arrivez pas à les repérer, communiquez avec nous à [email protected].
Questions? Contact the NRC Publications Archive team at
[email protected]. If you wish to email the authors directly, please see the first page of the publication for their contact information.
NRC Publications Archive
Archives des publications du CNRC
This publication could be one of several versions: author’s original, accepted manuscript or the publisher’s version. / La version de cette publication peut être l’une des suivantes : la version prépublication de l’auteur, la version acceptée du manuscrit ou la version de l’éditeur.
For the publisher’s version, please access the DOI link below./ Pour consulter la version de l’éditeur, utilisez le lien DOI ci-dessous.
https://doi.org/10.1111/j.1551-2916.2006.01459.x
Access and use of this website and the material on it are subject to the Terms and Conditions set forth at
C-S-H (I) - A Nanostructural model for the removal of water from hydrated cement paste
Alizadeh, R.; Beaudoin, J. J.; Raki, L.
https://publications-cnrc.canada.ca/fra/droits
L’accès à ce site Web et l’utilisation de son contenu sont assujettis aux conditions présentées dans le site
LISEZ CES CONDITIONS ATTENTIVEMENT AVANT D’UTILISER CE SITE WEB.
NRC Publications Record / Notice d'Archives des publications de CNRC:
https://nrc-publications.canada.ca/eng/view/object/?id=f3dfd54f-a296-4cfe-83b8-74a8be8e2e05 https://publications-cnrc.canada.ca/fra/voir/objet/?id=f3dfd54f-a296-4cfe-83b8-74a8be8e2e05
http://irc.nrc-cnrc.gc.ca
C - S - H ( I ) - A n a n o s t r u c t u r a l m o d e l f o r t h e
r e m o v a l o f w a t e r f r o m h y d r a t e d c e m e n t
p a s t e ?
N R C C - 4 8 6 9 5
A l i z a d e h , R . ; B e a u d o i n , J . J . ; R a k i , R .
A v e r s i o n o f t h i s d o c u m e n t i s p u b l i s h e d i n
/ U n e v e r s i o n d e c e d o c u m e n t s e t r o u v e
d a n s : J o u r n a l o f t h e A m e r i c a n C e r a m i c
S o c i e t y , v . 9 0 , n o . 2 , F e b . 2 0 0 7 , p p . 6 7 0
-6 7 2 d o i :
1 0 . 1 1 1 1 / j . 1 5 5 1
-2 9 1 6 . -2 0 0 6 . 0 1 4 5 9 . x
C-S-H (I)- A Nanostructural Model for the Removal of Water from Hydrated Cement Paste?
Rouhollah Alizadeh, J.J. Beaudoin and L. Raki
Institute for Research in Construction, National Research Council, Ottawa, Canada.
Abstract
Helium gas is used as a nanostructural probe to investigate structural changes to
C-S-H (I) due to the removal of interlayer water. Changes to the 002 basal-spacing are
correlated with helium inflow characteristics. Similarities with helium inflow
experiments conducted on hydrated Portland cement and C3S pastes are discussed.
Conclusions are drawn with respect to the viability of considering C-S-H (I) as a physical
model for the drying of Portland cement and C3S pastes.
Introduction
The amorphous nature of the C-S-H product formed from the hydration of ordinary
Portland cement has been a source of difficulty in ascertaining significant details of its
nanostructure. Nanocrystalline regions have recently been identified in cement paste and
the d-spacing of these regions observed for the first time using TEM methods [1].The
descriptors varying from ‘gel-like’ to ‘layer-like’ materials. The former include the
structural models of Powers and Brunauer [2,3] and the latter the models of Feldman,
Daimon, Taylor, Richardson and Jennings [4-8]. Much of the evidence for either type of
model has been obtained through indirect experimental methods.
Feldman and Beaudoin have utilized helium gas as a nanostructural probe to assess the
structural response to moisture loss of Portland and C3S pastes [9-11]. Essentially the
effects of incremental water removal from the hydrate structure on volume change are
systematically and quantitatively followed utilizing helium-inflow measurements to
estimate the volumes of the nanospaces vacated by water. The results obtained using the
helium- inflow technique to study the Portland cement paste system correlate well with
the behavior of a layered material despite its x-ray amorphous character.
Synthetic C-S-H (I) has been studied extensively [12,13]. It has a definite x-ray pattern
with the three strongest peaks at 1.250; 0.304; 0.280 nm [14]. The 002 basal-spacing at
1.250 nm is sensitive to changes in relative humidity and moisture content [15-17].
Experiments were designed to utilize the helium-inflow technique to probe the volume
change sensitivity of the C-S-H (I) nanostructure to moisture change on drying. The
objective of this work was to examine additional evidence for the layered nature of
C-S-H in hydrated Portland cement and C3S pastes. The validity of using C-S-H (I) as a
Experimental
Materials:
C-S-H (I) with a C/S ratio of 1.20 was prepared using stoichiometric amounts of CaO and
amorphous silica mixed at water-solids ratio of about 11.8. The CaO was produced using
precipitated CaCO3 heated at 900˚C for 24h. The CaO was purged with nitrogen gas and
stored in a desiccator until required. The amorphous silica (Cabosil) was heated at 110˚C
to thoroughly dry the material. The reactants for producing C-S-H (I) were placed in a
high density polyethylene (HDPE) bottle that was continuously rotated (16 rpm) for a
period of 1 year. The reaction temperature was 23˚C. The material was then filtered to
remove excess water and freeze-dried under vacuum for 4 days. The resulting product
was placed into an HDPE bottle, purged with nitrogen gas and stored until further use. A
sample of the C-S-H (I) was put aside for immediate characterization using
thermogravimetric analysis (TGA) and X-ray diffraction (XRD) methods.
Characterization of C-S-H (I):
TGA :
The C-S-H (I) sample (35 mg) was placed in a TAQ 600 TGA and heated at a rate of
environment. The thermogravimetric curve (mass loss versus temperature) was
qualitatively and quantitatively similar to that reported for C-S-H gel [6].The mass loss in
the region 400-600˚C was very small for the latter. An even smaller loss was observed for
the C-S-H (I) used in this study suggesting that the residual amount of Ca(OH)2 is small
or negligible. Constitutional water likely contributes to the small mass loss in this region.
X-ray Diffraction:
The x-ray diffraction measurements were performed with a Scintag XDS 2000
diffractometer using CuKα radiation. Characterization of the C-S-H (I) was carried out in
the range 5˚ < 2θ < 60˚ using a continuous scan rate of 2˚/min. A background correction was performed on the XRD pattern. The X-ray pattern indicated the presence of the
primary peaks previously reported for C-S-H (I) [14]. Scans in the range 5˚ < 2θ <15˚ were used to follow changes in the 002 basal-spacing. A step size of 0.03˚ at 5 sec.
intervals was used. C-S-H powder samples were covered by Mylar film in order to
prevent any humidity change during the XRD analysis. The change in the 002
basal-spacing was determined by monitoring the change in the position of the reference peak
(for the 11% RH condition) at 2θ =29.1˚.
C-S-H (I) Compacts:
The C-S-H (I) powders were pressed at 172 MPa to make compacts (nominally 3.20 cm
in diameter x 1 mm thick). Care was taken not to expose the compacts to CO2 during the
process. The compacts (about 15-20g) were used for the helium inflow experiments. The
11% RH. The compacts then were conditioned an additional week at 11% RH prior to the
helium-inflow experiments. The helium pycnometer apparatus and a microbalance were
placed in a glove box under a positive pressure of nitrogen gas.
Helium Comparison Pycnometry and Helium-inflow Experiments:
The apparatus and procedure for helium-inflow measurements are described in detail in
previous papers [9,10]. The technique enables calculation of solid volume using the gas
laws and the ideal gas assumption. Small pores or interlayer spaces which cause a
delayed flow of helium into the sample are, in the first instance, regarded as part of the
solid. The space vacated by interlayer water can then be estimated from considerations of
solid volume change and the total volume of helium gas resulting from this delayed flow.
The helium-inflow versus time curves, starting from the 11%RH condition, were
obtained at each step following the incremental removal of water. Helium was allowed to
flow into the sample for 40 h at 0.20 MPa. The water was removed by vacuum alone and
finally a combination of vacuum and heating at increasing temperatures for different
periods of time. This was done in a separate vacuum vessel and the sample was then
transferred to the helium pycnometer. The heating temperature for most runs did not
exceed 50˚C.
Results and Discussion
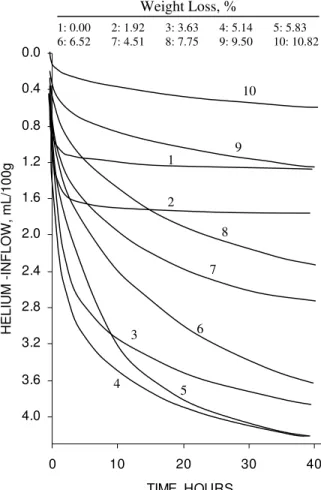
Typical helium-inflow versus time curves for Portland cement paste, w/c=0.40, are
shown in Figure 1, [9]. The starting condition is 11% RH. This condition corresponds to
the presence of about one monolayer of adsorbed water. A ‘knee’ occurs on the
adsorption isotherm at this point. The inflow increases as water is removed incrementally
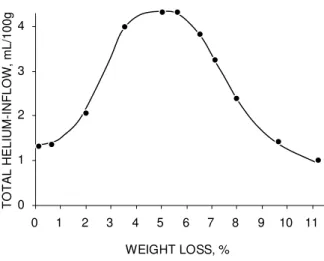
and then begins to decrease at a weight loss of about 5.0%. The total inflow at 40h versus
weight loss is plotted in Figure 2. The curve exhibits a corresponding maximum at 5.0%
weight loss. The changing inflow behaviour is attributed to the removal of interlayer
water. The inflow increase to a maximum is the result of increased interlayer space
becoming accessible to helium without significant structural reorientation of the layers
themselves. The C-S-H nanostructure begins to collapse after a weight loss exceeding
5%. Further collapse occurs as the weight loss increases and the helium-inflow decreases.
The helium inflow curves for hydrated C3S (water/solid=0.50) are qualitatively and
quantitatively similar having a maximum inflow at about 5% weight loss [10].
The above results can not be explained by fixed-wall pore models (e.g. porous vycor
glass). The pores (mean pore size=3 nm) in this system are completely and
instantaneously filled. No time dependent diffusion occurs.
C-S-H (I):
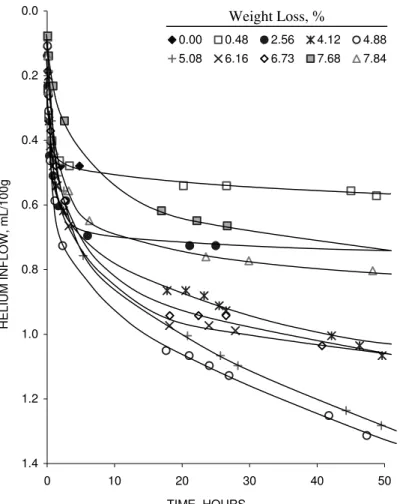
Helium-inflow versus time curves for the C-S-H (I) compacts (C/S=1.20) are presented in
Figure 3. The correspondence between the helium-inflow curves and weight loss is
remarkably similar to that observed for cement paste. This is further illustrated in Figure
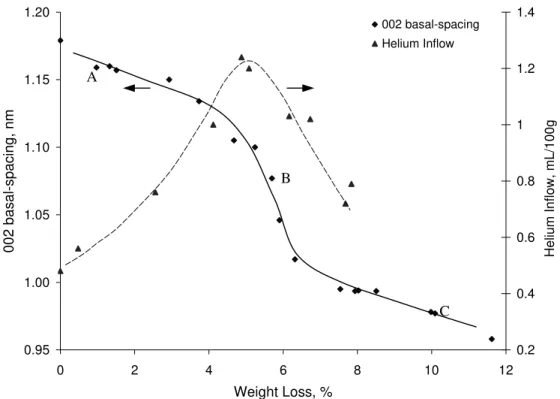
decreases. Changes in the 002 basal-spacing of C-S-H (I) as a function of weight loss
were also determined. The 002 basal-spacing versus weight loss curve (determined from
the 11%RH condition) is also plotted in Figure 4. The curve is divided into 3 regions. A
gradual decrease in the 002 basal-spacing occurs in the first region i.e. 1.175 to 1.120 nm.
A much more rapid decrease in basal-spacing (1.120 to 1.015 nm) occurs in the weight
loss region between 4.5-6.5%. This is followed by a further gradual decrease to about
0.970 nm at 11.5% weight loss. The changes in the 002 basal-spacing with weight loss
parallel the changes in helium- inflow. The beginning of the linear portion of region 2
corresponds to the maximum in the helium-inflow versus weight change curves and the
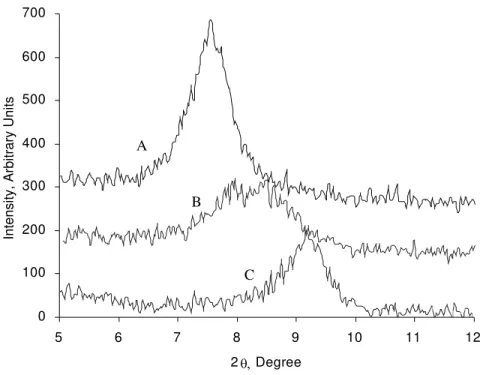
onset of nanostructural collapse. X-ray patterns of C-S-H (I) corresponding to
basal-spacing shifts at points A, B, and C in each region of the curve in Figure 4 are shown in
Figure 5. The peak at point B is much broader and less intense than the peaks for points
A and C. This indicates that the C-S-H (I) nanostructure is more disordered at this weight
loss consistent with a structural collapse process. Additional weight loss (point C)
appears to result in a realignment of the C-S-H (I) sheets. It is apparent that the
correspondence of the structural collapse and helium-inflow characteristics for C-S-H (I)
and the similarities in behavior between C-S-H (I) and hydrated Portland cement and C3S
pastes reinforce the arguments that the C-S-H present in the pastes is layer-like. C-S-H (I)
would appear to be a strong candidate as a nanostructural model for the drying behavior
of hydrated cement paste. The physical response to the removal of water from all these
systems is mechanistically similar.
1. The diffusion of helium gas into the nanospaces of C-S-H (I) vacated during the
incremental removal of water is sensitive to the nanostructural changes that occur
during this process.
2. The changes in the 002 basal-spacing with the removal of water from C-S-H (I)
correlate well with the total helium-inflow. Large changes in basal-spacing and
the onset of collapse of the layered structure correspond to weight losses
exceeding the water content at which the maximum helium- inflow occurs.
3. The diffusion of helium into the nanospaces of hydrated Portland cement and C3S
pastes (due to the incremental removal of water) follows a similar pattern to that
of C-S-H (I).
4. C-S-H (I) would appear to be a viable physical model for the C-S-H present in
Portland cement and C3S paste.
References
[1] X. Zhang, W. Chang, T. Zhang and C. Ong, J. Amer. Cer. Soc., 83 (10),2600-2604,
2000.
[2] T.C. Powers and T.L.Brownyard, Amer. Concr. Inst. Proc., 43, 250-336, Nov.,1946.
[3] S. Brunauer, I. Odler and M. Yudenfreund, Highway Res. Record, No.370, High.
Res. Board., Washington D.C., 89-103,1970.
[4] R.F.Feldman and P. J. Sereda, Materials and Structures, 1(6), 509-520,1986.
60 (3-4), 110-113,1977.
[6] H. F. W. Taylor, J. Amer. Cer. Soc., 69 (6), 464-467,1986.
[7] I. G. Richardson,Cem. Concr. Res., 34 (9),1733-1777, 2004.
[8] H.M.Jennings and P.D.Tennis, J.Amer. Cer. Soc.,77 (12), 3161-3172,1994.
[9] R.F.Feldman, Cem. Concr. Res., 1 (3),285-300,1971.
[10] R.F.Feldman, Cem. Concr. Res.,2 (1), 123-136,1972.
[11] J.J.Beaudoin and P.E.Grattan-Bellew, Cem. Concr. Res.,10 (3), 347-359, 1980.
[12] S.A.Greenberg, J. Phys. Chem.,58,362-367,1954.
[13] P.Faucon,J.M.Delaye, J.Virlet, J.F.Jacquinot and F. Adenot, Cem. Concr. Res.,
27 (10), 1581-1590,1997.
[14] H.F.W. Taylor, Prog. Ceram. Sci., Vol 1, Chapter 3,The Chemistry of Cement
Hydration, 89-145, 1960.
[15] X. Cong and R.J. Kirkpatrick, Cem. Concr. Res., 25 (6), 1237-1245,1995.
[16] R.H.Smith and P. Bayliss, Cem. Concr. Res., 2 (6), 643-646, 1972.
0.0 0.4 0.8 1.2 1.6 2.0 2.4 2.8 3.2 3.6 4.0 0 10 20 30 40 TIME, HOURS HELIUM -INF LOW , mL/100g 1 2 3 4 5 7 6 8 9 Weight Loss, % 1: 0.00 2: 1.92 3: 3.63 4: 5.14 5: 5.83 6: 6.52 7: 4.51 8: 7.75 9: 9.50 10: 10.82 10
Figure 1. Helium-inflow into (0.4 water-cement ratio) cement paste at different water
0 1 2 3 4 0 1 2 3 4 5 6 7 8 9 10 11 WEIGHT LOSS, % TOTA L HE LIUM -INFLOW , m L /100g
Figure 2. Helium-inflow at 40 hr, plotted as a function of weight loss for (0.4
0.0 0.2 0.4 0.6 0.8 1.0 1.2 1.4 0 10 20 30 40 50 TIME, HOURS HELIUM INFLOW, mL/100g . 0.00 0.48 2.56 4.12 4.88 5.08 6.16 6.73 7.68 7.84 Weight Loss, %
0.95 1.00 1.05 1.10 1.15 1.20 0 2 4 6 8 10 12 Weight Loss, % 002 basal-spacing, nm 0.2 0.4 0.6 0.8 1 1.2 1.4 Helium Inflow, mL/100g 002 basal-spacing Helium Inflow C A B
Figure 4. Total helium inflow (40hr) and 002 basal-spacing as a function of weight loss
0 100 200 300 400 500 600 700 5 6 7 8 9 10 11 12 2θ, Degree
Intensity, Arbitrary Units
A
C B
Figure 5. X-ray diffraction patterns for C-S-H (I), C/S=1.20 showing changes in 002
basal –spacing corresponding to the points A, B and C (with different water contents)