HAL Id: hal-02524910
https://hal.archives-ouvertes.fr/hal-02524910
Submitted on 29 Jun 2020
HAL is a multi-disciplinary open access
archive for the deposit and dissemination of
sci-entific research documents, whether they are
pub-lished or not. The documents may come from
teaching and research institutions in France or
abroad, or from public or private research centers.
L’archive ouverte pluridisciplinaire HAL, est
destinée au dépôt et à la diffusion de documents
scientifiques de niveau recherche, publiés ou non,
émanant des établissements d’enseignement et de
recherche français ou étrangers, des laboratoires
publics ou privés.
in the Rhône River prodelta generated by decoupled
aerobic and anaerobic processes
Jens Rassmann, Eryn Eitel, Bruno Lansard, Cécile Cathalot, Christophe
Brandily, Martial Taillefert, Christophe Rabouille
To cite this version:
Jens Rassmann, Eryn Eitel, Bruno Lansard, Cécile Cathalot, Christophe Brandily, et al.. Benthic
alkalinity and dissolved inorganic carbon fluxes in the Rhône River prodelta generated by decoupled
aerobic and anaerobic processes. Biogeosciences, European Geosciences Union, 2020, 17 (1), pp.13-33.
�10.5194/bg-17-13-2020�. �hal-02524910�
https://doi.org/10.5194/bg-17-13-2020
© Author(s) 2020. This work is distributed under the Creative Commons Attribution 4.0 License.
Benthic alkalinity and dissolved inorganic carbon fluxes in the
Rhône River prodelta generated by decoupled aerobic and
anaerobic processes
Jens Rassmann1,*, Eryn M. Eitel2,*, Bruno Lansard1, Cécile Cathalot3, Christophe Brandily3, Martial Taillefert2, and Christophe Rabouille1
1Laboratoire des Sciences du Climat et de l’Environnement, LSCE/IPSL,CEA-CNRS-UVSQ-Université Paris Saclay,
91198 Gif-sur-Yvette, France
2School of Earth and Atmospheric Sciences; Georgia Institute of Technology, Atlanta, 30332-0340 GA, USA 3IFREMER, Laboratoire Environnement Profond, 29280 Plouzané, France
∗These authors contributed equally to this work.
Correspondence: Christophe Rabouille (rabouill@lsce.ipsl.fr) Received: 25 January 2019 – Discussion started: 4 February 2019
Revised: 8 November 2019 – Accepted: 18 November 2019 – Published: 2 January 2020
Abstract. Estuarine regions are generally considered a ma-jor source of atmospheric CO2, as a result of the high organic
carbon (OC) mineralization rates in their water column and sediments. Despite this, the intensity of anaerobic respiration processes in the sediments tempered by the reoxidation of re-duced metabolites near the sediment–water interface controls the flux of benthic alkalinity. This alkalinity may partially buffer metabolic CO2generated by benthic OC respiration in
sediments. Thus, sediments with high anaerobic respiration rates could contribute less to local acidification than previ-ously thought. In this study, a benthic chamber was deployed in the Rhône River prodelta and the adjacent continental shelf (Gulf of Lion, northwestern Mediterranean) in late summer to assess the fluxes of total alkalinity (TA) and dissolved inor-ganic carbon (DIC) from the sediment. Concurrently, in situ O2 and pH micro-profiles, voltammetric profiles and pore
water composition were measured in surface sediments to identify the main biogeochemical processes controlling the net production of alkalinity in these sediments. Benthic TA and DIC fluxes to the water column, ranging between 14 and 74 and 18 and 78 mmol m−2d−1, respectively, were up to 8 times higher than dissolved oxygen uptake (DOU) rates (10.4±0.9 mmol m−2d−1) close to the river mouth, but their intensity decreased offshore, as a result of the decline in OC inputs. In the zone close to the river mouth, pore water redox species indicated that TA and DIC were mainly produced by
microbial sulfate and iron reduction. Despite the complete re-moval of sulfate from pore waters, dissolved sulfide concen-trations were low and significant concenconcen-trations of FeS were found, indicating the precipitation and burial of iron sulfide minerals with an estimated burial flux of 12.5 mmol m−2d−1 near the river mouth. By preventing reduced iron and sulfide reoxidation, the precipitation and burial of iron sulfide in-creases the alkalinity release from the sediments during the spring and summer months. Under these conditions, the sed-iment provides a net source of alkalinity to the bottom waters which mitigates the effect of the benthic DIC flux on the car-bonate chemistry of coastal waters and weakens the partial pressure of CO2increase in the bottom waters that would
oc-cur if only DIC was produced.
1 Introduction
As a link between continental and marine environments, the coastal ocean plays a key role in the global carbon cy-cle (Bauer et al., 2013). In particular, large fluxes of dis-solved and particulate organic carbon (POC) are delivered by rivers to neighboring continental shelves (Bianchi and Allison, 2009). In fact, even though shelf regions only oc-cupy around 7 % of the global ocean surface area (Jahnke, 2010), they account for more than 80 % of POC burial in the
oceans (Hedges and Keil, 1995; Muller-Karger et al., 2005). About half of this POC is buried in river deltas and estuaries (McKee et al., 2004; Burdige, 2005). River-dominated ocean margins receive substantial amounts of allochthonous and authigenic POC that settle to the seafloor (Rabouille et al., 2001; Burdige, 2005; Andersson et al., 2006), thus increas-ing the organic carbon content of the sediments and enhanc-ing mineralization rates (Canfield et al., 1993a; Mckee et al., 2004; Muller-Karger et al., 2005; Aller et al., 2008; Burdige, 2011). These processes allow estuarine and deltaic regions to constitute a net source of CO2to the atmosphere (Chen and
Borges, 2009; Cai, 2011). In these river-dominated margins, high sedimentation rates of material containing large concen-trations of POC decrease the residence time of organic car-bon in the oxic sediment layers (Hartnett et al., 1998) and increase the relative contribution of anaerobic compared to aerobic degradation pathways of organic carbon (Canfield et al., 1993a). Anaerobic respiration processes, including denitrification, dissimilatory nitrate reduction to ammonium (DNRA), manganese reduction, iron reduction and sulfate re-duction produce total alkalinity (TA; Berner, 1970; Dickson, 1981; Wolf-Gladrow et al., 2007, Table 1) that increases the buffer capacity of pore waters (Ben-Yaakov, 1973; Soetaert et al., 2007), drives the calcite and aragonite saturation state of the pore waters towards supersaturation, and potentially trig-gers carbonate mineral precipitation (Gaillard et al., 1989; Mucci et al., 2000; Jørgensen and Kasten, 2006; Soetaert et al., 2007; Burdige, 2011). In turn, the precipitation of car-bonate species, such as calcite and aragonite, consumes al-kalinity within the sediments (Table 1, Reaction R1; Berner, 1970; Soetaert et al., 2007; Krumins et al., 2013; Brenner et al., 2016). Anaerobically produced alkalinity may also be consumed close to the sediment–water interface (SWI) by the aerobic reoxidation of reduced species such as NH+4, Mn2+, Fe2+ and dissolved sulfide (Table 1, Reactions R2– R4; Jourabchi et al., 2005; Krumins et al., 2013; Brenner et al., 2016). However, the precipitation and ultimate burial of iron sulfide minerals may prevent reoxidation of dissolved sulfide and Fe2+ and significantly reduce alkalinity con-sumption in sediments. Other processes such as carbonate dissolution in surface sediments or denitrification from ex-ternal sources of nitrate may also be sources of TA (Hu and Cai, 2011a). Thus, the net TA flux across the SWI depends on the type and intensity of anaerobic respiration, carbonate precipitation and dissolution, denitrification, and whether re-duced species are reoxidized by dissolved oxygen after diffu-sion upwards or are trapped in anaerobic sediment layers by precipitation (Krumins et al., 2013; Łukawska-Matuszewska and Graca, 2018). The net flux of this anaerobically produced alkalinity also depends on its depth of production in the sed-iment and sedsed-imentation rates. In river-dominated margins, episodic floods can deposit several centimeters of new sedi-ment during a short period (days to weeks) (Cathalot et al., 2010). In these conditions, the net flux of alkalinity from the sediment depends on the net balance of alkalinity production
and consumption rates in the sediment and the intensity of upward alkalinity transport. As dissolved inorganic carbon (DIC) is also produced by aerobic and anaerobic reactions, the net alkalinity flux across the SWI directly affects the par-tial pressure of CO2 (pCO2) in bottom waters (Andersson
and Mackenzie, 2012).
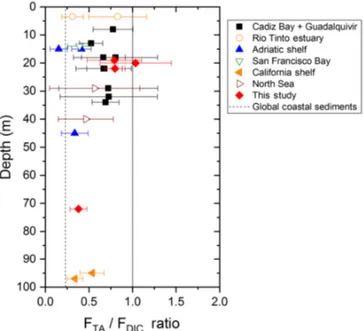
To characterize the biogeochemical conditions in which sediments provide an alkalinity source to coastal waters, it is crucial to relate this reaction network to net benthic fluxes of alkalinity and DIC measured in situ. A high ratio of benthic TA to DIC fluxes (> 1) would increase the buffer capacity of the bottom waters and influence the coastal carbon cycle by increasing the storage capacity of CO2in coastal waters over
long timescales (Thomas et al., 2009; Andersson et al., 2006; Brenner et al., 2016). The objectives of this study were to de-termine the magnitude of the alkalinity flux to the bottom wa-ters from deltaic region sediments exposed to large riverine inputs of carbon and minerals and to identify the underlying biogeochemical processes responsible for the net production of alkalinity in these sediments. This study is one of the first to simultaneously quantify the spatial distribution of benthic TA and DIC fluxes, dissolved oxygen uptake (DOU) rates, burial fluxes of reduced substances, and the main biogeo-chemical processes involved in organic carbon mineraliza-tion in sediments. These processes were investigated along a gradient of organic carbon and mineral inputs to the seafloor in the Rhône River delta (France) before the usual flood sea-son in late summer.
2 Study site and methods 2.1 The Rhône River delta
The Rhône River subaqueous delta, also called prodelta due to its prograding characteristics, is a wave-dominated delta located in the Gulf of Lion (France), a microtidal continen-tal margin. The Rhône River is the main source of freshwa-ter, suspended matter (including iron oxides) and POC to the Mediterranean Sea (Sempéré et al., 2000). The river plume is generally oriented southwestward due to the combined ef-fects of wind forcing and the Coriolis effect (Estournel et al., 1997). The Great Rhône River mouth is characterized by a prodeltaic lobe (Got and Aloisi, 1990) that can be divided into three main areas based on bathymetry and sedimentation rates (Got and Aloisi, 1990): the proximal domain within a 2 km radius of the river outlet, with water depths between 10 and 30 m and mean apparent accumulation rates of up to 30–40 cm yr−1 (Charmasson et al., 1988); the prodelta do-main between 2 and 5 km, with water depths ranging from 30 to 70 m and sedimentation rates of 1–4 cm yr−1(Miralles et al., 2005); and the distal domain further offshore, with wa-ter depths greawa-ter than 70 m and accumulation rates of 0.1 to 1 cm yr−1(Miralles et al., 2005). In this part of the Gulf of Lion, sediments are fine grained and of a cohesive nature
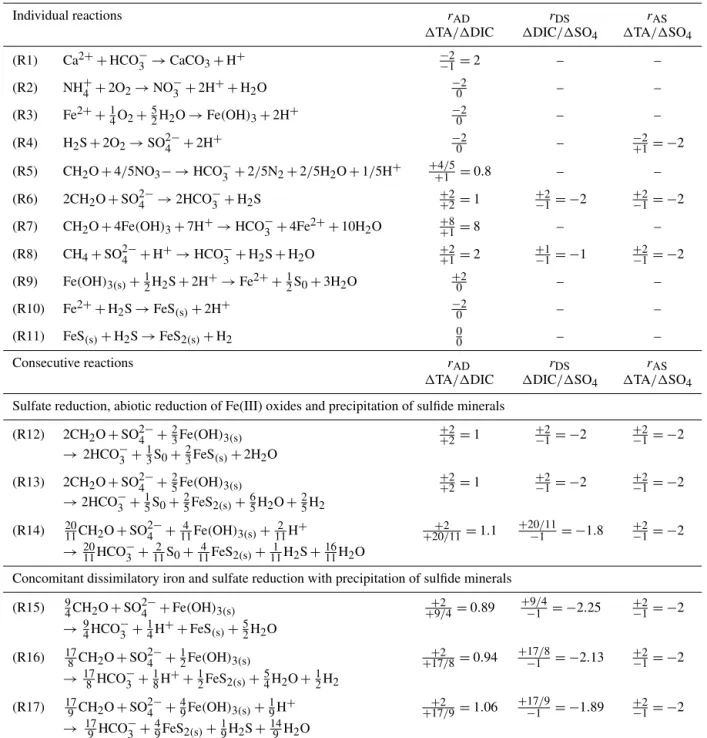
Table 1. Individual and consecutive microbial and abiotic reactions that affect the theoretical 1TA/1DIC (rAD), 1DIC/1 sulfate (rDS)and 1TA/1 sulfate (rAS)stoichiometric ratios. Note that Reactions (R14) and (R17) include oxidation of H2by sulfate reducing bacteria.
Individual reactions rAD rDS rAS
1TA/1DIC 1DIC/1SO4 1TA/1SO4
(R1) Ca2++HCO−3 →CaCO3+H+ −2−1=2 – – (R2) NH+4 +2O2→NO−3 +2H ++ H2O −20 – – (R3) Fe2++1 4O2+ 5 2H2O → Fe(OH)3+2H + −2 0 – – (R4) H2S + 2O2→SO2−4 +2H+ −20 – −2+1= −2 (R5) CH2O + 4/5NO3− →HCO−3 +2/5N2+2/5H2O + 1/5H+ +4/5+1 =0.8 – – (R6) 2CH2O + SO2−4 →2HCO−3 +H2S +2+2=1 +2−1= −2 +2−1= −2
(R7) CH2O + 4Fe(OH)3+7H+→HCO−3 +4Fe2++10H2O +8+1=8 – –
(R8) CH4+SO2−4 +H +→ HCO−3 +H2S + H2O +1+2=2 +1−1= −1 +2−1= −2 (R9) Fe(OH)3(s)+1 2H2S + 2H +→Fe2++1 2S0+3H2O +2 0 – – (R10) Fe2++H2S → FeS(s)+2H+ −20 – – (R11) FeS(s)+H2S → FeS2(s)+H2 00 – – Consecutive reactions rAD rDS rAS
1TA/1DIC 1DIC/1SO4 1TA/1SO4
Sulfate reduction, abiotic reduction of Fe(III) oxides and precipitation of sulfide minerals
(R12) 2CH2O + SO2−4 +23Fe(OH)3(s) +2+2=1 +2−1= −2 +2−1= −2 →2HCO−3 +1 3S0+ 2 3FeS(s)+2H2O (R13) 2CH2O + SO2−4 +2 5Fe(OH)3(s) +2+2=1 +2 −1= −2 +2 −1= −2 →2HCO−3 +1 5S0+25FeS2(s)+65H2O +25H2 (R14) 2011CH2O + SO2−4 + 4 11Fe(OH)3(s)+112H + +2 +20/11=1.1 +20/11 −1 = −1.8 +2 −1= −2 →20 11HCO − 3 + 2 11S0+ 4 11FeS2(s)+ 1 11H2S + 16 11H2O
Concomitant dissimilatory iron and sulfate reduction with precipitation of sulfide minerals
(R15) 94CH2O + SO2−4 +Fe(OH)3(s) +9/4+2 =0.89 +9/4−1 = −2.25 +2−1= −2 →9 4HCO − 3 + 1 4H ++FeS (s)+52H2O (R16) 178CH2O + SO2−4 +12Fe(OH)3(s) +17/8+2 =0.94 +17/8 −1 = −2.13 +2−1= −2 →17 8HCO − 3 + 1 8H ++1 2FeS2(s)+54H2O +12H2 (R17) 179CH2O + SO2−4 +49Fe(OH)3(s)+91H+ +17/9+2 =1.06 +17/9−1 = −1.89 +2−1= −2 → 17 9HCO − 3 + 4 9FeS2(s)+ 1 9H2S + 14 9H2O
(Roussiez et al., 2005; Cathalot et al., 2013). Their total or-ganic carbon content in surface sediments is higher than 2 % close to the river mouth and decreases offshore (Lansard et al., 2008). The sedimentary inorganic carbon content ranges between 28 % and 38 % (Roussiez et al., 2005) and is, to more than 95 %, composed of calcite (Rassmann et al., 2016) originating from the calcareous belt around the Alps. The other 5 % are aragonite and magnesian calcite. The sediments of the three domains are characterized by a strong biogeo-chemical gradient from the Rhône River mouth to the Gulf
of Lion continental slope, leading to large sediment respi-ration rates in the proximal domain that decrease offshore (Lansard et al., 2009; Pastor et al., 2011; Cathalot et al., 2013; Rassmann et al., 2016). These sediments are characterized by strong anaerobic production of TA and DIC (Rassmann et al., 2016), but whether this alkalinity is consumed in the oxic sediment layer or released to the bottom waters has yet to be determined.
Most of the Rhône River particles are deposited in the proximal and prodelta areas during flood events (80 % of the
particles; Maillet et al., 2006; Cathalot et al., 2010; Zebracki et al., 2015), mainly in late fall and early winter, leading to the periodic accumulation of terrestrial organic-rich particles in these sediments (Radakovich et al., 1999; Roussiez et al., 2005). A large proportion of this terrestrial organic matter (> 90 %; Lansard et al., 2009; Cathalot et al., 2013), with occa-sional coarse particles (CPOM, Charles et al., 2014), is min-eralized in the spring and summer. Although data are scarce, metabolites from carbon remineralization processes probably build up progressively during winter and spring (Jens Rass-mann, unpublished data). This temporal evolution yields sim-ilar diagenetic signatures from mid-spring to end of summer, including almost complete sulfate reduction, large concentra-tions of DIC and alkalinity (30–40 mM), 500–800 µM of dis-solved iron, and no disdis-solved sulfide in the pore waters (Rass-mann et al., 2016; Pastor et al., 2011). This pattern was ob-served consistently over several sampling campaigns, includ-ing April 2007 (Pastor et al., 2011), April 2013 (Dumoulin et al., 2018), May 2014 (Rassmann et al., 2016), Septem-ber 2015 (this paper), and May 2018 (Christophe Rabouille, unpublished data). Altogether, the pore water data collected over the years in the Rhône prodelta system are consistent and indicate that biogeochemical processes in the critical proximal zone reach a reproducible state on a yearly basis due to the regularity of flood deposition in late fall and matu-ration of the system in spring and summer. This reproducibil-ity of the spring–summer conditions probably also applies to benthic fluxes.
2.2 Bottom water sampling and analyses
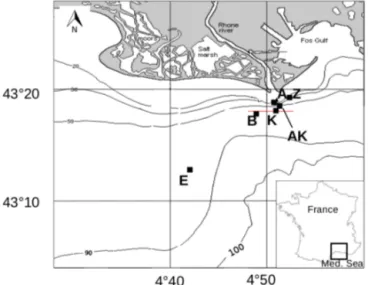
The AMOR-B-Flux cruise took place on-board the RV Tethys II (CNRS-INSU) in September 2015. The inves-tigated stations were located in the river plume along a nearshore–offshore transect (Fig. 1 and Table 2). Bottom wa-ter samples were collected with 12 L Niskin®bottles from 1 to 2 m above the seafloor. The sampling depth was checked with a mounted underwater depth gauge. The seawater tem-perature was measured using a thermometer with a precision of 0.1◦C, and the salinity was measured with a conductivity-based thermosalinometer with a precision of 0.1. Dissolved oxygen concentrations were analyzed by Winkler titration (Grasshoff et al., 1983) within 12 h after sampling with a pre-cision of ±0.5 µM. Triplicate pH measurements were carried out at 25◦C within 1 h after sampling by spectrophotome-try with unpurified m-cresol purple as indicator dye (Clay-ton and Byrne, 1993) and a precision of ±0.01 pH units. The CO2SYS software (Pierrot et al., 2006; Orr et al., 2018) was used with the equilibrium constants from Luecker et al. (2000) and DIC and pH as input parameters to report pH on the total proton scale (pHT) and at in situ temperature and
salinity. As silicate and phosphate concentrations were not measured in the bottom waters, average concentrations for the Gulf of Lion were used. To obtain concentrations as close as possible to the seafloor, overlying water from the sediment
Figure 1. Map of the Rhône River prodelta with the stations inves-tigated during the AMOR-B-Flux cruise in September 2015.
cores was also sampled and analyzed for TA and DIC con-centrations.
2.3 In situ benthic chamber deployments
Benthic fluxes were determined with an autonomous ben-thic lander (Jahnke and Christiansen, 1989). The lander was equipped with a single benthic chamber and water syringe sampling system. The chamber encloses a 30 × 30 cm sed-iment surface area with a volume of overlying water deter-mined by measuring the initial concentration of two trac-ers (iodide and bromide) injected after closure of the cham-ber within 20 min after deployment on the seafloor to en-sure that the chamber and particles eventually resuspended were settled in the sediment. A mechanical stirrer integrated in the chamber lid was run at 10 rpm to homogenize the overlying waters in the chamber without interfering with sediment–water exchange processes (Buchholtz-Ten Brink et al., 1989). TA and DIC samples were collected as a function of time and their concentrations corrected for the dilution that occurred by replacing the sample volume collected by ambi-ent water. The slopes of the concambi-entration–time plots were estimated using the “lm” function in R, a restricted maxi-mum likelihood estimator (REML) that takes uncertainties of individual measurements into account. Finally, benthic fluxes across the SWI (Fi in mmol m−2d−1) were calculated from
the slopes of these concentration–time plots and the chamber height (Eq. 1),
Fi=H ·
dCi
dt , (1)
where H (m) is the overlying water height in the benthic chamber, Cirepresents the concentration of the analyte i (TA
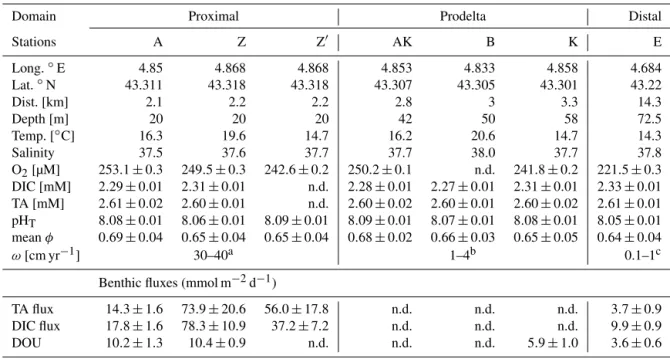
Table 2. Sampling sites during the AMOR-B-Flux cruise in September 2015 and main characteristics of bottom waters: dist. = distance to the Rhône River mouth; ω = sedimentation rate. Station Z was sampled twice (Z on 8 September 2015 and Z0on 14 September 2015) to investigate spatial variability (n.d. = not determined).
Domain Proximal Prodelta Distal
Stations A Z Z0 AK B K E Long.◦E 4.85 4.868 4.868 4.853 4.833 4.858 4.684 Lat.◦N 43.311 43.318 43.318 43.307 43.305 43.301 43.22 Dist. [km] 2.1 2.2 2.2 2.8 3 3.3 14.3 Depth [m] 20 20 20 42 50 58 72.5 Temp. [◦C] 16.3 19.6 14.7 16.2 20.6 14.7 14.3 Salinity 37.5 37.6 37.7 37.7 38.0 37.7 37.8 O2[µM] 253.1 ± 0.3 249.5 ± 0.3 242.6 ± 0.2 250.2 ± 0.1 n.d. 241.8 ± 0.2 221.5 ± 0.3 DIC [mM] 2.29 ± 0.01 2.31 ± 0.01 n.d. 2.28 ± 0.01 2.27 ± 0.01 2.31 ± 0.01 2.33 ± 0.01 TA [mM] 2.61 ± 0.02 2.60 ± 0.01 n.d. 2.60 ± 0.02 2.60 ± 0.01 2.60 ± 0.02 2.61 ± 0.01 pHT 8.08 ± 0.01 8.06 ± 0.01 8.09 ± 0.01 8.09 ± 0.01 8.07 ± 0.01 8.08 ± 0.01 8.05 ± 0.01 mean φ 0.69 ± 0.04 0.65 ± 0.04 0.65 ± 0.04 0.68 ± 0.02 0.66 ± 0.03 0.65 ± 0.05 0.64 ± 0.04 ω[cm yr−1] 30–40a 1–4b 0.1–1c
Benthic fluxes (mmol m−2d−1)
TA flux 14.3 ± 1.6 73.9 ± 20.6 56.0 ± 17.8 n.d. n.d. n.d. 3.7 ± 0.9 DIC flux 17.8 ± 1.6 78.3 ± 10.9 37.2 ± 7.2 n.d. n.d. n.d. 9.9 ± 0.9 DOU 10.2 ± 1.3 10.4 ± 0.9 n.d. n.d. n.d. 5.9 ± 1.0 3.6 ± 0.6
aData from Charmasson et al. (1998).bData from Lansard et al. (2009).cData from Miralles et al. (2005).
2.4 In situ micro-profiling of dissolved oxygen and pH A separate benthic lander, carrying a benthic micro-profiler (Unisense®), was deployed to measure in situ micro-profiles of dissolved oxygen and pH (Cai and Reimers, 1993; Rabouille et al., 2003; Rassmann et al., 2016 and references therein). Up to five oxygen and two pH microelectrodes were simultaneously deployed, and vertical depth profiles were measured with a 200 µm resolution. As their response to vari-ations in oxygen concentrvari-ations is linear, the O2
microelec-trodes (Boudreau and Jorgensen, 2001) were calibrated with a two-point calibration technique using the bottom water O2
concentration determined by Winkler titration and the anoxic pore waters. The pH microelectrodes were calibrated using NBS buffers (pH 4.00, 7.00, and 9.00 at 20◦C) and the spec-trophotometrically determined pH of the bottom waters was used to correct for the difference in the liquid junction poten-tial between seawater and the NBS buffers. Signal drift of O2
and pH microelectrodes during profiling was checked to be less than 5 %.
2.5 Sediment sampling, porosity measurements, and ex situ voltammetric profiling
At each sampling station, six sediment cores (two for pore waters, one for porosity, one for voltammetry, one for methane and one for archives) were collected using an UWITEC®single corer (length 60 cm, inner diameter 9 cm) within 30 m of the site where the landers were deployed and processed within 30 min after collection. Sediment porosity profiles were determined by slicing one of the cores with a 2 mm resolution until 10 mm depth, a 5 mm resolution un-til 60 mm, and a 10 mm resolution down to the bottom of the cores. Porosity was calculated from the bottom water salinity, an average sediment density of 2.5 g cm−3, and the weight difference between the wet and dried sediment after 1 week at 60◦C.
Ex situ voltammetric profiles were obtained in a separate core with an AIS, Inc. DLK-70 potentiostat in a three elec-trode configuration, including an Hg/Au working microelec-trode constructed from Pyrex glass pulled to a tip of 0.4 mm diameter to minimize particle entrainment during the pro-files (Luther et al., 2008), an Ag/AgCl reference electrode, and a platinum counter electrode. The Hg/Au voltammet-ric electrode was deployed in the sediment using a DLK MAN-1 micromanipulator (AIS, Inc). Using a combination of linear sweep and anodic and cathodic square wave voltam-metry, Hg/Au voltammetric microelectrodes are able to si-multaneously quantify dissolved O2, Mn2+, Fe2+, total
which cannot be easily distinguished from reduced sulfide; 6H2S = H2S + HS−+S0+S2−x ), and organic complexes of
Fe(III) (org-Fe(III)) and iron sulfide clusters (FeSaq), which
are not quantifiable but are reported in normalized current intensities (Tercier-Waeber and Taillefert, 2008). Hg/Au mi-croelectrodes were calibrated for dissolved O2using in situ
temperature and salinity of the overlying waters to determine the dissolved O2concentrations at saturation (Luther et al.,
2008). They were also calibrated externally with MnCl2to
quantify all other species according to the pilot ion method (Luther et al., 2008). All voltammetric data were integrated using VOLTINT, a semiautomated Matlab®script with peak recognition software (Bristow and Taillefert, 2008).
2.6 Pore water and solid-phase extractions and analyses
Between 12 and 15 mL of sediment pore waters at each sam-pled depth were extracted from a third sediment core us-ing rhizon filters with a mean pore size of 0.1 µm (Seeberg-Elverfeldt et al., 2005) in a glove bag that was exten-sively flushed with N2 to create an anaerobic atmosphere
(monitored with an O2 sensor and verified with a 2 %
((NH4)2Fe(SO4)2·6H2O) solution). Pore waters were
sub-sampled within 2 h onboard. A sample volume of 1 mL was immediately used for dissolved phosphate analysis using the paramolybdate method (Murphy and Riley, 1962), as well as for dissolved Fe2+ and total dissolved iron analysis us-ing the ferrozine method (Stookey, 1970). Pore water and bottom water fractions were poisoned with HgCl2 for TA and DIC or acidified to pH 1 with ultrapure HCl for sulfate and stored at 4◦C until analysis in the laboratory. Total
al-kalinity was measured on 3–6 mL sample volume by open cell titration with 0.01 M HCl (Dickson et al., 2007). De-pending on the available sample volume, duplicate or tripli-cate titrations were performed. DIC concentrations were ana-lyzed with a DIC analyzer (Apollo/SciTech®) on 1 mL sam-ples, as previously described (Rassmann et al., 2016), and reported as the average and standard deviations of triplicate measurements. The TA and DIC methods were calibrated using certified reference materials for oceanic CO2
mea-surements provided by the Scripps Institution of Oceanogra-phy (batch no. 136). The relative uncertainty for both DIC and TA was ±0.5 % of the final value. Sulfate concentra-tions were quantified on 100 µL sample volumes after di-lution by ion chromatography on an ICS 1000 chromato-graph (Dionex) with an IonPac AS 9 HC column and AG 9 HC guard by suppressed conductivity with an AERS 500 suppressor (ThermoFisher Scientific). A 9 mM solution of Na2CO3, at a flow rate of 1 mL min−1, was used as the
elu-ent. The relative uncertainty of this method was ±1.6 %. To validate a newly developed high-performance liquid chro-matography method (Beckler et al., 2014), pore water frac-tions from a separate core were also frozen at −18◦C for sul-fate analysis back in the laboratory. For this new method, a
Waters, Inc. 1525 binary pump with Waters 2487 absorbance detector at 215 nm was used with a Metrohm Metrosep A Supp 5 anion exchange column (150 mm × 4.0 mm) with a 1.0 mM NaHCO3/3.2 mM Na2CO3 eluent at a flow rate of
0.7 mL min−1(Beckler et al., 2014). To measure ammonium (NH+4) concentrations, 1 mL subsamples were diluted and analyzed using the indophenol blue method (Grasshof et al., 1983). The uncertainty of the method was about 5 %. Pore water fractions of 1 mL volume were also acidified with 2 % HCl for Ca2+ analysis by inductively coupled plasma atomic emission spectroscopy (Ultima 2, Horiba Scientific). The method was validated with mono-elemental standards and standard solutions (IAPSO, CASS-4, and NASS-6 sea-water reference materials) and displayed an external relative uncertainty of ±2 %–3 %, depending on the sample series, and a detection limit of 100 µmol L−1.
Close to the Rhône River mouth, at stations A, Z, and AK, one additional core was subsampled for methane analysis with 1 cm diameter corers made of cut 10 mL syringes in-serted every 5 cm through pre-drilled holes on the side of the core. Due to the technical challenge of sampling non solu-ble methane in pore waters, this sampling could not be car-ried out on the same cores as the other pore water analy-ses. The content of these subsamples was carefully inserted in gas-tight vials containing deionized water and HgCl2 so-lution and kept at 4◦C until methane analysis. Dissolved methane was quantified after degassing of the pore waters into the headspace and quantified by gas chromatography with a relative uncertainty of ±5 % (Sarradin and Caprais, 1996). The position of the sulfate–methane transition zone (SMTZ) was determined as the zone around the depth where [SO2−4 ] = [CH4] (Komada et al., 2016). Finally, acid volatile
sulfur (AVS) for the determination of FeSs was extracted
from the same sediment used for the pore water extractions after slicing into layers of 1 to 5 cm. FeSsmeasurements were
conducted in triplicate by cold acid distillation of H2S(g)
un-der anoxic conditions that was trapped by NaOH and quanti-fied voltammetrically (Henneke et al., 1991).
2.7 Nanoparticulate FeS and ion activity product for FeS precipitation
As a significant fraction of FeS nanoparticles may pass through the rhizon filters (0.1 µm) used to extract pore wa-ters (Nakayama et al., 2016) and the ferrozine method is well known to dissolve FeS nanoparticles (Davison et al., 1998), the difference between spectrophotometrically deter-mined Fe2+ concentrations ([6Fe2+]FR) and electrochemi-cally determined Fe2+concentrations ([Fe2+echem]) in the pore waters was attributed to FeS nanoparticles (FeS0), as
demon-strated previously (Bura-Nakic et al., 2009; Eq. 2). [FeS0] = hX Fe2+ i FR − h Fe2+echem i (2) In this interpretation, FeS0 nanoparticles encompass both
electrochemi-cally, which must be smaller than 5 nm in diameter to diffuse to the electrode (Buffle, 1988), and the larger FeS nanoparti-cles that are not detected voltammetrically. As electrochemi-cally measured FeS(aq)cannot be quantified, both FeS forms
can unfortunately not be compared directly.
2.8 Calculations of oxygen uptake and AVS burial rates Diffusive oxygen uptake (DOU) rates were calculated using Fick’s first law (Berner, 1980, Eq. 3),
DOU = −φ · Ds· d[O2] dz z=0 , (3)
where φ is the dimensionless sediment porosity, Ds is the
apparent diffusion coefficient in the sediments (cm2s−1), and d[O2]
dz
z=0 is the oxygen gradient below the SWI (µmol mm−1). For the calculations, the gradient from 0 to 400 µm in the sediment was used. The Ds coefficients were
adjusted for diffusion in a porous environment according to Ds=(1+3·(1−φ))D0 , with the diffusion coefficient in free water
(D0) taken from Broecker and Peng (1974) and recalculated
at in situ temperature by the Stokes–Einstein relation (Li and Gregory, 1974).
AVS burial fluxes were estimated using available sedimen-tation rates (Charmasson et al., 1998; Miralles et al., 2005), average AVS concentrations and porosities of each sediment core, according to Eq. (4),
AVSburial= (1 − φ) · ω · AVS · ρ, (4)
where ω is the sedimentation rate (cm yr−1) and ρ is the sed-iment dry bulk density (g cm−3).
2.9 Stoichiometric ratios
Anaerobic mineralization of organic matter follows various complex reaction pathways (Table 1), but the relationships between key concentrations help us to understand which pro-cesses are dominant (Burdige and Komada, 2011). To de-termine the relationship between net TA and DIC produc-tion and to establish whether sulfate reducproduc-tion represents the main source of TA and DIC in these sediments, stoichio-metric ratios of the relative production of TA compared to DIC (rAD), as well as TA (rAS) and DIC (rDS) compared
to sulfate consumption, were calculated from the pore wa-ter data and compared to theoretical ratios from the reac-tion stoichiometries (Table 1). These ratios are equivalent to slopes in DIC–TA diagrams that can be used to iden-tify the dominant processes controlling the carbonate system (Pain et al., 2019). For each station, experimental stoichio-metric ratios were obtained from the slope and standard de-viation of the linear regression of 1TA, 1DIC and 1SO2−4 property–property plots. The 1i values represent
concentra-tion changes with respect to bottom water concentraconcentra-tions for component i and were corrected by multiplying their values
by their diffusion coefficient (1i·Di; Berner, 1980), where
Diis the sediment diffusion coefficient for component i. The
corresponding diffusion coefficients, corrected for tempera-ture and salinity (cm2s−1), were adapted from Li and Gre-gory (1974). At the pH of pore waters (pHT∼7.5 at 20◦C,
S =38.0), more than 95 % of DIC and carbonate alkalinity are composed of bicarbonate ion (HCO−3). Given the rela-tively small difference in the diffusion coefficients of HCO−3 and CO2−3 (11.8 and 9.55 × 10⁻⁶cm2s−1at 25◦C, Li and Gregory, 1974) and the high proportion of HCO−3 relative to CO2−3 , the diffusion coefficient of HCO−3 was adopted for both TA and DIC diffusion.
As calcium carbonate precipitation occurs in the sediments of the Rhône River delta (Rassmann et al., 2016), the effect of CaCO3precipitation on TA and DIC variations was also
ac-counted for by considering the Ca2+concentration gradients in the pore waters. We assumed that the stoichiometric ra-tio of CaCO3represents a good approximation, as more than
95 % of the calcium carbonates in this area are composed of calcite (Rassmann et al., 2016). For these calculations, the absolute value of measured 1Ca2+, i.e., Ca2+concentration relative to its bottom water concentration, was added to the 1TA or 1DIC after taking the corresponding diffusion coef-ficients into account (DTA·1TA + 2DCa· |1Ca2+|for
alka-linity and DDIC·1DIC + DCa· |1Ca2+|for DIC) and plotted
against DSO2− 4
·1SO2−4 . The calculated slope provided a sto-ichiometric ratio corrected for the precipitation of calcium carbonate (rIJc). Pore water saturation states with respect to
calcite (Ca) were calculated according to the equation
pro-posed by Mucci (1983) and Millero (1983, 1995). Theoreti-cally, organic alkalinity has to be considered in the calcula-tion of rADand rASratios; however, this study does not
con-tain enough data to access organic alkalinity properly, and the expected effect of organic alkalinity on these ratios was low (Sect. 4.2).
3 Results
3.1 Bottom water and surface sediment characteristics At all stations, bottom water salinity ranged from 37.5 to 38.0 and temperature varied from 14.7 to 20.6◦C (Table 2).
Av-erage TA (2.60 ± 0.01 mM) and DIC (2.30 ± 0.02 mM) con-centrations (Table 2) were relatively high compared to the Mediterranean Sea but common for the Gulf of Lion (Cos-sarini et al., 2015). The pHTof the bottom waters varied from
8.05 to 8.09, with the highest value observed at station AK and the lowest at station E. Although the oxygen concentra-tion decreased with water depth, bottom waters were always well ventilated, with dissolved O2concentrations higher than
220 µmol L−1. Sediment porosity ranged between 0.7 and 0.8 at the SWI, and they were similar at all stations between 20 and 400 mm depth (Table 2).
3.2 Benthic total and diffusive fluxes
The in situ pH and O2 micro-profiles reflected the
differ-ences between the three study domains under the influence of the Rhône River plume (Fig. 2). In the proximal zone (sta-tions A and Z), the oxygen penetration depth (OPD) was only 1.5 to 2.5 mm into the sediment, as also indicated by sepa-rate micro-profile measurements (Fig. 2). The OPD increased from 2 to 6 mm at station K and reached 8 to 11 mm at the most offshore station (E). As a result of bad weather condi-tions, no exploitable in situ micro-profiles were recorded at stations AK and B, though ex situ voltammetric profiles de-termined oxygen penetration depths of 4 and 2 mm, respec-tively (Fig. 4). All pH micro-profiles indicated a pH mini-mum between 7.2 and 7.4 just below the OPD followed by an increase to between 7.5 and 7.6 in the manganese and ferrug-inous layers of the sediment around 5 mm inshore and below 12 mm offshore (Fig. 2). Below this depth, the pH stabilized in the pore waters.
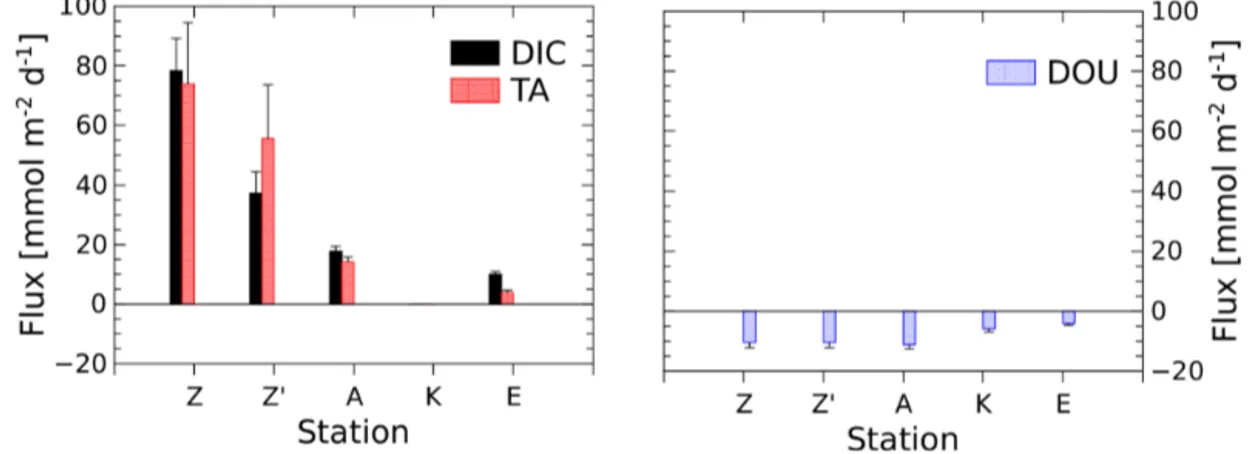
The benthic chamber was deployed once at stations A and E and twice at station Z (Z0is the replicate). Total alkalinity and DIC concentrations increased linearly with time (10 to 22 h) in the chamber (Fig. S1 in the Supplement), but con-centration changes decreased along the nearshore–offshore transect. Minimal disturbance of the sediment–water inter-face during deployments was evidenced by the initial DIC and TA concentrations, which were within 5 % and 8 % of the bottom water concentration, respectively (Fig. S1). The highest benthic fluxes were recorded for the two de-ployments at station Z, with TA fluxes of 73.9 ± 20.6 and 56.0 ± 17.8 mmol m−2d−1 and DIC fluxes of 78.3 ± 10.9 and 37.2 ± 7.2 mmol m−2d−1 (Fig. 3, Table 2). The rela-tively high variability between these two measurements is probably due to the high spatial heterogeneity of the sed-iments due to the deposition conditions during floods. At station A, the benthic TA and DIC fluxes reached lower values of 14.3 ± 1.6 and 17.8 ± 1.6 mmol m−2d−1, respec-tively, while benthic fluxes were lowest at station E, with a TA flux of 3.7 ± 0.9 mmol m−2d−1and a DIC flux of 9.9 ± 0.9 mmol m−2d−1. In parallel, DOU rates reached 10.2±1.3 and 10.4 ± 0.9 mmol m−2d−1 at stations A and Z and de-creased offshore to 5.9 ± 1.0 mmol m−2d−1at station K and 3.6 ± 0.6 mmol m−2d−1 at station E (Fig. 3, Table 2).
Al-though DOU rates and DIC fluxes tend to converge offshore, the TA and DIC fluxes in the proximal zone were between 2 and 8 times larger than the absolute value of the DOU rates (Fig. 3). In this area, DOU rates are quite representative of total oxygen uptake (TOU) by the sediments, as TOU : DOU ratios are typically around 1.2 ± 0.4 (Lansard et al., 2009). 3.3 Electrochemistry profiles
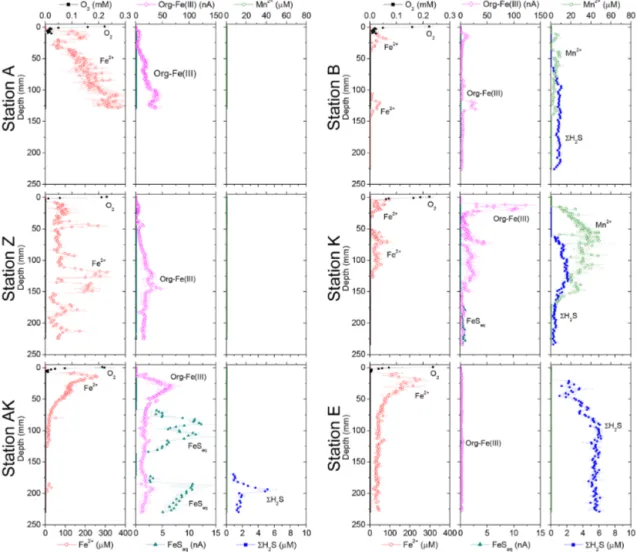
Dissolved Fe2+ concentrations as a function of depth in the sediment mirrored the voltammetric signals of soluble organic-Fe(III) complexes at stations A, Z, AK, B and K
(Fig. 4). High concentrations of dissolved Fe2+ were ob-served in the proximal domain at stations A (maximum of 341 ± 22 µM) and Z (maximum of 234 ± 25 µM), where dis-solved 6H2S was not detected (Fig. 4). At station AK, the
shallowest station in the prodelta domain, dissolved Fe2+ in-creased to a maximum concentration of 255 µM around 2 cm depth, then decreased with sediment depth as FeSaq below
6.5 cm, and small concentrations of dissolved 6H2S around
17 cm were produced (Fig. 4). The two deeper prodelta sta-tions, B and K, displayed lower Fe2+concentrations, includ-ing one peak not exceedinclud-ing 81 µM (station B) or 73 µM (sta-tion K) in the top 2 cm of the sediment and a second peak not exceeding 50 µM between 12 and 14 cm (station B) and 86 µM between 5 and 7.5 cm (station K) in the sediment. Al-though FeSaq was only detected below 15 cm at station K,
6H2S was produced in low concentrations (< 5 µM) around
6.5 cm at stations B and K (Fig. 4). A peak of Fe2+was ini-tially formed in the top 5 cm of the distal domain (station E) but decreased to a minimum value with depth and did not cor-relate with the organic-Fe(III) voltammetric signals, which also remained low throughout the profile (Fig. 4). Finally, station E displayed generally low concentrations of 6H2S in
the pore waters (< 6 µM), though the onset of 6H2S
produc-tion was much shallower (2.5 cm) and 6H2S concentrations
were consistently higher throughout the profile than at any other station.
3.4 Geochemical characteristics of the pore waters and sediments
In general, the pore water geochemical composition of du-plicate cores collected at each station matched well, except at stations A and Z, where some variations in TA, DIC and sulfate concentrations provide evidence for the heterogeneity of deposition processes in the proximal domain (Fig. 5). Both TA and DIC concentrations increased rapidly within the pore waters, likely reflecting the intensity of organic carbon min-eralization rates in these sediments. At all stations, DIC pore water concentrations correlated well with TA (overall slope: 1.01 ± 0.006, r2=0.995, n = 134). The TA and DIC gradi-ents were highest at stations A and Z, where maximum con-centrations of both species reached around 55 mM (Fig. 5). At station AK, TA and DIC concentrations reached a maxi-mum of 15 mM at 25 cm depth but decreased to 6 mM at the bottom of the core. The maximum concentrations of TA and DIC of 35 mM observed at station B were more compara-ble to the stations in the vicinity of the river mouth (stations A and Z) than other stations located in the prodelta domain (stations AK and K). At station K, TA and DIC concentra-tions reached 10 mM, whereas the lowest TA and DIC gradi-ents were measured at station E, with concentrations reach-ing only 4.6 mM at the bottom of the cores (30 cm). Sulfate was completely removed from the pore waters at depths of 35, 24 and 45 cm at station A, Z and B, respectively (Fig. 5). In turn, sulfate concentrations decreased to a minimum
con-Figure 2. Dissolved oxygen and pH micro-profiles recorded in situ at the sediment–water interface at stations A, Z, K and E. Stations A and Z are located in the proximal zone, K in the prodelta, and E in the distal zone (i.e., continental shelf).
Figure 3. DIC and TA fluxes measured with the benthic chamber and diffusive oxygen uptake (DOU) rates calculated from in situ micro-electrode depth profiles at stations A, Z (measured during two deployments) and E. Error bars represent either uncertainties about the linear regression of the benthic DIC and TA gradients, taking into account individual error bars of each data point, or error propagation and standard deviations of multiple DOU measurements. Fluxes out of the sediment are positive and fluxes into the sediment are negative.
centration of 20 mM at 29 and 24 cm depth at stations AK and K, whereas sulfate consumption was much smaller at sta-tion E with a minimum concentrasta-tion of 28 mM (bottom wa-ter sulfate concentration was 31.4 mM). As a result, TA and DIC changes in concentration at a given depth were highly inversely correlated (r2>0.98) with sulfate changes in con-centration at stations A, Z, AK, B, and K (Table 3). At station E, sulfate variations with depth were limited and the uncer-tainty on 1SO2−4 was too large to calculate rAS and rDS.
TA and DIC demonstrated strong correlations (r2>0.97) at stations A, Z, AK, B, and K (Table 3). In the proximal domain (stations A and Z), ammonium increased with sed-iment depth to concentrations > 3 mM (Fig. 5). At station B, ammonium reached concentrations > 2 mM with depth, whereas ammonium concentrations did not exceed 1.5 mM at station AK, 0.6 mM at station K and 0.3 mM at station E. Even though individual pore water profiles from replicate sampling (pore waters from two different cores were sam-pled and analyzed for DIC, TA, and SO2−4 at each station) were slightly different at some stations, the rAD, rASand rDS
ratios were the same. At all stations, nitrite plus nitrate con-centrations were less than 20 µM (data not shown). Signifi-cant methane concentrations (> 50 µM) were detected at the
bottom of the sediment core at stations A, Z, and AK (Fig. 5), and a SMTZ was tentatively identified between 28 and 39 cm at station A and between 19 and 39 cm at station Z, as the use of pore water data from different cores is not straightfor-ward given the high heterogeneity of sediment deposits in the proximal domain. As methane was < 50 µM throughout the profile at station K and sulfate was not completely consumed inside the sediment core at station AK, the SMTZ was not determined at these two stations. Methane analyses were not carried out for the other stations.
The sediment pore waters were supersaturated with re-spect to calcite (Ca>1) at all stations and supersaturated
with respect to aragonite except for the surface at stations B and K. At stations A, Z and B, decreasing Ca2+ concentra-tions in the pore waters indicated precipitation of CaCO3,
whereas Ca2+ concentrations remained close to the bot-tom water Ca2+concentrations (11.2 mM in Mediterranean waters) at the other stations (Fig. 5). Dissolved phosphate concentrations (6PO3−4 ) were relatively high (50–100 µM) throughout the profiles at stations A, AK, K and Z, and a large increase in concentration (up to 160 µM at station Z) was observed at station AK, K and Z between 15 and 22 cm. In turn, 6PO3−4 production was minimal in station E pore
Figure 4. Depth profiles of dissolved O2, Mn2+, Fe2+, org-Fe(III), FeSaqand 6H2S concentrations measured electrochemically in intact
sediment cores at stations A, Z, AK, K, B and E. Org-Fe(III) and FeSaqare reported in normalized current intensities (nA).
waters (< 10 µM). Dissolved phosphate was not measured at station B. Sediment samples were analyzed for AVS as a function of depth at stations A, AK and E to assess one sta-tion in each domain (Fig. 5). At stasta-tion A, a peak in AVS (65 µmol g−1) was measured around 8.0 cm followed by a second, smaller peak (22 µmol g−1) at 14 cm, after which AVS decreased with depth. The AVS concentrations were low in the top portion of the sediment at station AK but in-creased with depth to 100 µmol g−1 around 15 cm. At sta-tion E, only a small AVS peak of 20 µmol g−1was observed at 14 cm. Finally, large concentrations of FeS nanoparti-cles (FeS0) were found in the proximal and prodelta
sta-tions, including two broad peaks and maximum concentra-tions around 1 mM at staconcentra-tions A and Z and a large subsurface maximum up to 6 mM at 145 mm at station AK. These FeS0
concentrations increased as a function of depth to a relatively constant 0.5 mM below 4.5 cm at station B and below 12 cm at station K, whereas they remained mostly negligible at sta-tion E (Fig. 5).
4 Discussion
The main objectives of this study were to determine the mag-nitude of the alkalinity source from deltaic region sediments exposed to large riverine inputs and to identify the biogeo-chemical processes responsible for the observed benthic TA and DIC net production. In this section, benthic TA and DIC fluxes in the Rhône River prodelta are first compared to other similar systems. In the following sections, the most likely biogeochemical processes responsible for the high benthic TA fluxes are identified based on the sediment depth profiles collected. As calcium carbonate dissolution, denitrification, and organic alkalinity can be discarded as major TA sources from these sediments (see discussion below), the role of iron sulfide mineral precipitation on the benthic TA flux is ex-amined using a variety of analytical techniques, speciation calculations and a mass balance approach. Finally, the link between inputs to the sediment, carbon mineralization cesses, sulfide mineral burial, and the benthic TA flux is pro-vided using a conceptual model.
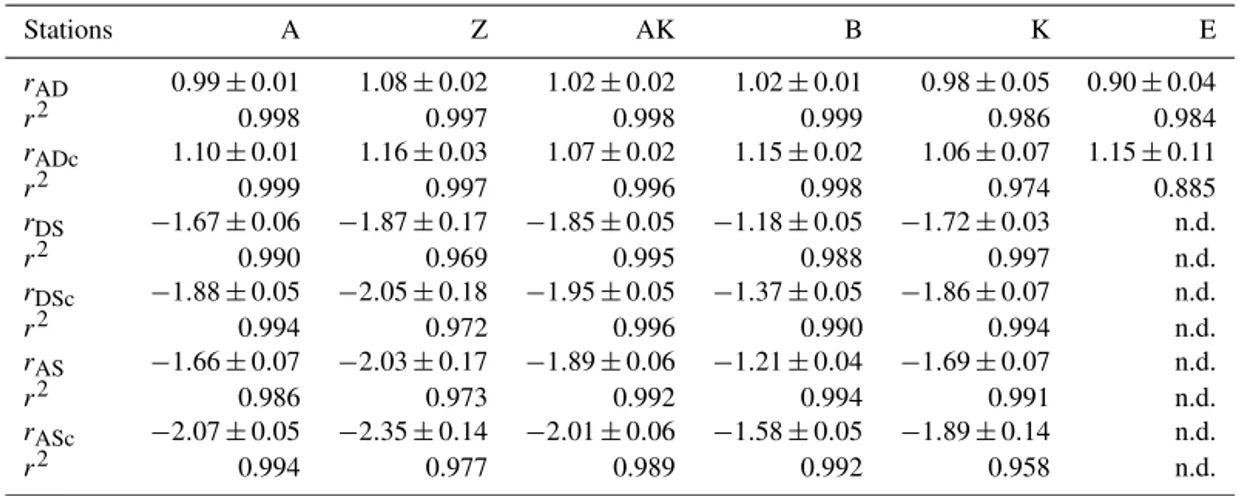
Table 3. Diffusion-corrected stoichiometric ratios rAD, rDS, and rASand their corresponding ratios corrected for carbonate precipitation
(rADc, rDScand rASc) along with their associated determination coefficients (r2) from linear regression (n.d. = not determined).
Stations A Z AK B K E rAD 0.99 ± 0.01 1.08 ± 0.02 1.02 ± 0.02 1.02 ± 0.01 0.98 ± 0.05 0.90 ± 0.04 r2 0.998 0.997 0.998 0.999 0.986 0.984 rADc 1.10 ± 0.01 1.16 ± 0.03 1.07 ± 0.02 1.15 ± 0.02 1.06 ± 0.07 1.15 ± 0.11 r2 0.999 0.997 0.996 0.998 0.974 0.885 rDS −1.67 ± 0.06 −1.87 ± 0.17 −1.85 ± 0.05 −1.18 ± 0.05 −1.72 ± 0.03 n.d. r2 0.990 0.969 0.995 0.988 0.997 n.d. rDSc −1.88 ± 0.05 −2.05 ± 0.18 −1.95 ± 0.05 −1.37 ± 0.05 −1.86 ± 0.07 n.d. r2 0.994 0.972 0.996 0.990 0.994 n.d. rAS −1.66 ± 0.07 −2.03 ± 0.17 −1.89 ± 0.06 −1.21 ± 0.04 −1.69 ± 0.07 n.d. r2 0.986 0.973 0.992 0.994 0.991 n.d. rASc −2.07 ± 0.05 −2.35 ± 0.14 −2.01 ± 0.06 −1.58 ± 0.05 −1.89 ± 0.14 n.d. r2 0.994 0.977 0.989 0.992 0.958 n.d.
Figure 5. Depth profiles of pore water TA, DIC, SO2−4 , NH+4, CH4, Ca2+, nanoparticulate FeS (FeS0), 6PO3−4 and AVS concentrations,
along with the calcium carbonate (calcite) saturation state of the pore waters (Ca) at stations A, Z, AK, K, B and E. Alternating symbol
shapes indicate data collected from duplicate long and short sediment cores. The calcium carbonate (calcite) saturation state (Ca) and pore
water FeS0concentrations were calculated, whereas AVS was determined from solid-phase extractions. The two horizontal lines identify the sulfate–methane transition zone (SMTZ) found at stations A and Z. Error bars represent standard deviations of multiple measurements for the concentrations and error propagation for . Concentrations of CH4were not measured at stations B, K and E.
4.1 DIC and alkalinity fluxes from the sediment The sediments of the Rhône proximal and prodelta zones rep-resent important sources of both DIC and TA to the bottom waters (Fig. 3). The observed fluxes show some variability between stations in the proximal zone, most probably due to the high inter- (i.e., kilometer scale between stations A and Z) and intra-station (i.e., < 100 m between Z and Z0) biogeochemical heterogeneities associated with massive and rapid deposition events during floods. This heterogeneity is also visible in pore water profiles from two different cores at station Z or A (Fig. 5). Despite this sub-kilometer variabil-ity near the river mouth, the biogeochemical gradient from the proximal zone to the continental shelf is large enough to contrast the different zones. The DIC fluxes observed in the proximal domain (18–78 mmol m−2d−1at station A and Z; Fig. 3) are in the range of previously measured fluxes in other deltas where anaerobic mineralization processes are dominant, including Mississippi delta sediments from core incubations (15–20 mmol m−2d−1; Lehrter et al., 2012) or benthic chambers (36–53 mmol m−2d−1; Rowe et al., 2002), benthic chamber measurements in Po River delta sed-iments and the Adriatic shelf (15–25 mmol m−2d−1; Ham-mond et al., 1999), the Fly River delta during the most active season (35–42 mmol m−2d−1; Aller et al., 2008) and near the Guadalquivir River estuary (36–46 mmol m−2d−1; Fer-ron et al., 2009). In contrast, fewer alkalinity fluxes were measured in river deltas, though those obtained from ben-thic chambers in the Danube and Dniester deltas in the northwestern Black Sea (21–67 mmol m−2d−1; Friedl et al., 1998) are within the range of values reported in this study (14–74 mmol m−2d−1). Benthic TA fluxes obtained in the Guadalquivir estuary (24–30 mmol m−2d−1; Ferron et al., 2009) and the Adriatic shelf sediments off the Po River delta (0.5–10.4 mmol m−2d−1; Hammond et al., 1999) are in the lower range of TA fluxes measured in the present study, likely because the sampling stations were located further on the shelf. The biogeochemical origin of these TA benthic fluxes is discussed in the next sections.
4.2 Production of alkalinity by calcium carbonate dissolution and denitrification in coastal marine sediments
Calcium carbonate dissolution, denitrification from imported nitrate, and burial of FeS or FeS2following iron hydroxide
and sulfate reduction produce significant alkalinity in coastal marine sediments that may be transferred to the overlying waters (Hu and Cai, 2011a). In this section we examine if the first two processes contribute to the observed TA fluxes in the Rhone delta area.
Calcium carbonate dissolution may occur immediately be-low the SWI as a result of the acidity generated by aero-bic respiration, and may thus represent a possible contribu-tor to TA fluxes as demonstrated in carbonate-rich permeable
sediments (e.g., Burdige and Zimmerman, 2002; Cyronak et al., 2013; Rao et al., 2014). As about 95 % of the CaCO3
minerals in this area are made of calcite (Rassmann et al., 2016), the discussion is focused on this phase, but the cal-culations have also been made for aragonite. In the proxi-mal zone, both the water column (Ca=5.5) and the pore
waters at depth (Ca>1) are largely supersaturated with
re-spect to calcite and aragonite (Rassmann et al., 2016; Fig. 5) suggesting that carbonate mineral dissolution is not signif-icant. These findings are corroborated by a large decrease in Ca2+concentration in the pore waters, indicating instead CaCO3 precipitation at depth in proximal zone sediments.
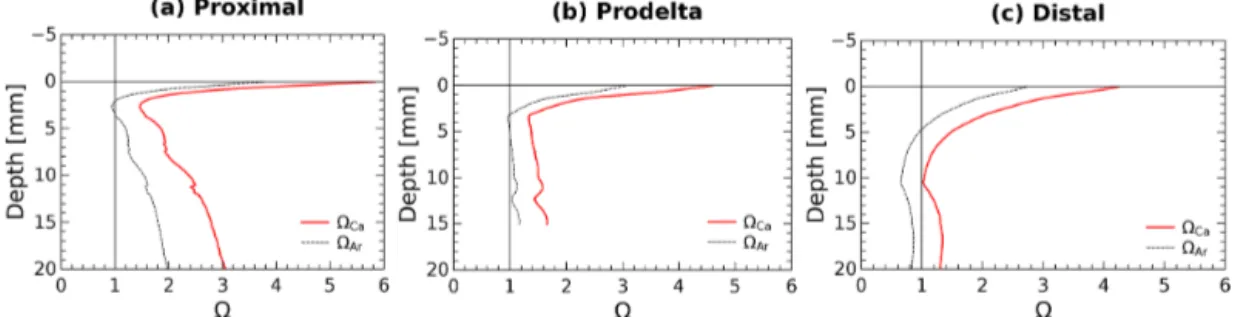
Yet, the large pH decrease in the first millimeters below the sediment–water interface (Fig. 2) may induce carbonate dis-solution at this scale. Calcium carbonate saturation states at a millimeter scale near the SWI were calculated from pH pro-files and interpolation of the centimeter-scale DIC propro-files using the Seacarb software (Fig. 6). These calculations show that in the proximal zone, the saturation state with respect to calcite is always above 1.5 and always above 1 for aragonite. Such saturation state precludes massive carbonate dissolu-tion at the sediment surface and discounts shallow carbonate dissolution as playing a large role on the benthic alkalinity fluxes observed in proximal sediments. Minor quantities of calcium carbonate or magnesian calcite may be dissolved in micro-niches where the pH could be lower than 7.4. These processes, however, do not visibly imprint the Ca2+profile (Fig. 5) and surely represent an insignificant fraction of the large TA benthic flux measured in the proximal zone. At the distal shelf station (Station E, Fig. 6c), the saturation state was close to 1 for calcite and slightly undersaturated for arag-onite, which may indicate a potential contribution of calcium carbonate dissolution to the benthic alkalinity flux in this area.
As coupled nitrification–denitrification is neutral to TA net production, denitrification based on an external source of nitrate represents the second potential net source of TA in marine sediments (Hu and Cai, 2011b). In the Rhône prodelta, the stratification of the water column prevents large inputs of riverine nitrate to bottom waters, as evidenced by their high salinity (Table 2) and low nitrate concentrations ([NO−3] =1.5 µmol L−1; Bonin et al., 2002). Furthermore, nitrate profiles in pore waters generally display a subsurface peak, indicating nitrate efflux, which also prevents benthic denitrification of bottom water nitrate (Pastor et al., 2011). It can therefore be concluded that the contribution of denitrifi-cation to TA fluxes is minimal in the sediments of the Rhône River delta.
In the bottom waters, organic alkalinity was estimated from TA, pH and DIC concentrations to represent less than 1 % of TA. In the pore waters, the data set did not allow es-timating organic alkalinity directly, but the rAD close to 1
indicates that the organic alkalinity fraction is limited con-trarily to previous findings where organic alkalinity plays an
Figure 6. Average pore water saturation states with respect to calcite and aragonite in the first centimeter of the sediment at stations: (a) proximal (St. A, Z), (b) prodelta (St. K), and (c) distal (St. E) calculated using the DIC gradients at the SWI together with the average measured pH micro-profiles.
important role and rAD ratios > 1.3 have been recorded at
similar pH (Łukawska-Matuszewska, 2016).
In the next sections, we detail the last process producing alkalinity, i.e., FeS production and burial.
4.3 DIC and TA produced by sulfate reduction
Sulfate reduction typically represents a major organic car-bon mineralization pathway in organic-rich sediments that simultaneously produces 2 mol of TA and 2 mol of DIC per mole of sulfate reduced (Table 1, Reaction R6) (Canfield et al., 1993b; Burdige, 2011). Dissimilatory iron reduction (Table 1, Reaction R7) in turn produces 0.25 mol of DIC (HCO−3) and consumes 1.75 mol of H+, resulting in 2 mol of TA produced per mole of Fe. As these two processes equally produce 2 mol of TA per mole of terminal electron acceptor (Table 1, Reaction R6 for SO2−4 and Reaction R7 for Fe(OH)3), they can both contribute significantly to the
bulk alkalinity production in sediment pore waters. The low concentration of nitrate, relatively low production of reduced metals in the pore waters (Fig. 4), and intense ammonium and DIC production in parallel with sulfate consumption at depth (Fig. 5) confirm that sulfate reduction is one of the dominant mineralization pathways in the Rhône River prodelta sedi-ments (Pastor et al., 2011; Rassmann et al., 2016). Assum-ing that sulfate reduction is responsible for the majority of the bulk alkalinity production, experimentally derived stoi-chiometric ratios of the relative production of DIC and TA compared to sulfate consumption may identify the effect of other reaction pathways responsible for bulk alkalinity pro-duction or consumption in these sediments (Burdige and Ko-mada, 2011). Factoring carbonate precipitation using pore water Ca2+data, the rDScranged between −2.05 and −1.86,
except for one value at −1.37 (station B), whereas the rASc
ratios ranged between −2.35 and −1.89, with the exception of station B at −1.58 (Table 3). Theoretically, the rDSand rAS
should equal −2.0 if sulfate reduction is the only control on DIC and TA production (Table 1, Reaction R6), suggesting that, except at station B, the influence of other diagenetic pro-cesses on rAScand rDScis limited. At station B, however, the
higher rDScratio (Table 3) may indicate significant anaerobic
oxidation of methane (AOM Table 1, Reaction R8), which generates a theoretical rDSof −1 (Borowski et al., 1996;
Ko-mada et al., 2016). Unfortunately, methane sampling was not performed at station B, preventing precise identification of AOM at this station.
4.4 Formation of iron sulfide species
Although the complete depletion of sulfate in the first 30 cm of the sediment at stations A, Z and B implies an equiva-lent production of dissolved sulfide (6H2S) (Table 1,
Reac-tion R6), pore waters displayed little to no 6H2S (Fig. 4).
If all of the produced 6H2S diffused upward and reacted
in the oxic sediment layers, the alkalinity produced by sul-fate reduction would be consumed by the oxidation of 6H2S
by dissolved O2and the pH should be lowered significantly
given the large acidity generated by this reaction (Table 1, Reaction R4). Although 6H2S was nearly absent of pore
waters (Fig. 4), the pH minimum was never lower than 7.2 and the observed alkalinity fluxes across the SWI were sub-stantial (Fig. 3), indicating that 6H2S was removed from
the pore waters below the oxic layer. Abiotic reduction of Fe(III) oxides by 6H2S (Table 1, Reaction R9), followed
by precipitation of FeS in the anoxic zone (Table 1, Reac-tion R10; Berner, 1970; Pyzik and Sommer, 1981; Carman and Rahm, 1997; Soetaert et al., 2007), and eventually for-mation of pyrite (Table 1, Reaction R11; Rickard and Luther, 1997) may represent a significant 6H2S removal pathway.
As the precipitation of siderite is too slow to compete with FeS precipitation (Jiang and Tosca, 2019; Pyzik and Sommer, 1981) and the abiotic reduction of Fe(III) oxides by 6H2S
coupled with either FeS or FeS and pyrite precipitation (Ta-ble 1, Reactions R9–R11) does not alter alkalinity overall, bacterial sulfate reduction followed by abiotic precipitation of iron and sulfide from the pore waters to either FeS or pyrite (Table 1, Reactions R12 and R13) should result in rAD=1
and rDS=rAS= −2. Formation of pyrite is accompanied by
the consumption of molecular H2by sulfate-reducing
bacte-ria, resulting in a slight increase in the rADand rDSto 1.1 and
−1.81 for the overall reaction, while the rASratio should not
The observed range of rADc(1.06 to 1.15) and rDSc(−2.05
to −1.86) ratios in the proximal and prodelta stations, except at station B (Table 3), is fully compatible with sulfate reduc-tion coupled to iron reducreduc-tion and FeS precipitareduc-tion (possibly followed by pyritization), though rADcand rDScratios are not
able to distinguish abiotic and microbial pathways of iron re-duction. Indeed, the concomitant production of Fe2+by dis-similatory iron reduction (Table 1, Reaction R7) and 6H2S
by sulfate reduction followed by precipitation of FeS de-creases the net rADand rDSratios to 0.89 and −2.25, whereas
the rASratio remains at −2 (Table 1, Reaction R15). With
ensuing formation of pyrite, theoretical mole ratios change slightly to rAD=0.94 and rDS= −2.13 without H2
reoxida-tion (Table 1, Reacreoxida-tion R16) or 1.06 and −1.89 with H2
re-oxidation (Table 1, Reaction R17). The occurrence of dissim-ilatory iron reduction in the proximal and prodelta domains, however, is substantiated by several other pieces of evidence. First, the production of soluble organic-Fe(III) complexes deeper than the oxygen penetration depths (Fig. 4) indicates that these species did not result from the oxidation of Fe2+ by dissolved O2in the presence of organic ligands (Taillefert
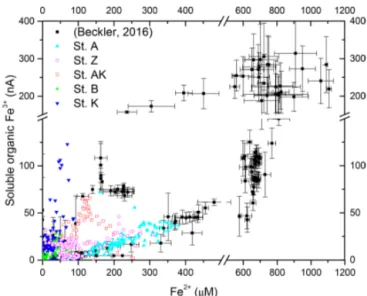
et al., 2000). Second, as soluble organic-Fe(III) complexes are produced as intermediates in the reduction of Fe(III) ox-ides by iron-reducing bacteria (Taillefert et al., 2007; Jones et al., 2010), their concomitant detection with Fe2+ at all stations in the proximal and prodelta domains (Fig. 4) sug-gests they were produced during dissimilatory iron reduction. Third, the positive correlation between the current intensities of organic-Fe(III) complexes and Fe2+concentrations is in line with the same correlation obtained in iron-rich deep-sea sediments (Fig. 7) where sulfate reduction was not signifi-cant (Beckler et al., 2016). Finally, as these organic-Fe(III) complexes are readily reduced by 6H2S (Taillefert et al.,
2000), their presence in zones of sulfate reduction suggests these sediments are biogeochemically dynamic with periods of microbial iron reduction followed by sulfate reduction and rapid FeS precipitation that culminates in spring and summer. These dynamics may be temporally initiated by the input of organic and inorganic material from the Rhône River in the proximal domain during major floods in late fall and winter, which generates, during spring and summer, large DIC and TA concentrations and large iron(II) concentrations and com-pletely exhausts sulfate at depth in the pore waters (Pastor et al., 2018) in a reproducible manner over the years.
4.5 FeS precipitation
The discrepancy between sulfate consumption and the low concentration of 6H2S along with the high benthic TA fluxes
clearly suggests that much of the sulfide was precipitated in the solid phase. Indeed, AVS measurements show precipita-tion of FeS in the proximal and prodelta domains (Fig. 5). In addition, the large phosphate concentrations observed at depth in the proximal and prodelta domains (Fig. 5) suggest that 6PO3−4 adsorbed to Fe(III) oxides was released in the
Figure 7. Current intensities of organic-Fe(III) complexes as a func-tion of Fe2+concentrations measured at each depth at stations A, Z, AK, B and K compared to the same data obtained from iron-rich deep-sea sediments (Beckler et al., 2016).
pore waters during secondary conversion of Fe(III) oxides to FeS (Anschutz et al., 1998; Rozan et al., 2002). More im-portantly, large concentrations of nanoparticulate FeS (FeS0
in the range of 1–6 mM) were identified in the proximal and prodelta stations and decreased with distance from shore (Fig. 5). The existence of FeS0suggests that large fractions
of Fe2+and 6H2S were actively removed from the pore
wa-ters at the time of measurements and eventually immobilized under the form of sulfide minerals. Although soluble FeSaq
clusters detected electrochemically when the system is super-saturated with respect to FeS (Theberge and Luther III, 1997) are considered good indicators of the active precipitation of iron sulfide minerals (Luther and Ferdelman, 1993; Davison et al., 1998; Taillefert et al., 2000), they were rarely observed in the Rhône River delta (Fig. 4). Collectively, the large con-centrations of FeS0 compared well with the small
electro-chemically active FeSaq complexes; the absence of 6H2S
despite complete removal of sulfate along with the generally low saturation state of the pore waters with respect to FeS (Fig. S2) indicate that the proximal stations and some of the prodelta stations were not at equilibrium and that FeS was partly aggregated during this time period.
4.6 Benthic alkalinity flux as a result of iron sulfide burial
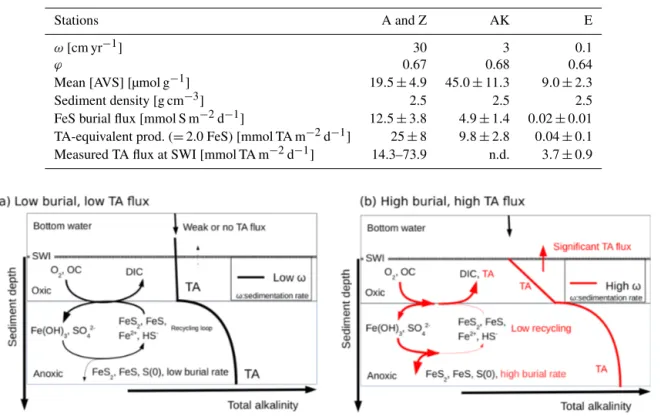
As sediments rapidly accumulate in the proximal domain during flood events (Maillet et al., 2006; Cathalot et al., 2010; Zebracki et al., 2015), the burial of FeS becomes irreversible and thus represents a net source of alkalinity to the bottom waters (Berner, 1982; Hu and Cai, 2011a; Brenner et al., 2016). With the precipitation of FeS, about 2 to 3 mol of alkalinity equivalent should be produced for each mole of
sulfur precipitated (Table 1, Reactions R12 and R15). As-suming dissimilatory microbial iron and sulfate reduction dominate in the proximal and prodelta zones, a conserva-tive ratio of 2 mol of TA equivalent per mole of FeS precip-itated can be estimated (Table 1, Reaction R15). The calcu-lated AVS burial flux provides an alkalinity-equivalent flux of 25.0 ± 7.7 mmol m−2d−1 in the proximal domain (Ta-ble 4), which falls within the range of benthic alkalinity fluxes measured by benthic chamber at stations A and Z (14– 74 mmol m−2d−1; Fig. 3 and Table 4). The connection be-tween alkalinity fluxes at the sediment–water interface and FeS burial at depth is questionable given the low residence time of the sediment near the interface (< 1 year in the first 30 cm) and the temporal variability in deposition processes (see Sect. 2.1). Chemical gradients, and thus benthic fluxes, are shaped by biogeochemical reactions occurring within the diffusion length, i.e., the distance (d) that can be traveled by diffusion of chemical species over a given time:
d =p2 · Ds·t , (5)
where d is the diffusive length (cm), Ds the diffusion
co-efficient in the sediment (cm2s−1) and t the time (s). For a period of 6 months (between fall and spring), using the diffu-sion coefficient of HCO−3 (Ds=7 × 10⁻⁶cm2s−1at 20◦C),
the diffusion distance reaches around 15 cm. This distance represents a minimal estimates as transport is likely enhanced by bioturbation and bioirrigation such that 20 cm of sediment and pore water may be considered connected to the SWI on a semiannual basis. These findings indicate that biogeochem-ical processes over that depth interval are able to shape net benthic alkalinity fluxes at the SWI over a 6-month period after the fall floods (Anschutz et al., 2002). The FeS burial effect is strengthened by the episodic but large deposition of new sediment during the following fall floods.
In the prodelta, the alkalinity-equivalent flux resulting from FeS burial is estimated at 9.8 ± 2.8 mmol m−2d−1 at station AK (Table 4). This, unfortunately, cannot be com-pared to benthic alkalinity fluxes, as they were not measured. In the distal domain, however, a low alkalinity-equivalent flux of 0.04 ± 0.1 mmol m−2d−1 is estimated from the av-erage FeS burial flux at station E. This flux is much lower than the 3.7 ± 0.9 mmol m−2d−1 flux measured by benthic chamber (Fig. 3), a difference that could be due to shallow carbonate dissolution.
4.7 Linking TA and DIC fluxes to mineralization processes
Overall, the present findings indicate that FeS burial modi-fies the alkalinity budget in the proximal and prodelta sed-iments (Brenner et al., 2016). As the measured benthic al-kalinity fluxes are compatible with the alal-kalinity generated during the reduction of Fe(III) oxides, sulfate and subsequent FeS burial in the proximal zone, these processes are likely responsible for the large benthic alkalinity fluxes reported
in this high-sedimentation delta and, potentially, other sim-ilar systems (Hu and Cai, 2011a). Although precipitation of pyrite may also preserve the bulk alkalinity generated in the pore waters, pyrite precipitation is slow enough compared to FeS precipitation (Rickard, 1995; Rickard and Luther, 1997) that it may occur only deeper in the sediment.
The biogeochemical cycling of C, Fe, S, and TA close to the Rhône River mouth can be theoretically summarized as follows (Fig. 8): (i) the high pore water DIC concentrations resulting from the production of metabolic CO2 during
or-ganic carbon mineralization lead to benthic DIC fluxes that are only modulated by the precipitation of carbonate miner-als. (ii) The high pore water TA concentrations result from in-tense iron and sulfate reduction as a result of the high supply of organic matter and Fe(III) oxides to the sediment and are limited by the diffusion of sulfate in the sediment. (iii) The precipitation of FeS and the high sedimentation rates near the river mouth preserve the majority of reduced iron and 6H2S buried in the form of solid FeS minerals and
poten-tially pyrite within the anoxic sediments (Aller et al., 1986). (iv) Ultimately, the TA-consuming reoxidation of reduced metabolites (i.e., NH+4, 6H2S, Fe2+) is not important in the
oxic sediment layers, and a significant fraction of the anaero-bically produced TA is transferred across the SWI (Fig. 8, red line). (v) Benthic alkalinity fluxes may be sustained on a an-nual basis, as the large input of sediment to the prodelta dur-ing fall floods is followed by the development of anaerobic respiration processes during the spring and summer seasons. In these conditions, anaerobic and aerobic processes are de-coupled, and the consumption of oxygen no longer reflects the overall respiration rates within these sediments (Pastor et al., 2011), as observed by the relatively low DOU rates com-pared to TA and DIC fluxes in the proximal domain (Fig. 3). In contrast, sedimentation rates (Table 2), overall respira-tion rates (Fig. 3), and the intensity of iron and sulfate reduc-tion (Fig. 5) decrease in the distal domain (stareduc-tion E), and as a consequence the relative proportion of aerobic processes increases (Pastor et al., 2011). Despite the relatively small decrease in pore water sulfate concentrations with depth and low 6H2S concentrations (< 10 µmol L−1) at the most
off-shore station E, 6H2S concentrations were the highest of all
the stations. These findings likely reflect the fact that less riverine Fe(III) oxides were available for FeS precipitation and that this system is probably iron limited. With low sedi-mentation rates (0.1 to 1 cm yr−1), and thus low input of or-ganic matter and Fe(III) oxides, the overall carbon turnover is decreased and the reduced by-products of sulfate and/or iron reduction may be transported back to the oxic sediment lay-ers to be reoxidized by dissolved oxygen (Fig. 8). In this case, the alkalinity generated by anaerobic respiration processes is consumed by reoxidation of the reduced metabolites, and the flux of alkalinity near the SWI decreases to weak values at station E (Figs. 3 and 8, black line).
The strong TA flux to the overlying waters measured in the Rhône River delta may contribute, along with riverine