HAL Id: hal-02964181
https://hal.inrae.fr/hal-02964181
Submitted on 12 Oct 2020HAL is a multi-disciplinary open access archive for the deposit and dissemination of sci-entific research documents, whether they are pub-lished or not. The documents may come from teaching and research institutions in France or abroad, or from public or private research centers.
L’archive ouverte pluridisciplinaire HAL, est destinée au dépôt et à la diffusion de documents scientifiques de niveau recherche, publiés ou non, émanant des établissements d’enseignement et de recherche français ou étrangers, des laboratoires publics ou privés.
seeded faba bean genotypes (Vicia faba L.) to salinity
stress: identification of a contrasting pair towards
salinity
I. Rajhi, S. Moussa, I. Neji, B. Baccouri, M. Chikha, C. Chammakhi, M Amri
#, R ###, H. Mhadhbi
To cite this version:
I. Rajhi, S. Moussa, I. Neji, B. Baccouri, M. Chikha, et al.. Photosynthetic and physiological responses of small seeded faba bean genotypes (Vicia faba L.) to salinity stress: identification of a contrasting pair towards salinity. Photosynthetica, Springer Verlag, 2020, 58 (1), pp.174-185. �10.32615/ps.2019.152�. �hal-02964181�
Photosynthetic and physiological responses of small seeded faba bean
genotypes (Vicia faba L.) to salinity stress: identification of a contrasting
pair towards salinity
I. RAJHI*,+, S. BEN MOUSSA*, I. NEJI*, B. BACCOURI**, M. BEN CHIKHA***, C. CHAMMAKHI*,
M. AMRI#,##, R. BROUQUISSE###, and H. MHADHBI*
Laboratory of Legumes, Centre of Biotechnology of Borj Cedria B.P. 901, Hammam-Lif 2050, Tunisia*
Laboratory of Olive Biotechnology, Centre of Biotechnology of Borj Cedria B.P. 901, Hammam-Lif 2050, Tunisia**
Laboratory of Plant Molecular Physiology, Centre of Biotechnology of Borj Cedria, Hammam-Lif 2050, Tunisia***
Agro-BioSciences (AgBS), University Mohammed VI Polytechnics (UM6P), Benguerir, Morocco#
Crop Laboratory, National Institute of Agricultural Research of Tunisia (INRAT), Ariana, Tunisia##
INRA, Sophia Agrobiotech Institute (ISA), Nice Sophia Antipolis University, 1355 INRA/7254 CNRS, France###
Abstract
In this study, we examined the behavior of six faba bean (Vicia faba L.) genotypes under salinity conditions at the seedling stage. The evaluation was assessed using 21 morphological, physiological, and photosynthetic traits under control, moderate, and severe salinity conditions. The principal component analysis (PCA) was used to identify genotypes of contrasting behavior in response to salt stress and to characterize the important traits for salt tolerance. The result of PCA analysis showed that the genotypes displayed different behavior under the saline conditions. The most discriminating quantitative characters were related to plant biomass production and photosynthesis, especially the mass of fresh root, number of leaves, water-use efficiency, and the substomatal CO2 concentration. The analysis of all parameters by PCA
permits us to distinguish cv. Najeh as the most tolerant genotype for salinity conditions and cv. Chourouk as the most sensitive one. These results would be of pertinent tools in faba bean breeding programs.
Additional key words: contradictory behavior; indices of tolerance; photosynthetic gas-exchange parameters.
Received 18 April 2019, accepted 14 November 2019.
+Corresponding author; e-mail: imenrajhi@yahoo.fr
Abbreviations: Car – carotenoids; Chl – chlorophyll; Ci – substomatal CO2 concentration; E – transpiration rate; EL – electrolyte
leakage; gs – stomatal conductance; LR – length of the root, LS – length of the shoot; MDR – mass of dried root, MDS – mass of dried
shoot; MFR – mass of fresh root, MFS – mass of fresh shoot; MTDP – mass of total dried plant; MTFP – mass of total fresh plant; NL – number of leaves; PCA – principal component analysis; PN – net CO2 assimilation rate; RGR – relative growth rate; RWC –
relative water content; WUE – intrinsic water-use efficiency.
Acknowledgements: The authors are grateful for the financial support provided by the PHC-MAGHREB ALADIN 39364 TG entitled
‘Adaptation of legumes to water stress and impact on growing wheat in rotation’.
average. Additionally, national production changes through regions and enormously from year to year. This variation is due to the absence of resistant cultivars to biotic and abiotic stresses. Salinity is an important abiotic stress that severely inhibits production and adversely affects yield and culture sustainability (Link et al. 1999). The salinity of soils is formed by the accumulation of salt resulting from excessive irrigation with saline water. It engenders morphological, biochemical, and physiological changes in the plant (Kafi 2009) and it has a negative effect on the crop production in the world (Ashraf 2009). In plants, salinity affects the opening of stomata, osmotic adjustment, growth rate, root hydraulic conductance, photosynthetic pigments, and nutritional balance (Almodares et al. 2008, James
et al. 2011). However, the degree of tolerance is different
between species (Munns and Tester 2008). In order to
Introduction
Faba bean (Vicia faba L.) is considered as one of the most important cool-season legume crops together with dry beans, dry peas, and chickpeas (Kumari and van Leur 2011). It is the oldest legume in the Mediterranean countries. It is used for both human food and animal feed since it contains approximately 30% of protein (Tewodros
et al. 2015). Besides, faba bean can be used as an efficient
crop improving by introducing the grain legumes into crop rotation (Kharrat and Ouchari 2011). In Tunisia, faba bean is the most cultivated grain legume with more than 70,000 hectares representing 75% of the total grain legumes cultivated areas in the country (Kharrat and Ouchari 2011, Trabelsi et al. 2016, Amri et al. 2019). The national average of productivity is about 42% below the worldwide
reduce the harmful effect of salinity on crop production, it is important to cultivate tolerant genotypes. Recently, conventional selection and breeding techniques were used in the study of crop salinity tolerance (Gasim et al. 2015, Mahlooji et al. 2018). Nevertheless, the insufficient understanding salinity tolerance and the absence of an adequate method of screening techniques limit the effort of breeding for salinity tolerance (Munns and James 2003). In addition, the selections based on physiological characteristics can improve salt tolerance in crops better than the selection based on the agronomic traits (Tavakkoli
et al. 2012). The objectives of the present study were the
screening of quantitative criteria of salt tolerance and the identification of a contrasting pair of faba bean towards salinity which could improve breeding programs.
Materials and methods
Plant materials: Six Tunisian faba bean genotypes were
chosen in this study to determinate their tolerance to salinity stress (Local, Najeh, Chourouk, Badii, Bachaar, and Saber-02). Among the six tested genotypes, four varieties were developed from crosses performed in Tunisia (INRAT) and released in the National Plant Varieties Catalogue (Badii and Bachaar – 2004, Najeh – 2009, and Chourouk – 2014) (Kharrat et al. 2010, Amri et al. 2019). Both latter varieties are carrying good resistance to the parasitic plants Orobanche crenata and O. foetida (Kharrat et al. 2010, Trabelsi et al. 2016, 2017; Amri et al. 2019). Bean seeds were offered from the National Institute of Agricultural Research (INRAT).
Growth conditions: All experiments were conducted in the
Experimental Station of the Biotechnology Center of Borj Cedria in Tunisia, under controlled greenhouse conditions: the temperature was set at 23°C, the photoperiod was 16/8-h day/night, the relative humidity was between 55 and 65%, and the PAR was 270 μmol(photon) m−2 s−1. Bean seeds
of the identical size were surface-disinfected in HgCl2
(0.1%) for 1 min and then rinsed perfectly using sterilized distilled water. Seeds were then sowed in autoclaved perlite moistened with water to germinate at room temperature (20°C) in dark. Ten days after, germinated seeds were transferred to plastic pots containing half-strength nutrient solution (5 L). Seven days after, comparable size plants were chosen and cultured in full sterilized nutrient solution containing macronutrients KH2PO4 (0.36 mM), K2SO4 (0.7 mM), MgSO4 (1 mM),
CaCl2 (1.65 mM), and KNO3 (24 mM), and micronutrients
H3BO3 (4 µM), CuSO4 (1.56 µM), ZnSO4 (1.55 µM),
CoSO4 (0.12 µM), MnSO4 (6.6 µM), and (Na)2MoO4
(0.12 µM) (Vadez et al. 1996). Full strength sterilized nutrient solutions were weekly changed. The nutrient solu-tion was continuously aerated with airflow of 400 ml min–1
using hydroponic air pump setups.
Salinity treatment: Similar 25-d-old seedlings, when they reached the four-leaf stage, were divided into three groups. Salinity treatments were applied as follows: control (0 mM NaCl), moderate concentration (75 mM NaCl), and severe concentration (150 mM NaCl). Salt stress was gradually
applied by increments of 25 mM NaCl per day (except for the control which is 0 mM NaCl). Salinity was maintained continuously until the final harvest. Nutrient solutions were weekly changed for the control group (without added salt) and treated groups with the appropriate NaCl concentrations. After 21 d of treatments, treated and control plants were harvested separately at the same day. To evaluate the behavior of six genotypes of faba bean under three salinity stress levels (0, 75, and 150 mM), three independent sets of experiments were performed with six plants for each replication (n = 18 plants for each genotype per salinity stress level). All parameters of the control and treated plants were measured at the seedling stage.
Morphological measurements: Three morphological
parameters evaluated on the six faba bean genotypes were the length of the lateral root (LR), length of the shoot (LS), and the number of leaves (NL). The LS and LR were determined by measuring the distance between the crown and the leaf tip [cm] and the crown and the root tip [cm], respectively. The NL was counted.
Relative water content (RWC): At the harvest time, the
leaves were directly weighted to get the fresh mass designed as MF. To obtain the turgid mass (MT), the leaves were weighted after incubation in distilled water for 24 h. Then the saturated leaves were dried for 72 h at 70°C and the dry mass was measured (MD). The RWC was calculated using the following formula (Barrs and Weatherley 1968):
RWC [%] = [(MF/MD)/(MT/MD)] × 100.
Plant biomass: The roots and shoots were collected
separately from each plant. In this study, the mass of fresh root (MFR), the mass of fresh shoot (MFS), and the mass of total fresh plant (MTFP) were measured on the day of the harvest. The mass of dried root (MDR), the mass of dried shoot (MDS), and the mass of total dried plant (MTDP) were assessed after incubation of the samples at 70°C until obtained constant masses.
The photosynthetic gas-exchange parameters, such as
stomatal conductance to water vapor (gs), net CO2
assimila-tion rate (PN), transpiration rate (E), and substomatal CO2
concentration (Ci) were measured using an open type and
portable photosynthesis system (LCA-4, Bio-Scientific, Great Amwell, Herts, UK). The different measurements were captured from the mid-lamina portion of the abaxial surface of the youngest fully expanded leaves on the harvest day. The WUE was measured as the ratio between
PN and E.
Electrolyte leakage: Fragments of 100 mg of the middle
part of the freshly cut leaves were floated on 10 ml of ultrapure water in assay tubes. The first electrical conduc-tivity (EC1) of the solution was measured after incubation of the tubes in a water bath at 32°C for 2 h using a type of conductivity meter, Metrohm 712. Then the tubes were placed in an oven (90°C) for 2 h. The second conductivity (EC2) was measured in the solution after cooling to 25°C. The leakage of electrolyte was measured using the
following formula EL = EC1/EC2 × 100 (Dionisio-Sese and Tobita 1998).
Carotenoids (Car) and chlorophyll (Chl) content: The
Car and Chl contents were calculated using the method of Lichtenthaler (1987). Young leaves (100 mg, freshly cut) were incubated in 5 ml (80%) of acetone at 4°C in darkness until complete Chl extraction. The total contents of different Chls were determined by the measurement of the absorbance (A) at 645, 663, and 470 nm using a UV-visible spectrophotometer (Jenway 6850 UV-Vis,
Cole-Parmer Ltd., UK). The pigment content [expressed
as mg g−1(FM)] was calculated by using the following
equations: Chl a = 12.21 × A663 – 2.81 × A645, Chl b =
20.13 × A645 – 5.03 × A663, total Chl = 6.45 × A663 + 17.72 ×
A645, Car = (1,000 × A470 – 3.27 × Chl a – 104 × Chl b)/227. Relative growth rate (RGR): RGR is an important
indicator of plant strategy related to environmental stress. It was calculated using the method of Hunt (1990). Two harvests were performed. The first was carried out at the time (t1) on the day 25, just before starting the salt
treatment, and the second harvest (t2) was performed on
the day 46 (i.e., 21 d after the salt treatment). Then the average RGR was calculated using the following formula: RGR = (lnMFR2 – lnMFR1)/(t2 – t1), where MFS1 and
MFS2 are the fresh shoot masses, respectively, at t1 and t2. Statistical analysis: The multivariate analysis, analysis of
variance (ANOVA) (XLSTAT software), and clustering were considered to analyze our data. The statistical analysis ‘Principal Component Analysis’ (PCA) was utilized in this study using three sets of data from stressed faba bean plants and their controls. The incorporated matrixes involved 21 parameters in columns and six genotypes in rows. The PCA analysis was carried out to (1) classify the genotype groups, (2) identify genotypes with opposing behavior, and (3) fix the axes and important characters contributing to the diversification. In this work, the different matrixes were used to create the proper eigenvalue and scores for the plants. Then, the plot of two-dimensional scatter was performed. The ranking of faba bean genotypes for the tolerance to salt stress was performed using the selective physiological and morphological parameters under 75 and 150 mM NaCl. All measurements were performed at the
three levels of salinity stress and in three replicates. All
morphological and physiological data in the present study were transformed into indices of salt tolerance according to the method of Zeng et al. (2002). These indices were determined as the observed value under salinity conditions subdivided by the control averages. The percentage of decrease in comparison to control of different parameters was calculated using the formula: The percentage of decrease [%] = [(control value – stressed value)/ (control)] × 100.
The difference between treatment data was estimated using the STATISTICA software and the means of compari-son by HSD (higher significant difference) Duncan's test (p≤0.05).
Results
In the present work, to evaluate the response of six faba bean genotypes under two different salinity concentrations; moderate (75 mM) and severe (150 mM) at the same time as under control conditions, 21 physiological and morphological descriptors were employed. The PCA analysis was performed to discriminate among faba bean genotypes. All the data were converted to relative values,
i.e., salt tolerance index before applying to PCA analysis.
The salt tolerance index was defined as the observation under salinity divided by the means of the controls.
Morphological and physiological response under con- trol conditions: Twenty-one physiological and
morpho-logical parameters were used in the study of the characterization of the response of different genotypes under control conditions (Table 1). Control genotypes were cultivated under identical environmental conditions as the treated genotypes and harvested at the same time without adding NaCl. Fig. 1A showed the PCA plot setup for faba bean plants under control conditions. The first two components counted of 69.9% of the total variation of which principal component 1 (PC1) and 2 (PC2) defined 45.2 and 24.7% of the variation, respectively. The PC1 was extremely correlated to total Chl content (TChl) and PC2 was determined by NL (Fig. 1A). As shown in Table 1, TChl and NL were the top contributing variables to the descriptions of PC1 and PC2 with contribution values of 10.748 and 18.866, respectively. Consequently, these two parameters were used in the genotypic distribution under control conditions. The PCA plot in Fig. 1A revealed three groups. Group 1 included cv. Local and Najeh, which are localized on the positive side of PC1 and PC2 and exhibited high TChl content and NL. Group 2 is formed by cv. Saber-02, Badii, and Bachaar. Finally, Chourouk genotype was situated separately in the negative side of the PC2 (group 3) and was characterized by low NL and TChl. The different behavior of studied genotypes under control conditions was attributed to their varietal effect. Under nonstressed conditions, we noted good discrimination of genotypes according to the NL and TChl content (Table 1, Fig. 1A).
Morphological and physiological response under 75 mM NaCl: All collected data under moderate salinity
condi-tions were converted to relative values using the salt tolerance indices. These indices were determined as the observed value under salinity conditions subdivided by the control averages. All calculated indices were applied to the PCA. Under moderate salt concentration (75 mM), we got different schema of clustering profiles of faba bean genotypes with a distinct response to salinity stress (Fig. 1B). The PC1 and PC2 were sufficient to display the data structure since they explained 64.1% of the total variance (Fig. 1B). The first axis (PC1 = 40.3%) was highly correlated to the NL. The second axis (PC2 = 23.9%) was determined by the WUE. Table 1 showed clearly that at 75 mM, NL and WUE displayed the highest contribution
to the description of PC1 and PC2 among all studied parameters with contribution values of 10.149 and 12.744, respectively. By examining the scores-plot (Fig. 1B) in the
area defined by PC1 and PC2, the samples were separated into four groups based on NL and WUE. Group 1, which is located on the top of the scores-plot, is composed of cv. Najeh. Group 2 is formed by cv. Saber-02 and Badii. Cv. Local appeared in different group (group 3). Finally, group 4 is located in the downstairs position of the scores plot, and consists of cv. Chourouk and Bachaar (Fig. 1B). Since the samples were well described by the scores-plot, the loading plot (Fig. 1B) was analyzed to show which variables influenced the group separation. Najeh genotype, which represented the first class, was characterized by the highest values of WUE and NL. That means that Najeh was able to survive under salinity conditions and can conserve high productivity and photosynthetic activity. However, the second and the third groups displayed moderate values of the same parameters. The last class containing cv. Chourouk and Bachaar was classified as the most sensitive genotypes among the studied genotypes at 75 mM NaCl.
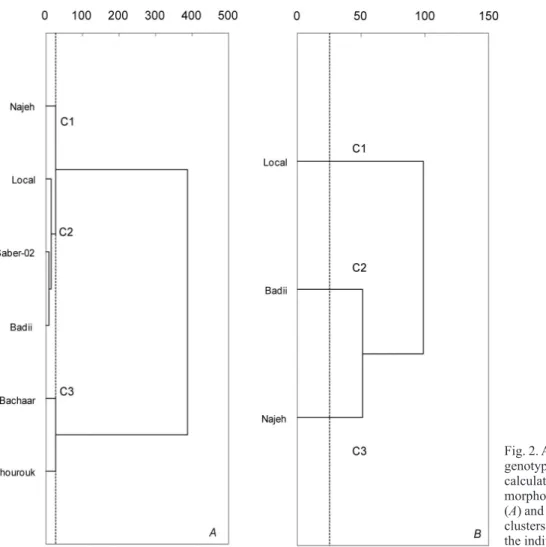
All collected data were submitted to hierarchical cluster analysis to distinguish the six faba bean genotypes studied under 75 mM NaCl. This technique produces a hierarchy of partitions of objects such that any cluster of a partition is fully included one of the clusters of the later partitions. Such partitions are best represented by a dendrogram. The results as a dendrogram in Fig. 2A, which indicates
that the samples are distributed in three major clusters: C1 (cv. Najeh), C2 (cv. Local, Saber, and Badii), and C3 (cv. Bachaar and Chourouk).
Morphological and physiological response under 150 mM NaCl: All measured parameters under severe
salinity conditions were collected and adopted to relative values (salt tolerance indices). These indices were calcu-lated as the observed value under 150 mM NaCl subdivided by the control averages (0 mM NaCl). All determined indices were applied to the PCA. PCA provides a graphical representation of variable (loading-plot) and inter-sample (scores-plot) (Fig. 1C) relationships and provides a way to reduce the complexity of the data. The total
variance of principal components PC1 and PC2 was 100%, as revealed the plot of PCA at 150 mM (Fig. 1C). The PC1 (76.6%) was defined by the MFR since it exhibited the maximum value for the description of this axe (6.097) (Table 1, Fig. 1C). The PC2 (23.4%) was highly correlated to the Ci because this parameter presented the higher
value of the contribution to the description of this axe (15.852) (Table 1, Fig. 1C). A different schema of PCA was recorded. Three genotypes out of six did not tolerate this severe salt concentration which caused their death. These genotypes were Chourouk, Saber-02, and Bachaar. By examining the scores-plot in the area defined by PC1 and PC2, the survived genotypes were separated into three groups, based on their MFR and Ci. Group 1, located on
Table 1. Physiological and morphological characteristics observed with their contributions to the description of PC1 and PC2 of the statistical analysis PCA under 0, 75, and 150 mM of NaCl concentrations.
Characteristics NaCl [mM]
0 75 150
PC1 PC2 PC1 PC2 PC1 PC2
Mass of the fresh root (MFR) 8.475 0.270 7.274 2.813 6.097 0.389 Mass of fresh shoot (MFS) 8.255 2.536 6.809 5.348 4.496 5.631 Mass of total fresh plant (MTFP) 8.764 0.973 8.224 4.576 2.313 12.779 Mass of the dry root (MDR) 4.895 1.230 3.439 0.535 6.034 0.596
Mass of dry shoot (MDS) 5.977 0.085 2.332 4.838 5.785 1.413
Mass of total dry plant (MTDP) 4.827 0.194 4.912 0.226 4.863 4.432
Length of the root (LR) 0.324 5.966 2.845 0.003 5.731 1.589
Length of the shoot (LS) 4.226 0.869 4.983 8.221 5.226 3.241
Number of leaves (NL) 0.001 18.866 10.149 0.166 5.981 0.771
Relative water content (RWC) 0.073 6.864 4.385 0.647 2.772 11.279
Electrolyte leakage (EL) 8.435 0.898 3.565 0.005 5.441 2.538
Net CO2 assimilation (PN) 0.840 14.708 3.273 5.010 3.507 8.869
Stomatal conductance (gs) 2.087 7.504 7.226 4.901 4.117 6.875
Transpiration (E) 0.183 2.495 5.825 7.180 5.778 1.436
Substomatal CO2 concentration (Ci) 0.188 18.833 1.316 7.503 1.375 15.852
Photosynthetic water-use efficiency (WUE) 1.154 16.168 0.283 12.744 1.613 15.072
Chlorophyll a (Chl a) 10.616 0.577 5.682 9.552 6.023 0.633
Chlorophyll b (Chl b) 10.624 0.002 3.898 9.461 5.959 0.844
Total chlorophyll 10.748 0.344 5.412 9.847 6.007 0.685
Carotenoids (Car) 9.306 0.620 7.895 4.352 5.611 1.981
Fig. 1. Plots from the PCA demonstrating the contribution of the 21 morphological and physiological parameters to the variation to different axis and the grouping of faba bean genotypes under control conditions (A), 75 mM (B), and 150 mM (C) of NaCl according to PC1 and PC2.
the bottom of the scores-plot, and correlated negatively to both PC1 and PC2, consisted of Local genotype. This group was characterized by the lowest values of MFR and Ci.
Group 2, located on the bottom of the scores-plot, and correlated positively to PC1 and negatively to PC2, included Badii genotype. The last group (group 3), loca-ted on the right-side of the scores-plot, and correlaloca-ted positively to PC1 and PC2, included Najeh. This group was characterized by having the highest MFR and Ci. Thus, the
Najeh genotype was able to conserve productivity and high photosynthetic activity at the severe salt stress. Regarding the dendogram (Fig. 2B), the genotypes were grouped into three clusters: C1 (cv. Local), C2 (cv. Badii), and C3 (cv. Najeh). Therefore, the results obtained from this evaluation allow to conclude that these parameters, i.e., MFR and Ci
could be used as the discriminating parameters for the screening of genotypes under salinity stress.
Correlation between the studied variables at 75 mM:
Correlations were analyzed to study the relations between the different variables examined at 75 mM NaCl. Table 2 showed the coefficients of the Pearson's correlation between all assays carried out on faba bean genotypes. The present study demonstrated a good correlation between the MTFP and MFS (r = 0.943) (Table 2). Also, we detected
a significant positive correlation between the TChl and Chl a contents (r = 0.999) (Table 2). However, we noticed a significant negative correlation between the LS and Ci
(r = –0.888) (Table 2). Besides, we observed a poor or no correlation between the WDR and the content of Car (r = 0.005) (Table 2).
Correlation between the studied variables at 150 mM:
Table 3 recapitulated the coefficients of the Pearson's correlation between all analysis evaluated at 150 mM. We found a good correlation between the RGR and MFR (r = 0.988) (Table 3). A significant correlation was also revealed between the EL and E (r = 0.996) (Table 3). Never-theless, a negative correlation was also noticed between the content of Chl a and MFR (r = –0.950) (Table 3).
Classification of genotypes toward salinity stress at 75 mM NaCl: To classify the studied genotypes toward
salinity stress, the most selective physiological descriptors were considered for the valuation of the physiological behavior of faba bean genotypes at 75 mM NaCl. Thus NL and WUE (parameters presented the maximum contri-bution to the description of PC1 and PC2, respectively, as described in Table 1) were employed for the classification of all genotypes for the tolerance to salt stress using
Fig. 2. Analysis of a cluster of faba bean genotypes based on the Euclidean metric calculating using 21 physiological and morphological parameters under 75 mM (A) and 150 mM (B) NaCl. The different clusters C1, C2, and C3 correspond to the individualized groups.
Table 2.
Pearson
's correlation coefficients (
r) among the analyzed parameters at 75 mM of NaCl. For explanation of the abbreviations
see T able 1. MFS MFR MTFP MDS MDR MTDP NL LS LR RW C Ci gs E Chl a Chl b Total Chl EL WUE PN RGR Car MFS 1 MFR 0.612 1 MTFP 0.943 0.780 1 MDS 0.787 0.207 0.593 1 MDR 0.339 0.256 0.488 0.237 1 MTDP 0.725 0.299 0.526 0.800 0.035 1 NL 0.776 0.784 0.900 0.298 0.550 0.443 1 LS 0.703 0.846 0.817 0.523 0.440 0.295 0.626 1 LR 0.312 0.500 0.235 0.189 –0.431 0.658 0.314 0.161 1 RW C –0.568 –0.556 –0.451 –0.489 0.288 –0.835 –0.425 –0.350 –0.946 1 Ci –0.328 –0.695 –0.461 –0.315 –0.264 –0.029 –0.250 –0.888 –0.079 0.193 1 gs 0.362 0.441 0.506 –0.045 0.629 0.264 0.815 0.175 0.190 –0.181 0.137 1 E 0.341 0.174 0.387 0.150 0.678 0.413 0.653 0.030 0.106 –0.148 0.276 0.919 1 Chl a 0.095 0.356 0.228 –0.1 14 0.550 0.260 0.572 0.084 0.303 –0.233 0.058 0.884 0.866 1 Chl b –0.074 0.384 0.054 –0.273 0.235 0.213 0.417 0.001 0.525 –0.371 0.036 0.723 0.649 0.928 1 Total Chl 0.068 0.350 0.204 –0.138 0.536 0.241 0.552 0.072 0.305 –0.226 0.057 0.873 0.851 0.999 0.937 1 EL –0.712 –0.034 –0.512 –0.843 –0.357 –0.865 –0.416 –0.193 –0.21 1 0.452 –0.131 –0.334 –0.582 –0.243 –0.026 –0.217 1 WUE 0.333 0.689 0.493 0.060 –0.013 –0.203 0.288 0.758 0.027 –0.091 –0.790 –0.201 –0.492 –0.350 –0.289 –0.350 0.381 1 PN 0.521 0.824 0.754 0.026 0.392 –0.1 13 0.718 0.782 –0.009 –0.064 –0.615 0.361 0.051 0.100 0.024 0.091 0.167 0.826 1 RGR 0.599 –0.035 0.389 0.468 –0.296 0.560 0.267 –0.069 0.282 –0.420 0.410 0.021 0.068 –0.301 –0.362 –0.323 –0.560 –0.086 –0.026 1 Car 0.256 0.607 0.382 0.005 0.405 0.410 0.664 0.301 0.562 –0.508 –0.162 0.81 1 0.729 0.936 0.939 0.936 –0.237 –0.1 17 0.241 –0.234 1
percentage decrease values (Fig. 3) and indices of salt tolerance (Table 4). The percentage decrease was calculated as the difference between control and stressed values. Then, the obtained value was divided by the control number and multiplied by 100 as explained in the materials and methods section. Genotypes showing the highest percentage decrease are considered as the most sensitive to salt stress. However, the most tolerant plant exhibited the highest value of salt tolerance indices.
Our results demonstrated that salt stress had a harmful effect on the development of plants. The indices of salt tolerance diminish with the augmentation of the salt concentration. In addition, these indices changed among faba bean genotypes (Table 4). The indices of salt tolerance of WUE varied between 0.366 for Chourouk and 0.944 for Najeh. Besides, the indices of salt tolerance of NL ranged from 0.742 for Chourouk to 0.945 for Najeh. Najeh was selected as the most tolerant plant because it exhibited the highest value of salt tolerance indices. Fig. 3 shows the percentage decrease of WUE and NL relative to their control at 75 mM NaCl. The results showed a diminution from 63.4 to 5.6% for WUE (Fig. 3A) and from 25.8 to 5.5% for NL (Fig. 3B). The most sensitive genotypes were characterized by the highest percentage decrease. A significant fluctuation was registered between the studied genotypes. The use of Duncan's test for the WUE allowed us to classify the analyzed genotypes into five groups. Faba bean genotype noted as (a) was considered as the most sensitive one. However, the plant indicated as (e) was believed to be the most tolerant one. The rest were considered as intermediate (Fig. 3A). The selection based on NL percentage decrease divided the genotypes into four groups (Fig. 3B). Genotypes mentioned with the letter (a) were classified as the most altered by the salinity stress. Nevertheless, plants noted with the letter (d) were considered as the best genotypes which surmount these conditions (Fig. 3B).
Classification of genotypes toward salinity stress at 150 mM NaCl: The percentage decrease and the indices
of salt tolerance of the most discriminating descriptors were used for the evaluation of the response of faba bean genotypes at 150 mM NaCl (Table 4, Fig. 4). The MFR and
Ci were considered for the classification of different
geno-types (parameters presented the maximum contributions to the description of PC1 and PC2, respectively, as shown in Table 1) at 150 mM. Chourouk, Bachaar, and Saber-02 genotypes did not survive the severe concentration of salt and they died after 10 d of the treatment. The indices of salt tolerance of MFR varied between 0.431 for Local and 0.799 for Najeh (Table 4). Moreover, the salt tolerance indices for Ci ranged from 0.329 for Local to 0.456 for
Najeh (Table 4). Fig. 4 illustrated the decrease of the percentage of MFR and Ci relative to their control at
150 mM. The data demonstrated a decrease from 79.9 to 43.1% for MFR and from 67.1 to 54.4% for Ci (Fig. 4).
A significant fluctuation was revealed between different genotypes. The statistical analysis based on the Duncan's test for MFR allowed dividing the genotypes into three groups. The genotype designated by the letter (a) was
considered as the most affected by this severe NaCl concentration. However, the genotype noted by the letter (c) was considered as the most tolerant one (Fig. 4A). The distribution based on Ci percentage decrease (Fig. 4B)
subdivided the genotypes into three groups. The most sensitive genotype was mentioned with the letter (a), whereas, the genotype indicated by the letter (c) was considered the most tolerant one.
Identification of faba bean genotypes pair by contrasting behavior towards salinity: Our results involving the
indices of salt tolerance (Table 4) and the percentage decrease (Fig. 3) revealed that Chourouk genotype was the most sensitive among the studied genotypes at 75 mM NaCl. Moreover, the analysis of the PCA demonstrated that Najeh genotype was the most tolerant one. Also, the experiment performed at 150 mM NaCl confirmed that Najeh was the best genotype which surmounted a severe salt concentration (Fig. 4). This result was approved by the PCA analysis in Fig. 1B, where Najeh and Chourouk genotypes were diametrically opposite. Taken together, these data revealed that the pair of faba bean genotypes selected according to contrasting behavior toward salinity stress was Najeh and Chourouk. Consequently, the multi-variate analysis PCA seems to be an efficient tool for the discrimination between the genotypes with contrasting behavior towards salinity.
Discussion
The absence of any effective evaluation method for salt tolerance in the process of screening can be one problem of the conventional method for salt-tolerance breeding. This experiment was carried out to identify morphologic and physiologic parameters which can be used to appraise tolerance to salinity and evaluate genotypes for relative salt tolerance by multiple parameters at the seedling stage using multivariate analysis. In this experiment, a significant genotypic variation was recorded for salinity tolerance which was evaluated using six faba bean genotypes in hydroponics based on 21 physiological and morphological traits at different salt concentrations (moderate and severe). To manage this situation, it is important to use the percentage decrease or tolerance indices in relation to the control average for genotype classification. Many studies used salt tolerance indices and biplot analysis to screen stress-tolerant genotypes (Mitra 2001, Farshadfar and Sutka 2002, Mohammadi et al. 2010, Gholinezhad et al. 2014). In general, the salt tolerance indexes were reduced in salt-sensitive genotypes with increasing salinity. In order to analyze deeply the different salt tolerance response of the studied genotypes, we further used the salt tolerance indices to distinguish between contrasting genotypes. A cluster analysis was used in this study to facilitate the evaluation of salt tolerance among genotypes. The major advantages of the utilization of a multivariate analysis are the allowance of a simultaneous analysis on multiple parameters and the increase of the accuracy in the rankings of genotypes. Another advantage is the convenience to rank genotypes when plants are evaluated
Table 3.
Pearson
's correlation coefficients (
r) among the analyzed parameters at 150 mM of NaCl. For explanation of the abbreviations see
Table 1. MFS MFR MTFP MDS MDR MTDP NL LS LR RW C Ci gs E Chl a Chl b Total Chl EL WUE PN RGR Car MFS 1 MFR –0.915 1 MTFP 0.936 –0.714 1 MDS 0.959 –0.992 0.797 1 MDR 0.748 –0.952 0.465 0.905 1 MTDP 0.998 –0.940 0.909 0.976 0.792 1 NL 0.732 –0.945 0.444 0.895 1.000 0.777 1 LS –0.570 0.853 –0.243 –0.779 –0.972 –0.625 –0.977 1 LR –0.964 0.990 –0.807 –1.000 –0.898 –0.980 –0.887 0.769 1 RW C –0.176 0.558 0.183 –0.448 –0.785 –0.243 –0.800 0.909 0.433 1 Ci 0.064 0.344 0.412 –0.221 –0.614 –0.004 –0.633 0.783 0.205 0.971 1 gs 0.998 –0.886 0.957 0.938 0.702 0.991 0.685 –0.514 –0.944 –0.1 11 0.130 1 E 0.960 –0.992 0.799 1.000 0.904 0.977 0.894 –0.778 –1.000 –0.446 –0.219 0.939 1 Chl a 0.744 –0.950 0.461 0.903 1.000 0.788 1.000 –0.973 –0.896 –0.789 –0.619 0.699 0.902 1 Chl b 0.726 –0.942 0.436 0.891 0.999 0.771 1.000 –0.979 –0.883 –0.805 –0.640 0.678 0.890 1.000 1 Total Chl 0.740 –0.948 0.454 0.900 1.000 0.784 1.000 –0.975 –0.893 –0.793 –0.624 0.693 0.899 1.000 1.000 1 EL 0.981 –0.975 0.851 0.996 0.861 0.992 0.849 –0.717 –0.997 –0.362 –0.128 0.967 0.996 0.859 0.844 0.855 1 WUE 0.019 0.386 0.371 –0.265 –0.649 –0.049 –0.667 0.810 0.249 0.981 0.999 0.086 –0.263 –0.653 –0.674 –0.659 –0.173 1 PN –0.292 0.653 0.065 –0.551 –0.853 –0.356 –0.865 0.952 0.537 0.993 0.936 –0.228 –0.549 –0.856 –0.870 –0.860 –0.470 0.951 1 RGR 0.988 –0.966 0.871 0.991 0.840 0.996 0.827 –0.689 –0.993 –0.324 –0.089 0.976 0.991 0.838 0.822 0.834 0.999 –0.133 –0.434 1 Car 0.644 –0.898 0.332 0.834 0.989 0.695 0.993 –0.996 –0.825 –0.867 –0.722 0.592 0.833 0.990 0.994 0.991 0.779 –0.752 –0.920 0.753 1
at different salt concentrations, e.g., moderate and high salt contents. Using multivariate analysis, we could select faba bean genotypes with contradictory behavior towards salinity. In Tunisia, faba bean is among the most valuable grain legume pulses (Kharrat and Ouchari 2011). Salinity is one of the major obstacles to increasing crop production worldwide. It becomes the principal abiotic stress that negatively affects faba bean during the vegetative and reproductive phases and definitely at grain production
(Ali et al. 2013, Nouairi et al. 2019). The data of our study showed wide genotypic differences in response to salinity (Fig. 1). Tavakkoli et al. (2012) reported that the genotypic variation is determined by the concentration of salt. The most useful indices for evaluating tolerance to salinity stress in faba bean at 75 mM NaCl were NL (biomass) and WUE (photosynthesis) exhibiting the highest contribution to the description of PC1 and PC2 (12.744 and 10.149, respectively; Table 1). At 150 mM NaCl, the two major parameters for the axes of the PCA plot were MFR (biomass) and Ci (photosynthesis). Similar
results were found by Shafi et al. (2009) and Mahlooji
et al. (2018), confirming that biomass and photosynthetic
parameters were affected less in tolerant genotypes than those in sensitive ones. Salinity leads to osmotic effect which caused the augmentation of abscisic acid (inhibitor of growth), decrease in gibberellins (promoters of growth) and indole-3-acetic acid, and disturbed water balance. These problems contribute to ionic imbalance, the closing of stomata, and reduction in the photosynthetic enzymatic process which affects the growth of the plant (Semida
et al. 2014). Therefore, the decrease in plant growth might
be due to salinity-induced toxicity on photosynthetic apparatus and structural alterations in plants (Nouairi
et al. 2019). According to our results, tolerant faba bean
genotypes were capable to conserve their photosynthesis and biomass and therefore surmount salinity conditions. Photosynthetic and biomass parameters were considered as the most discriminating features to classify faba bean genotypes. A similar study showed that tolerant cultivars of barley had gas-exchange traits unmodified or less affected under salinity stress (Mahlooji et al. 2018). In this study, significant fluctuations occurred in PN, E, and
Ci under stress conditions. Similar results were reported
by Sikder et al. (2015). These authors confirmed that salinity conditions clearly reduced gas-exchange features, such as PN, E, and Ci, in studied genotypes. CO2-exchange
characteristics have been considered as a crucial indicator of plant growth, due to their direct relation to productivity (Ashraf 2004). The rate of the uptake of CO2 and water loss
via leaf stomata were affected by stomatal conductance.
As well, the reduction in gas exchange might be attributed to toxic ions that affect electron photosynthetic transport and metabolism of carbon (Pirasteh-Anosheh et al. 2016). Recent study demonstrated that the gs showed a high
and substantial variation among rice cultivars under environmental conditions proposing that the photosynthetic characteristics can be good parameters to be used in rice breeding (Qu et al. 2017). Our results indicated that tolerant genotypes exhibited conservation of WUE during the salt treatment. In the same way, Bidalia et al. (2017) confirmed that the preservation of WUE can help Mitragyna
parvifolia to surmount salinity stress. The same results
were obtained by Ben Chikha et al. (2016) suggesting that biomass and photosynthetic parameters, especially total fresh mass and net CO2 assimilation, can be applied
as suitable descriptors to assess salt tolerance in barley. Our results were also in agreement with those of Agastan
et al. (2000), Huang et al. (2015), and Li et al. (2013), who
proved that photosynthetic capacity is an important trait for
Table 4. Indices of tolerance to salt stress calculated from the most selective parameters in faba bean genotypes treated with 75 and 150 mM of NaCl. The salt tolerance index was defined as the observations under salinity divided by the means of the controls.
Ci – substomatal CO2 concentration; MFR – mass of fresh root,
NL – number of leaves; WUE – water-use efficiency.
Genotypes 75 mM NaCl 150 mM NaCl
WUE NL MFR Ci Chourouk 0.366 0.742 - -Saber-02 0.655 0.779 - -Bachaar 0.674 0.850 - -Badii 0.779 0.843 0.646 0.386 Local 0.854 0.937 0.431 0.329 Najeh 0.944 0.945 0.799 0.456
Fig. 3. The water-use efficiency (WUE) percentage decrease (A) and the number of leaves (NL) percentage decrease (B) at 75 mM of NaCl. All values are means ± SD. The data followed by
the plant to tolerate salt stress. Considering biomass and photosynthetic parameters, we could select pair genotypes with contradictory behavior to salinity which is Najeh as tolerant and Chourouk as sensitive. Our research suggests that Najeh genotype should be introduced in a cross breeding program as an elite salt-tolerant germplasm. The use of multivariate analysis is a powerful tool to identify a pair of faba bean genotypes with contrasting responses to salinity. Our findings suggested that screening for tolerance to salt conditions can be based on physiological and photosynthetic markers. We could prove here the presence of genetic potential for tolerance to salt tress among faba bean genotypes. Tolerant genotypes can tolerate a severe concentration of salt up to 150 mM NaCl for a long period. The identified parameters and evaluation method for salt tolerance can then be applied to breeding practices under field conditions.
Conclusions: Taken together, the overall results from
this research suggest that salinity stress significantly inhibited the growth traits as well as the photosynthetic parameters in faba bean seedlings, especially at the higher concentration. Wide genotypic differences were observed for relative salt tolerance in terms of photosynthesis and biomass. The WUE, Ci, MFR, and NL were the
most contributing to the variations among investigated parameters. Genotypic differences were also identified in
Fig. 4. The mass of fresh root (MFR) percentage decrease (A) and the substomatal CO2 concentration (Ci) percentage decrease
(B) at 150 mM of NaCl. All values are means ± SD. The data followed by different letters are significantly different at p≤0.05.
other studied parameters, but those characteristics were not strictly correlated with relative salt tolerance among genotypes. Only one genotype, Najeh, was identified as the most tolerant under moderate and severe salt stress, while we observed the high susceptibility and dramatic changes in salt tolerance associated traits in cv. Chourouk at the seedling stage. The use of cluster group ranking of genotypes based on multiple morphologic and physiologic characters can be applied in salt tolerance breeding to evaluate salt tolerance among genotypes with a great advantage over conventional methods.
References
Agastan P., Kingsley S.J., Vivekanandan M.: Effect of salinity on photosynthesis and biochemical characteristics in mulberry genotypes. – Photosynthetica 38: 287-290, 2000.
Ali H.M., Siddiqui M.H., Al-Whaibi M. et al.: Effect of proline and abscisic acid on the growth and physiological performance of faba bean under water stress. – Pak. J. Bot. 45: 933-940, 2013.
Almodares A., Hadi M.R., Dosti B.: The effect of salt stress on growth parameters and carbohydrates contents in sweet sorghum. – Res. J. Environ. Sci. 2: 298-304, 2008.
Amri M., Trabelsi I., Abbes Z., Kharrat M.: Release of a new faba bean variety "Chourouk" resistant to the parasitic plants
Orobanche foetida and O. crenata in Tunisia. – Int. J. Agric.
Biol. 21: 499-505, 2019.
Ashraf M.: Some important physiological selection criteria for salt tolerance in plants. – Flora 199: 361-376, 2004.
Ashraf M.: Biotechnological approach of improving plant salt tolerance using antioxidants as markers. – Biotechnol. Adv. 27: 84-93, 2009.
Barrs C., Weatherley P.E.: A re-examination of the relative turgidity technique for estimating water deficit in leaves. – Aust. J. Biol. Sci. 15: 413-428, 1968.
Ben Chikha M., Hessini K., Nefissi Ourteni R. et al.: Identification of barley landraces genotypes with contrasting salinity tolerance at vegetative growth stage. – Plant Biotechnol. 33: 287-295, 2016.
Bidalia A., Hanief M., Rao K.S.: Tolerance of Mitragyna
parvifolia (Roxb.) Korth seedlings to NaCl salinity. –
Photosynthetica 55: 231-239, 2017.
Dionisio-Sese M.L., Tobita S.: Antioxidant responses of rice seedlings to salinity stress. – Plant Sci. 135: 1-9, 1998. Farshadfar E., Sutka J.: Screening drought tolerance criteria in
maize. – Acta Agron. Hung. 50: 411-416, 2002.
Gasim S., Hamad S.A.A., Abdelmula A., Ahmed I.A.M.: Yield and quality attributes of faba bean inbred lines grown under marginal environmental conditions of Sudan. – Food Sci. Nutr. 3: 539-547, 2015.
Gholinezhad E., Darvishzadeh R., Bernousi R.: Evaluation of drought tolerance indices for selection of confectionery sunflower (Helianthus anuus L.) landraces under various environmental conditions. – Not. Bot. Horti. Agrobo. 42: 187-201, 2014.
Huang C.J., Wei G., Jie Y.C. et al.: Responses of gas exchange, chlorophyll synthesis and ROS-scavenging systems to salinity stress in two ramie (Boehmeria nivea L.) cultivars. – Photosynthetica 53: 455-463, 2015.
Hunt R.: Basic Growth Analysis. Plant Growth Analysis for Beginners. Pp. 112. Springer, Dordrecht 1990.
James R.A., Blake C., Byrt C.S., Munns R.: Major genes for Na+ exclusion, Nax1 and Nax2 (wheat HKT1;4 and HKT1;5),
decrease Na+ accumulation in bread wheat leaves under saline
and waterlogged conditions. – J. Exp. Bot. 62: 2939-2947, 2011.
Kafi M.: The effects of salinity and light on photosynthesis, respiration and chlorophyll fluorescence in salt-tolerant and salt sensitive wheat (Triticum aestivum L.) cultivars. – J. Agr. Sci. Tech. 11: 535-547, 2009.
Kharrat M., Abbes Z., Amri M.: A new faba bean small seeded variety Najeh tolerant to Orobanche registered in the Tunisian catalogue. – Tunis. J. Plant Protect. 5: 125-130, 2010. Kharrat M., Ouchari H.: Faba bean status and prospects in
Tunisia. – Grain Legumes 56: 11-12, 2011.
Kumari S.G., van Leur J.A.G.: Viral diseases infecting faba bean (Vicia faba L.). – Grain Legumes 56: 24-26, 2011.
Li J.Y., Zhao C.Y., Li J. et al.: Growth and leaf gas exchange in
Populus euphratica across soil water and salinity gradients. –
Photosynthetica 51: 321-329, 2013.
Lichtenthaler H.K.: Chlorophylls and carotenoids: Pigments of photosynthetic biomembranes. – Method. Enzymol. 148: 350-382, 1987.
Link W., Abdelmula A.A., Von Kittlitz E. et al.: Genotypic variation for drought tolerance in Vicia faba. – Plant Breeding 118: 477-484, 1999.
Mahlooji M., Seyed Sharifi R., Razmjoo J. et al.: Effect of salt stress on photosynthesis and physiological parameters of three contrasting barley genotypes. – Photosynthetica 56:
549-556, 2018.
Mitra J.: Genetics and genetic improvement of drought resistance in crop plants. – Curr. Sci. India 80: 758-762, 2001.
Mohammadi R., Armion M., Kahrizi D., Amri A.: Efficiency of screening techniques for evaluating durum wheat genotypes under mild drought conditions. – Int. J. Plant Prod. 4: 11-24, 2010.
Munns M., James R.A.: Screening methods for salinity tolerance: a case study with tetraploid wheat. – Plant Soil 253: 201-218, 2003.
Munns R., Tester M.: Mechanisms of salinity tolerance. – Annu. Rev. Plant Biol. 59: 651-681, 2008.
Nouairi I., Jalali K., Zribi F. et al.: Seed priming with calcium chloride improves the photosynthesis performance of faba bean plants subjected to cadmium stress. – Photosynthetica 57: 438-445, 2019.
Pirasteh-Anosheh H., Ranjbar G., Pakniyat H. et al.: Physiological
mechanisms of salt stress tolerance in plants: An overview. – In: Mahgoub Azooz M., Ahmad P. (ed.): Plant-Environment Interaction: Responses and Approaches to Mitigate Stress. Pp. 141-160. John Wiley & Sons, Ltd., Chichester 2016. Qu M., Zheng G., Hamdani S. et al.: Leaf photosynthetic parameters
related to biomass accumulation in a global rice diversity survey. – Plant Physiol. 175: 248-258, 2017.
Semida W.M., Taha R.S., Abdelhamid M.T., Rady M.M.: Foliar-applied ɑ-tocopherol enhances salt-tolerance in Vicia faba L. plants grown under saline conditions. – S. Afr. J. Bot. 95: 24-31, 2014.
Shafi M., Bakht J., Hassan M.J. et al.: Effect of cadmium and salinity stresses on growth and antioxidant enzymes activity of wheat genotypes. –B. Environ. Contam. Tox. 82: 772-776, 2009.
Sikder S., Foulkes J., West H. et al.: Evaluation of photosynthetic potential of wheat genotypes under drought condition. – Photosynthetica 53: 47-54, 2015.
Tavakkoli I., Paull J., Rengasamy P., McDonald G.K.: Comparing genotypic variation in faba bean (Vicia faba L.) in response to salinity in hydroponic and field experiments. –Field Crop. Res. 127: 99-108, 2012.
Tewodros T.N., Asfaw A., Getachew T. et al.: Evaluation of Faba bean (Vicia faba L.) varieties against chocolate spot (Botrytis
fabae) in North Gondar, Ethiopia. – Afr. J. Agr. Res. 10: 2984-2988, 2015.
Trabelsi I., Abbes Z., Amri M. et al.: Study of some resistance mechanisms to Orobanche spp. infestation in faba bean (Vicia
faba L.) breeding lines in Tunisia. – Plant Prod. Sci. 19: 562-573, 2016.
Trabelsi I., Yoneyama K., Abbes Z. et al.: Characterization of strigolactones produced by Orobanche foetida and
Orobanche crenata resistant faba bean genotypes and effect
of phosphorous, nitrogen, and potassium deficiencies on strigolactone production. – S. Afr. J. Bot. 108: 15-22, 2017. Vadez V., Rodier F., Payre H., Drevon J.J.: Nodule permeability
to O2 and nitrogenase-linked respiration in bean genotypes
varying in the tolerance of N2 fixation to P deficiency. – Plant
Physiol. Bioch. 34: 871-878, 1996.
Zeng L., Shannon M.C., Grieve C.M: Evaluation of salt tolerance in rice genotypes by multiple agronomic parameters. – Euphytica 127: 235-245, 2002.