HAL Id: lirmm-00618055
https://hal-lirmm.ccsd.cnrs.fr/lirmm-00618055
Submitted on 31 Aug 2011
HAL is a multi-disciplinary open access
archive for the deposit and dissemination of
sci-entific research documents, whether they are
pub-lished or not. The documents may come from
teaching and research institutions in France or
abroad, or from public or private research centers.
L’archive ouverte pluridisciplinaire HAL, est
destinée au dépôt et à la diffusion de documents
scientifiques de niveau recherche, publiés ou non,
émanant des établissements d’enseignement et de
recherche français ou étrangers, des laboratoires
publics ou privés.
Evolutionary Process of a Tetranucleotide Microsatellite
Locus in Acipenseriformes
Zhaojun Shao, Eric Rivals, Na Zhao, Sovan Lek, Jianbo Chang, Patrick
Berrebi
To cite this version:
Zhaojun Shao, Eric Rivals, Na Zhao, Sovan Lek, Jianbo Chang, et al.. Evolutionary Process of a
Tetranucleotide Microsatellite Locus in Acipenseriformes. Journal of Genetics, Indian Academy of
Sciences, 2011, 90 (2), pp.217-227. �10.1007/s12041-011-0055-0�. �lirmm-00618055�
RESEARCH ARTICLE
Evolutionary process of a tetranucleotide microsatellite locus
in Acipenseriformes
ZHAO JUN SHAO1,3,4∗, ERIC RIVALS2, NA ZHAO1, SOVAN LEK3, JIANBO CHANG1and PATRICK BERREBI4 1Institute of Hydroecology, Ministry of Water Resources, Chinese Academy of Sciences, Wuhan 430079, People’s Republic of
China
2Methods and Algorithms for Bioinformatics, L.I.R.M.M., UMR 5506 CNRS - Université de Montpellier II, CC 477, 161 rue Ada, F-34095 Montpellier Cedex 5, France
3Ichthyology and Ecological Modelling, UMR 5174 - Lab. EDB (Evolution Diversité Biologique), University of Paul Sabatier – CNRS, 31062 Toulouse Cedex 4, France
4Institut des Sciences de l’Evolution (UMR UM2-CNRS 5554) University Montpellier II, cc 065. Place E. Bataillon 34095 Montpellier Cedex 5, France
Abstract
The evolutionary dynamics of the tetra-nucleotide microsatellite locus Spl-106 were investigated at the repeat and flanking sequences in 137 individuals of 15 Acipenseriform species, giving 93 homologous sequences, which were detected in 11 out of 15 species. Twenty-three haplotypes of flanking sequences and three distinct types of repeats, type I, type II and type III, were found within these 93 sequences. The MS-Align phylogenetic method, newly applied to microsatellite sequences, permitted us to understand the repeat and flanking sequence evolution of Spl-106 locus. The flanking region of locus Spl-106 was highly conserved among the species of genera Acipenser, Huso and Scaphirhynchus, which diverged about 150 million years ago (Mya). The rate of flanking sequence divergence at the microsatellite locus Spl-106 in sturgeons is between 0.011% and 0.079% with an average at 0.028% per million years. Sequence alignment and phylogenetic trees produced by MS-Align showed that both the flanking and repeat regions can cluster the alleles of different species into Pacific and Atlantic lineages. Our results show a synchronous evolutionary pattern between the flanking and repeat regions. Moreover, the coexistence of different repeat types in the same species, even in the same individual, is probably due to two duplication events encompassing the locus Spl-106 that occurred during the divergence of Pacific lineage. The first occured before the diversification of Pacific species (121–96 Mya) and led to repeat types I and II. The second occurred more recently, just before the speciation of
A. sinensis and A. dabryanus (69–10 Mya), and led to repeat type III. Sequences in the same species with different repeat
types probably corresponds to paralogous loci. This study sheds a new light on the evolutionary mechanisms that shape the complex microsatellite loci involving different repeat types.
[Shao Z. J., Rivals E., Zhao N., Lek S., Chang J. and Berrebi P. 2011 Evolutionary process of a tetranucleotide microsatellite locus in Acipenseriformes. J. Genet. 90, 217–227]
Introduction
Microsatellites are tandemly repeated short sequences widely dispersed throughout most eukaryotic genomes. Because of their highly polymorphic allele size caused by changes in repeat number, microsatellites are very popular genetic mark-ers in population genetics and other evolutionary studies (Goldstein and Schlötterer1999). However, the evolution of microsatellites themselves needs to be investigated, because the molecular mechanisms that generate microsatellites is not
∗For correspondence. E-mail: [email protected].
completely understood. There are several ways to examine the evolutionary process of microsatellites.
Theoretically, some mutational models have been pro-posed, i.e. (i) the infinite allele model (IAM; Kimura and Crow 1964), which assumes that microsatellite mutations may create an infinite number of repeated units and allelic states not present in the population; (ii) the stepwise mutation model (SMM; Kimura and Ohta1978), in which microsatel-lite mutations have the same probability of gaining or los-ing one repeat unit; (iii) the generalized stepwise model (GSM) or two phase model (TPM; Di Rienzo et al.1994), an
Keywords. microsatellite evolution; homologous sequences; sturgeon phylogeny; sequence alignment; tandem repeat alignment;
extension of the SMM model considering the probability for a microsatellite mutation to involve more than one unit; (iv) the K-allele model (KAM; Crow and Kimura1970), where there are K allelic states and equal probabilities to mutate towards any of the other K-1 alleles.
Another straightforward and conclusive way of investiga-tion is by direct observainvestiga-tion of microsatellites in pedigrees. For example, Messier et al. (1996), mapped microsatellite sequences onto a phylogeny, and revealed the ‘birth’ of two microsatellites. Similarly, Taylor et al. (1999a) characterized microsatellite ‘death’ by placing the interrupted microsatel-lite sequences into a phylogeny. Moreover, many other studies focussed on phylogenetic and comparative genomic evidence for microsatellite evolution (Li et al. 1996; Ortí et al.1997; Zhu et al.2000; Chirhart et al.2005; Leclercq et al.2010).
It is accepted that the high polymorphism of microsatel-lites is mainly caused by replication slippage, which leads to the allelic length variation (Levinson and Gutman1987). Previous studies have demonstrated that the repetitive sequences also contain many mutational events other than allelic length changes, such as base substitution and inser-tion/deletions (reviewed in Estoup et al.2002). In general, when microsatellites are applied as genetic markers, only the allelic size variations information based on the electro-morphs are used to analyse the genetic structure of popula-tions or phylogenetic relapopula-tionships, while the basic sequence variation information caused by substitution or indels is neglected. The consequence is that homoplasy is frequent in most studies based on microsatellite length polymorphism.
Basic variation information in the repeat sequences is then useful for investigation of sequence evolutionary pro-cess and the mechanism of microsatellite evolution. One of the methods should be to organize logically the allele sequences (cladistic tree) and to compare it with species phylogeny. However, because of the insertion or deletion of entire repeated blocks of nucleotides, the classical sequences alignment methods are not suitable for repetitive structure.
By-product of repeated region sequences, the substitu-tion rate in microsatellite flanking sequences is similar to that in intron sequences (Brohede and Ellegren1999), and microsatellite flanking sequences can be specific to each locus and informative for phylogenetic relationship investi-gation among alleles, populations and species (Zardoya et al.
1996; Makova et al.2000). Flanking region evolution can be regarded as a part of the repeated region evolution, being a cause or a consequence of some mutational events modifying the repeat structure.
To extract the basic variation information, other than length variation, in microsatellites alleles sequences, a new alignment method, the MS-Align program (Bérard and Rivals2003), which was successfully applied on minisatel-lite sequences (Bonhomme et al. 2007), have been applied in this study on microsatellite allele sequences. With this method, both the length variation and basic sequence varia-tions were considered in the analysis.
The biological model on which this method is applied in this study is the order Acipenseriformes which includes 25 extant sturgeons and two paddlefish species. The phyloge-netic relationships of this group have been investigated based on the mitochondrial gene sequences (Krieger et al.2008) and morphological evidence (Artyukhin 2006). A compre-hensive tree has been reconstructed by combining eight presently available mitochondrial gene sequences (4406 bp) (Krieger et al. 2008). In addition, five nuclear genes, 18S rRNA gene (Krieger and Fuerst 2002), 5S rDNA gene (Robles et al. 2005), HindIII and PstI satellite sequences (Robles et al.2004) and RAPD markers (Comincini et al.
1998), have been examined for phylogenetic analysis, con-firming most topology, but brought no new decisive informa-tion with them.
Having a look at the systematics, several discrepancies still exist between the phylogenetic trees based on molecular and morphological data:
• The most basal group is composed of the genera Polyo-don and Psephurus (the American paddlefish and Chinese swordfish, respectively);
• Then comes the two species, Acipenser sturio and A. oxyrhinchus, the European and Atlantic sturgeons, sister species, considered as ancestral while showing classical sturgeon morphology;
• An intermediate group composed of three species of the genus Scaphirhynchus (pallid, shovelnose and Alabama sturgeons) breaks the monophyly of the Acipenser genus; • Finally, most sturgeons belong to a monophyletic group,
the ‘sturgeons sensu stricto’ or ‘true sturgeons’, split into two geographic lineages: the Atlantic and the Pacific stur-geons. This structure is contradicted by the nomenclature: included in the ‘true sturgeons’ are the genus Huso com-posed of two species, one species in each geographic lin-eage and the genus Pseudoscaphirhynchus, composed of three species.
The contradictions between phylogeny and taxonomy have still to be resolved, such as the monophyly (and so the relevance) of genus Huso, and the basal position of two Atlantic sturgeons (A. sturio and A. oxyrinchus), which is not highlighted in the nomenclature (logical necessity of a distinct genus for these two species).
In this study, the conservation of the flanking sequences and the high variation of repeat sequences in microsatellite locus Spl-106 among sturgeon species provided us the oppor-tunity to understand the sequence evolution of this locus across the Acipenseriform species. We attempted to use the sequence variation both at the flanking and repeat region.
Understanding the microsatellite sequence evolution of locus Spl-106 as a model was the first objective. Checking if the nuclear new information provided here confirms pub-lished phylogenies based on mtDNA sequences, mainly Peng et al. (2007) and Krieger et al. (2008) was the second objec-tive. The new information was also to be confronted with the systematics anomalies given above.
Materials and methods
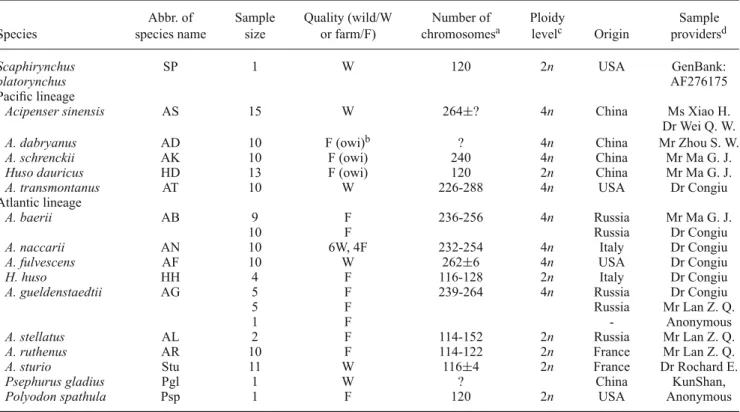
Sturgeon samplesFin or muscle samples were collected in sturgeon farms, sturgeon research institutes or laboratories in different coun-tries and preserved in 95% ethanol, except for Scaphi-rynchus platoScaphi-rynchus, for which the original sequence of microsatellite locus Spl-106 was downloaded from database (GenBank: AF276175, McQuown et al. 2000). For each species, the sample size, quality, origin, collection sites and providers are listed in table1.
Molecular methods
DNA extraction, PCR programme, electrophoreses, gel extraction of PCR products, TA cloning and sequencing pro-cedures are same as described in Shao et al. (2005). The pri-mer sequences of As-100, 5#
-GGGAGAAAACTGGGGTAAA-3# and 5#-CCAAAAGAAGAATGGTAGACGG-3# (Shao
et al. 2002), were used in the present study for all sam-ples. The IAquick Gel Extraction kit (Qiagen, Shanghai, China) was used to extract each of the PCR products with the size between 100 bp and 500 bp from the 4% inter-mediate melting temperature (75◦C) MetaPhor! agaroseR
(FMC BioProducts, Rockland, ME, USA) gel which can sep-arate 4 bp difference alleles. Since some sturgeon species are polyploidy species, such as A. sinensis, if some individ-uals have more than two bands with size between 100 bp and 500 bp, we extracted all of them. The TA cloning kit (Takara Biotech, DaLian, China) and DH5α or DE3 com-petent cells were used to clone the PCR products. Uni-lateral sequencing of inserted DNA was performed on an ABI PRISM 377 DNA sequencer (PE Applied Biosystems, Foster City, CA, USA). For each PCR product fragment, at least three clones were sequenced in order to obtain at least two identical sequences of each extracted PCR prod-uct from the gel. However, the nonidentical sequences with the same size would also be used in alignment for discov-ering the homoplasy sequences and evolutional process of microsatellites.
Data analysis
The flanking and repeat sequences were aligned sepa-rately because of their structure differences. The flanking sequences were aligned by using the Clustal X version 1.81 Program (Thompson et al. 1997) and checked by hand.
Table 1. Specimen information of 15 sturgeon species studied.
Abbr. of Sample Quality (wild/W Number of Ploidy Sample
Species species name size or farm/F) chromosomesa levelc Origin providersd
Scaphirynchus SP 1 W 120 2n USA GenBank:
platorynchus AF276175
Pacific lineage
Acipenser sinensis AS 15 W 264±? 4n China Ms Xiao H. Dr Wei Q. W.
A. dabryanus AD 10 F (owi)b ? 4n China Mr Zhou S. W.
A. schrenckii AK 10 F (owi) 240 4n China Mr Ma G. J.
Huso dauricus HD 13 F (owi) 120 2n China Mr Ma G. J.
A. transmontanus AT 10 W 226-288 4n USA Dr Congiu Atlantic lineage
A. baerii AB 9 F 236-256 4n Russia Mr Ma G. J.
10 F Russia Dr Congiu
A. naccarii AN 10 6W, 4F 232-254 4n Italy Dr Congiu
A. fulvescens AF 10 W 262±6 4n USA Dr Congiu
H. huso HH 4 F 116-128 2n Italy Dr Congiu
A. gueldenstaedtii AG 5 F 239-264 4n Russia Dr Congiu
5 F Russia Mr Lan Z. Q.
1 F - Anonymous
A. stellatus AL 2 F 114-152 2n Russia Mr Lan Z. Q.
A. ruthenus AR 10 F 114-122 2n France Mr Lan Z. Q.
A. sturio Stu 11 W 116±4 2n France Dr Rochard E.
Psephurus gladius Pgl 1 W ? China KunShan,
Polyodon spathula Psp 1 F 120 2n USA Anonymous
aThe chromosome numbers were referred from http://web.unife.it/progetti/geneweb/sturgeon.html, in which different chromosome
numbers for each species from different literatures were collected from published literatures by Dr Fontana.
bOwi means offsprings of wild individuals.
cPloidy levels of Acipenseriformes were referred from Peng et al. (2007).
dMs Xiao Hui, Institute of Chinese sturgeon, YiChang, P. R. China; Dr Wei Qiwei, Institute of Yangtze River Fisheries, JingZhou, P. R.
China; Mr Lan ZeQiao, TianXia Sturgeon Fishery Ltd., YiChang, P. R. China; Dr Leonado Congiu, University of Ferrara, Italy; Mr Ma GuoJun, Institute of Amur River Fisheries, P. R. China; Mr Zhou ShiWu, Institute of Rare Aquatic Animals, YiBin, P. R. China; Dr Eric Rochard, Cemagref, France.
The maximum-likelihood phylogenetic tree of flanking sequences was constructed by the online software PhyML (Guindon and Gascuel2003) through the bioinformatics plat-form Phylogeny.fr on the internet websitehttp://phylogeny. lirmm.fr(Dereeper et al.2008), using the default parameters. The evolutionary relationships of the repeat region among sequences were constructed based on the alignment distances computed with the MS-Align program (Bérard and Rivals
2003). This program can extract all the information included in repeated DNA sequences, which is impossible to do using classical sequence alignment methods. Considering only the differences in the number of repeats is also inappropriate, since Spl-106 is composed of distinct repeated units, called variants (mainly ‘GAAA’, ‘TAAA’ and ‘TAGA’), most of which are 4-nucleotides long and A/T rich, and probably derived from each other by point mutations (Shao et al.
2005). Indeed, alleles of the same or similar length can be completely different in sequence.
To apply this method on tetra-nucleotide repeat sequences, we encoded the repeat unit with letters (see figure 4). To realistically reflect the similarity of distinct repeat units, we weighted the changes between variants (or units) in the align-ment, e.g., changing the variant TAGA into TAAA or vice-versa costs the weight of a nucleotide substitution in the alignment score. Computing an alignment score between all homologous sequences pairs yielded a matrix of pairwise distances between sequences (Bérard et al.2006). We then fed this distance matrix into FastME (Desper and Gascuel
2002), a variation of the neighbour-joining (NJ) algorithm, to reconstruct a tree representing the relationships among sequences.
Another point is to estimate the robustness of the tree with respect to the alignment parameters and the level of confi-dence in its internal nodes. For this, we repeated the analy-sis with 19 sets of parameters and, each time, computed two mathematical measures: the variance accounted for (VAF), also known as percentage of explained variance, and the rate of elementary well-designed quartets (Re). The formula for the VAF and Re are detailed in Guenoche and Garreta (2000). The VAF quantifies the adequacy of representing the dis-tances within a tree, while the Re gives a confidence value for each internal edge as the percentage of quartets support-ing the split of this edge. Both measures are comprised in [0,1]. According to these two measures we chose the best tree among all 19 analyses. The complete protocol of this anal-ysis has already been used for instance in Bonhomme et al. (2007), where it is more detailed.
To simply compare the repeat structures among sequences, the encoded (letters) sequences of the repeat region (includ-ing repeat-like (RL) region, see Results) were aligned by Clustal X version 1.81 program (Thompson et al.1997) and checked by hand. Since the Clustal X program can only recognize the sequences composed of G, A, T and C, we used G, A and T to encode the three main repeat units (e.g., G = TAGA, A = TAAA, T = GAAA), and used C to encode all the other rare variable units. After alignment,
to avoid the confusion between encoding sequence and nucleotide sequence, and to make the encoding map read-able, we replaced G, A and T with L, O and J, respectively, and replaced C with other letters for different variable units (figure4).
Results
The primer set As-100 successfully amplified in 13 out of the 15 species, failing in A. naccarii and Psephurus gla-dius, probably due to bad quality of samples. Among the 220 sequenced PCR products of the 13 species, 93 different homologous sequences were detected in 11 of 13 species. No homologous sequence of locus Spl-106 was detected among the PCR products from two species, Acipenser sturio and Polyodon spathula.
Among 220 sequenced PCR products of the 13 species, 122 of them contained conserved flanking region of the target locus Spl-106 with flanking region identity level higher than 96%, 46 sequences from A. sinensis and A. dabryanus were less conserved (identity = 89%) due to the 11-bp deletion in the 3#- end (figure1), while the remaining 52 sequences from different species contained flanking region with less than 79% identity to that of Spl-106. The flanking sequences of P. spathula and A. sturio have less than 75% identity and the repeat structures of these sequences were also different from that of Spl-106. As we did not observe any flanking sequence with a percentage of identity between 79% and 89%, we excluded from further analysis of all PCR prod-ucts whose flanking regions exhibit a percentage of identity lower than 79%, as they probably originate from other loci than Spl-106. Finally, 93 different homologous sequences of locus Spl-106 were recorded from 11 species for further analysis.
Flanking region
Excluding the RL region, the length of the flanking region of locus Spl-106 is 131–132 bp in most alleles, while it is 120 bp in alleles of A. sinensis and A. dabryanus because of the 11-bp deletion. No mutation occured in the 20 bp 3#
-primer sites, so we did not show it in figure1. Including the original sequence SP205 from S. platorynchus (Shao et al.
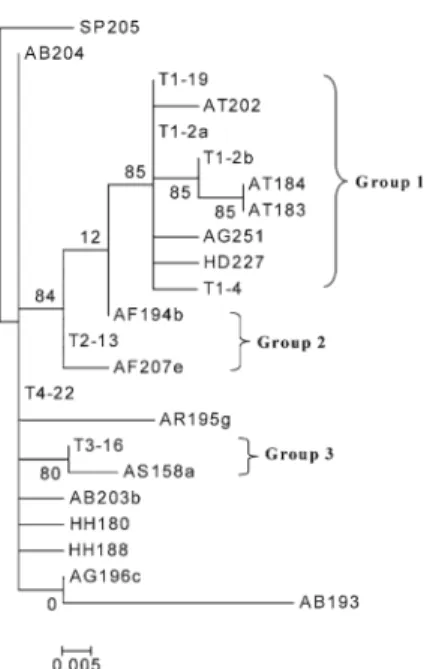
2002), 23 haplotypes of flanking sequences were observed among the 94 homologous sequences (figure1). Four haplo-types gathered the most common haplo-types, accounting for 70 of the 94 sequences (i.e., T1-19, T2-13, T3-16 and T4-22). The remaining 19 rare haplotypes were observed from one (i.e., haplotypes names beginning with two specific letters) to four sequences (i.e., haplotypes T1-2a, T1-4 and T1-2b).
Compared to the original sequence SP205, two common mutation sites were observed among the 93 new sequences (positions 38–40 and position 69), and they are the only mutations observed in haplotype T4-22, from which all the other sequences evolved by a few point mutations. Below
Figure 1. Sequence alignments of 23 haplotypes in the flanking region of locus Spl-106. The parentheses between position 37 and 38
indicate the repeat region. 5#-primer site is underlined on the left side, while 3#-end primer site is omitted on the right site of this map
because no mutations occured in this primer region. Dots indicate identical sequences. Dashes indicates deletions. The dominant haplotypes were named T1 to T4 with the number of alleles behind them. For example, T4-22 means that the T4 haplotype present in 22 alleles, and the name of these alleles for each hyplotype are listed under the alignment map. Rare haplotypes, which is present in only one allele, were named directly with the code of corresponding allele.
the haplotype T4-22, in figure1, there are seven different hyplotypes, which appear only one time each. Except T4-22 and these seven rare haplotypes; all the other haplotypes can be classified into three groups according to the group-specific mutations (figure1). Each group includes a common haplotype, i.e. T1-19, T2-13 and T3-16, respectively. This classification is supported by the maximum-likelihood phy-logenetic tree based on the flanking haplotypes sequences (high-bootstrap values for the splits leading to the groups; see figure2).
It is noticeable that group 1 encompasses sequences of five species of Pacific lineage: A. sinensis, A. dabryanus, H. dauricus, A. schrenckii and A. transmontanus (but also four exceptions from Atlantic lineage species: the three alle-les of one tetraploid A. gueldenstaedtii individual (AG251, AG200b and AG174) and one allele of A. fulvescens (AF190b)); group 2 can be recognized as species-specific haplotypes of A. fulvescens; group 3 gathers sequences only from the sister species pair A. sinensis – A. dabryanus of Pacific lineage (figure1). The hyplotype T4-22 and the seven rare haplotypes belong to six sturgeon species of Atlantic lin-eage (A. gueldenstaedtii, A. baerii, A. stellatus, A. ruthenus, A. fulvescens and H. huso).
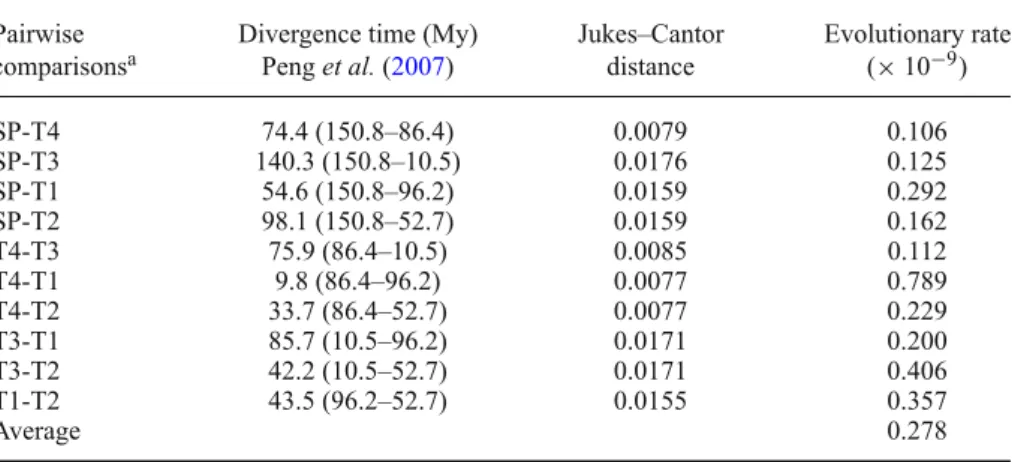
According to divergence time of Acipenseriformes esti-mated by Peng et al. (2007) and the pairwise Jukes–Cantor distance of haplotypes calculated by MEGA 4.0 (Tamura
et al.2007), we estimated the evolutionary rate of the flank-ing sequence (table2). The average sequence divergence rate of the flanking region of this locus in Acipenseriformes is
Figure 2. Maximum-likelihood phylogenetic tree of the flanking
sequences reconstructed by the program PhyML (Guindon and Gascuel2003) using the default parameters.
0.278 × 10⁻⁹ with a range from 0.106 to 0.789 × 10⁻⁹per
site per year. Repeat-like region
Between the 5#-end flanking and the repeat regions, an
inter-rupted RL poly (A) structure T(A)nTAAA distinguishes the
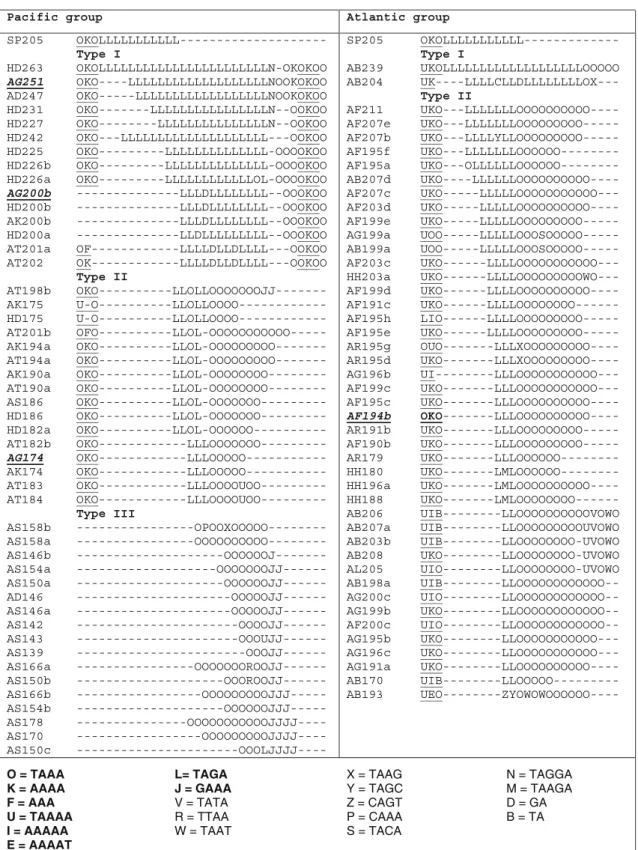
Pacific and Atlantic lineages, with n = 5 to 7 (mainly 7) in the sequences of Pacific species and n = 8 or 9 in Atlantic (figure4). We included it as a part of repeat region because of its variable RL structure and of its special position. The RL region appears at both sides of the repeat region in several sequences from Pacific species, while it was absent in some others (see figure4, Pacific group).
Repeat region
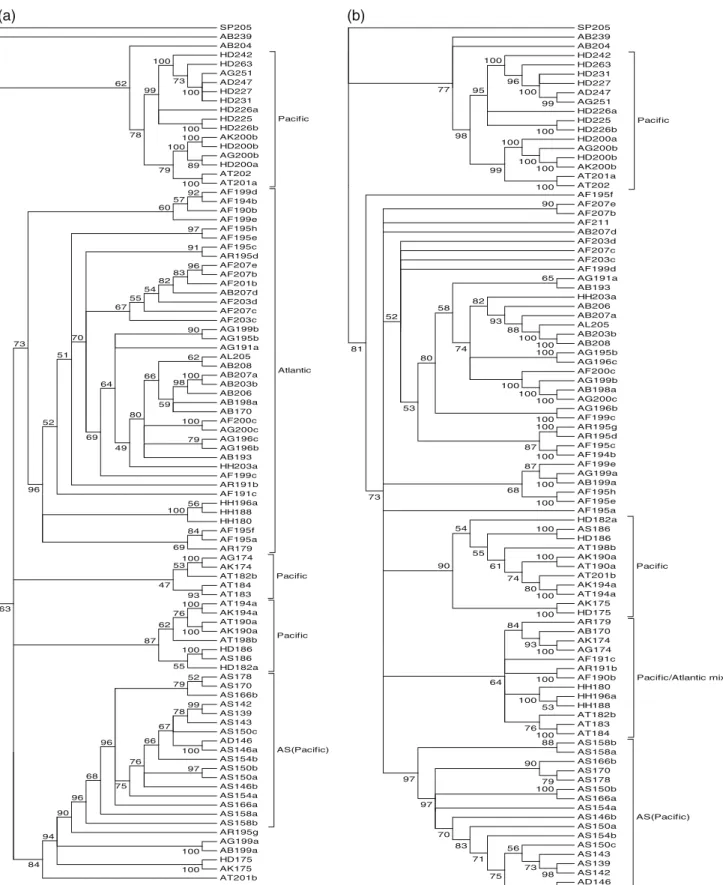
The pairwise divergence of the repeat regions of the 94 homologous sequences was estimated by the tandem repeat alignment program MS-Align (Bérard et al. 2006). This yielded a pairwise distance matrix, which served to recon-struct a NJ tree representing the relationships among homol-ogous sequences. To understand the effect of the variable RL region on the tree topology, we inferred two trees, one based on repeat region with RL region (tree I in figure3, VAF = 0.95, Re = 0.54 at the root) and other without RL region (tree II, VAF = 0.99, Re = 0.52 at the root). Both trees share a similar topology; only few sequences are placed differ-ently. Except for the solely branched sequence SP205 in both trees and the sequence AB239 in tree I, all other sequences were basically clustered into two nodes (support value Re = 0.62 (up node) and 0.63 (down node) in tree I; Re = 0.77 (up) and 0.81 (down) in tree II) due to the differences in the composition of repeat units and in number of copies of the three main repeat units (see figure 4). At the exception of six sequences (AR195g, AG199a, AB199a, HD175, AK175 and AT201b) placed within clade AS–AD (A. sinensis and A. dabryanus, tree I), further split clades are entirely Pacific or Atlantic. Although the sequences of the Atlantic group are
not clustered in one well-supported clade in tree II, the divi-sion of Pacific and Atlantic groups are still obvious. Only one small Pacific/Atlantic mixed clade (Re = 0.64) is observed in tree II. However, inside this mixed clade, the next nodes split individuals of Pacific and Atlantic species with higher support values as well.
The repeat structures were compared between the sequences from species of Pacific and Atlantic lineages in figure 4. We found no identical repeat structure between sequences of Pacific and Atlantic lineages, while identical sequences were often observed among species within the lineage. The only exceptions are the four sequences from two species of Atlantic lineage: three AG alleles: AG251, AG200b and AG174, and one A. fulvescens allele: AF194b, which contain the same repeat structure or RL region as sequences of Pacific lineage species. Since the three AG alle-les (AG251, AG200b and AG174), found in the same indi-vidual (given by an anonymous small fish farm, see table1), unexpectedly belong to the Pacific lineage both at the flank-ing and repeat structure, the species of this individual is probably misidentified. Thus, we excluded these three alleles from further discussion.
The basic structures of the repeat region were diversified among species, even within species. Three main types of compound repeat structures were observed: type I: (TAGA)n
(TAAA)m with the repeat number n greater than m (n =
12–23; m = 5–7); Type II: (TAGA)n (TAAA)m with n
less than or equal to m (n = 2–7; m = 5–12); type III: (TAAA)m(GAAA)n with m greater than n (m = 3–11; n =
0–4). The difference between types I and II is mainly due to the different repeat number of the two basic repeat units, and the sequences with these two repeat types can have the same flanking haplotypes and RL region, for instance the sequences with flanking haplotype T1-19 (in figures1and4). However, the sequences with type III repeats not only have very different basic repeat units, but also have an 11-bp sequence deletion in the flanking region (haplotypes of group 3 in figure1) and even no RL region at all (figure4). The distribution of repeat types in species were clarified in
Table 2. Estimation of evolutionary rate of microsatellite-flanking sequences in sturgeons.
Pairwise Divergence time (My) Jukes–Cantor Evolutionary rate
comparisonsa Peng et al. (2007) distance (× 10−9)
SP-T4 74.4 (150.8–86.4) 0.0079 0.106 SP-T3 140.3 (150.8–10.5) 0.0176 0.125 SP-T1 54.6 (150.8–96.2) 0.0159 0.292 SP-T2 98.1 (150.8–52.7) 0.0159 0.162 T4-T3 75.9 (86.4–10.5) 0.0085 0.112 T4-T1 9.8 (86.4–96.2) 0.0077 0.789 T4-T2 33.7 (86.4–52.7) 0.0077 0.229 T3-T1 85.7 (10.5–96.2) 0.0171 0.200 T3-T2 42.2 (10.5–52.7) 0.0171 0.406 T1-T2 43.5 (96.2–52.7) 0.0155 0.357 Average 0.278
SP205 AB239 AB204 HD242 HD263 AG251 AD247 HD227 HD231 HD226a HD225 HD226b AK200b HD200b AG200b HD200a AT202 AT201a Pacific AF199d AF194b AF190b AF199e AF195h AF195e AF195c AR195d AF207e AF207b AF201b AB207d AF203d AF207c AF203c AG199b AG195b AG191a AL205 AB208 AB207a AB203b AB206 AB198a AB170 AF200c AG200c AG196c AG196b AB193 HH203a AF199c AR191b AF191c HH196a HH188 HH180 AF195f AF195a AR179 Atlantic AG174 AK174 AT182b AT184 AT183 Pacific AT194a AK194a AT190a AK190a AT198b HD186 AS186 HD182a Pacific AS178 AS170 AS166b AS142 AS139 AS143 AS150c AD146 AS146a AS154b AS150b AS150a AS146b AS154a AS166a AS158a AS158b AS(Pacific) AR195g AG199a AB199a HD175 AK175 AT201b 100 73 100 100 99 100 89 100 100 79 78 62 92 57 60 97 91 96 83 82 54 55 67 90 62 100 98 59 66 100 79 80 49 64 69 70 51 52 56 100 84 69 96 73 100 53 93 47 100 100 76 62 100 55 87 52 79 99 78 100 67 66 97 76 75 96 68 96 90 100 100 94 84 63 SP205 AB239 AB204 HD242 HD263 HD231 HD227 AD247 AG251 HD226a HD225 HD226b HD200a AG200b HD200b AK200b AT201a AT202 Pacific AF195f AF207e AF207b AF211 AB207d AF203d AF207c AF203c AF199d AG191a AB193 HH203a AB206 AB207a AL205 AB203b AB208 AG195b AG196c AF200c AG199b AB198a AG200c AG196b AF199c AR195g AR195d AF195c AF194b AF199e AG199a AB199a AF195h AF195e AF195a HD182a AS186 HD186 AT198b AK190a AT190a AT201b AK194a AT194a AK175 HD175 Pacific AR179 AB170 AK174 AG174 AF191c AR191b AF190b HH180 HH196a HH188 AT182b AT183 AT184 Pacific/Atlantic mixed AS158b AS158a AS166b AS170 AS178 AS150b AS166a AS154a AS146b AS150a AS154b AS150c AS143 AS139 AS142 AD146 AS146a AS(Pacific) 99 100 96 100 100 95 100 100 100 100 99 98 77 90 65 100 100 88 93 82 100 100 100 100 74 58 100 80 100 100 87 53 52 100 87 100 68 100 100 100 80 74 61 55 54 100 90 100 93 84 100 53 100 100 76 64 88 79 90 100 98 73 56 100 75 71 83 70 97 97 73 81 (a) (b)
Figure 3. Neighbour-joining trees based on repeat region. (A) Tree I based on repeat region with repeat-like (RL) region. (B) Tree II based
on repeat region only. The pairwise molecular divergence among homologous was estimated by aligning their tandem repeat sequences using the MS-Align program (Bérard and Rivals2003). The tree was inferred with FastME (Desper and Gascuel2002) from the matrix of pairwise alignment distances. For each internal edge, the confidence value (between 0 and 1) and the rate of elementary well-designed quartets (Re) were computed (Guenoche and Garreta2000). The abbreviations of the species names are given in table1.
O = TAAA K = AAAA F = AAA U = TAAAA I = AAAAA E = AAAAT L= TAGA J = GAAA V = TATA R = TTAA W = TAAT X = TAAG Y = TAGC Z = CAGT P = CAAA S = TACA N = TAGGA M = TAAGA D = GA B = TA
Figure 4. Encoding map of repeat and repeat-like (RL) region. The RL regions are underlined. The four exceptional
sequences of Atlantic species, three AG and one AF are in bold font (see text). The different repeat types are divided and indicated by types I, II and III.
figure4. Almost all sequences from Atlantic species contain repeat type II, except for two sequences from A. baerii, which shows repeat type I. However, in Pacific group column, each species displays two repeat types. A. schrenckii, Huso dauri-cus and A. transmontanus contain repeat types I and II, and the sequence quantity of each repeat type is similar. A. dabryanus and A. sinensis mainly include repeat type III with two exceptional sequences, AD247 and AS186, which have repeat type I and type II, respectively. It should be mentioned that in one individual of the diploid species H. dauricus, we found four alleles (it was a surprise, proba-bly due to paralogy following a local duplication), HD242, 200, 186 and 182a, in which the two larger alleles have repeat type I and flanking haplotype T1-4, while the two smaller ones have repeat type II and flanking haplotype T1-19 (figures 1 and 4). Moreover, in A. sinensis and A. dabryanus, AS186 (in type II) and AD247 (in type I) differ from the other alleles of the same species, both in flanking sequence and repeat structure (see figures 1
and4). Allele AS186 coexists with the other four alleles (in type III) in one individual of A. sinensis, which has been reported as a tetraploidy species.
Discussion
The flanking region of locus Spl-106, which is originally iso-lated from S. platorynchus by McQuown et al. (2000), was highly conserved among the species of genera Acipenser, Huso and Scaphirhynchus, which diverged about 150 million years ago (Mya) (Peng et al.2007). The failed amplification of the homologous sequences in A. sturio and P. spathula is probably due to mutations occurring at the primers sites.
Long time of microsatellite loci stability have been observed in some other species, e.g., over 300 My in turtles (FitzSimmons et al.1995) and over 450 My in fish species (Rico et al. 1996). Flanking region stability on long time diverged taxa is necessity to study microsatellite evolution and to resolve the phylogenetic relationships of lineages. However, only a distorted sight is expected since we did not analyse the allele sequences at different steps of their evolu-tion, but rather the present sequences which were influenced by very ancient speciation and splitting events.
Flanking region evolution
Concerning the flanking region of microsatellites, the rate of sequence divergence has been estimated in some fish groups: from 0.02% to 0.05% per My among diverse fish species (Rico et al. 1996), and between 0.14%–0.83% in sunfish (Neff et al.1999). Our estimation on the microsatellite locus Spl-106 in sturgeons is between 0.011% and 0.079% with an average at 0.028% per My, which is similar to that estimated by Rico et al. (1996). However, it is slightly lower than that of satellite DNA in sturgeons (0.07% per My for HindIII and 0.11% per My for PstI; Robles et al.2004).
The slow rate of molecular evolution in Acipenseriformes had been demonstrated in satellite loci (HindIII and PstI)
and mitochondrial loci (De la Herrán et al.2001; Krieger and Fuerst 2002; Robles et al. 2004). Also, this general observation is now supported by our data set of microsatel-lite sequences. According to Neff et al. (1999), the rate of sequence divergence at the microsatellite flanking regions may be dependent on the locus itself. However, according to several observations, the slow rate of sequence divergence seems to be the general rule of microsatellite evolution in this ancient fish group, Acipenseriformes: (i) among the 108 loci screened in S. platorynchus, 65%–80% can be successfully amplified on Acipenser species (McQuown et al.2000); (ii) the microsatellite loci originally screened in the American paddlefish P. spathula can be crossamplified on most species of the family Acipenseridae (Heist et al.2002). This appar-ently easy cross-priming should be the mark of a general slow mutation rate.
Repeat region evolution and paralogy
According to the diversified repeat structures, the evolution-ary process of Spl-106 is more complicated in the Pacific than in the Atlantic lineage. In the Atlantic lineage, slippage duplication is the main mechanism in the evolutionary pro-cess, and the repeat number changes among the two basic repeat units contribute a lot to the size homoplasy. However, in Pacific group, each species contains generally two types of repeat structures corresponding to two evolutionary routes.
It is improbable that the different repeat types found in the same species could be due to stepwise mutation model. The same flanking sequence with different repeat motifs should be an evidence of paralogy (Karhu et al.2000). Here, sev-eral point mutations and indels also occured on the flank-ing sequences, which indicate that the two paralogs have been evolving independently for a long time. According to the distribution of the three repeat types on species (figure
4), two duplication events encompassing the locus Spl-106 probably occurred during the divergence of Pacific lineage: the first occured before the diversification of Pacific species (121–96 Mya) and led to repeat types I and II; the second occurred more recently, just before the speciation of A. sinen-sis and A. dabryanus (69–10 Mya) and led to repeat type III. Therefore, the sequences in the same species with different repeat types likely are paralogous loci. Paralogs are genes that derive from a single gene that was duplicated within a genome. This could also explain the phenomenon that four alleles, among which two contain repeat type I and the other two contain repeat type II, were present in one individual of the diploid species H. dauricus, and that five alleles, among which one has repeat type II, while the other four alleles have repeat type III, were detected in one individual of the tetraploid species A. sinensis.
Evolutionary relationships of flanking and repeat regions Our results show a synchronous evolutionary pattern between flanking and repeat regions. Homologous sequences
with different repeat types may have the same flanking sequences, but homologous sequences with different flanking haplotypes normally have different repeat structures. Espe-cially, in the sequences of clade AS–AD (group 3; figure2), the large variation due to 11-bp deletion in the flanking region is consistent with the great change in repeat struc-ture (see AS and AD alleles in figure4). Microsatellite loci are as vulnerable as the rest of the genome to point muta-tions, whose effect is to divide long repeat stretches into smaller subunits, and hence decrease the rate at which slip-page occurs (Bell and Jurka 1997; Kruglyak et al. 1998). Without the effects of the slippage mutation, the rates of base substitution or indels should be similar between the flank-ing and repeat regions. Moreover, both flankflank-ing and repeat regions (including the RL region) support the splitting of Pacific and Atlantic lineages, and the homologous sequences evolved independently after this split.
Adequacy with sturgeon phylogeny
The phylogenetic relationships of Acipenseriformes have been extensively studied by morphological characters and mitochondrial genes; however, many issues remain unre-solved (Artyukhin 2006; Peng et al. 2007; Krieger et al.
2008). Several nuclear genes, e.g. Sox genes, 5S rDNA and 18S rDNA, have also been used, and did not contradict the consensus phylogeny (Krieger and Fuerst 2002; Hett and Ludwig2005). For instance, the PstI satellite sequence sup-ported the observed Atlantic/Pacific split and HindIII satel-lite sequence supported the basal position of both A. sturio and A. oxyrinchus (Robles et al.2004).
In our data set, the flanking regions of microsatellite locus Spl-106 are highly conserved at the subfamily level: among the genera Scaphirhynchus, Huso and most species of genus Acipenser, except for A. sturio, in which no homol-ogous sequence of locus Spl-106 was detected by the same primer set. It confirms that A. sturio diverged earlier than Scaphirhynchus in the phylogeny of Acipenceriformes. The failed amplifications in A. naccarii and Psephurus gladius were probably due to the quality of the DNA extracted from limited sample material. We could not conclude that this locus was absent from A. naccarii, which is very close to A. gueldenstaedtii and A. baerii in all sturgeon phylogenies. However, it is possible that this locus does not exist in the paddlefish, Psephurus gladius, since we also did not find it in the other paddlefish, Polyodon spathula, allowing us to esti-mate the birth of this locus at about 185 Mya, during the early Jurassic (Peng et al.2007).
The Atlantic and Pacific clades were previously suggested by Ludwig et al. (2001) using cytochrome-b DNA sequences and confirmed by Peng et al. (2007). In our results, both the flanking and the repeat regions follow the two geographi-cal lineages. Our sequences are also influenced by the close relationships between (i) A. sinensis and A. dabryanus; (ii) A. schrenckii, A. transmontanus and H. dauricus (i.e. the Pacific clade); (iii) A. fulvescens, A. ruthenus, A. baerri,
A. gueldenstaedtii and A. stellatus, which have been sup-ported by the other molecular evidence (Krieger et al.
2008). Our results indicate that the evolution of a given microsatellite locus is directly driven by the speciation his-tory revealed by mtDNA sequences, but does not follow the morphological and taxonomic considerations (Artyukhin
2006). The two Huso species clearly belong to the genus Acipenser and are separately assigned to Pacific and Atlantic lineages. Although the flanking sequence is not variable enough for reflecting the phylogenetic relationships among all sturgeon species, we still found several specific diagnos-tic sites from the closely related species pair, A. sinensis and A. dabryanus (group 3 in figures 1 and 2), and the lake sturgeon A. fulvescens (group 2 in figures1and2).
Acknowledgements
The authors would like to thank the members of the Wuhan labora-tory for their assistance in this research. We also want to thank Prof. Brigitte Crouau-Roy for her helpful discussions on the manuscripts, to Marie-Claire Mella for proofreading. This work was supported by the Key Project of Chinese Academy of Sciences (grant num-ber KSCX2-1-03); Executive Office of the State Council Three Gorges Project Construction Committee of China (grant number SX2003-008); and the Chinese–French Advanced Research Pro-gramme (grant number PRA-E 02/03). ZJS was supported by the French Research Ministry post-doctoral grants, the National Natu-ral Science Foundation of China (grant number NSFC 30490234), and a post-doctoral grant from the University Montpellier II. ER was supported by a grant from the Action Concertée Incitative IMPBio ‘Repevol’, by grant ANR blanche (CoCoGen project) (BLAN07-1_185484) from the French National Research Agency.
References
Artyukhin E. N. 2006 Morphological phylogeny of the order Acipenseriformes. J. Appl. Ichthyol. 22, 66–69.
Bell G. I. and Jurka J. 1997 The length distribution of perfect dimer repetitive DNA is consistent with its evolution by an unbiased single-step mutation process. J. Mol. Evol. 44, 414–421. Bérard S. and Rivals E. 2003 Comparison of minisatellites. J.
Comput. Biol. 10, 357–372.
Bérard S., Nicolas F., Buard J., Gascuel O. and Rivals E. 2006 A fast and specific alignment method for minisatellite maps. Evol.
Bioinform. 2, 303–320.
Bonhomme F., Rivals E., Orth A., Grant G. R., Jeffreys A. J. and Bois P. R. J. 2007 Species-wide distribution of highly poly-morphic minisatellite markers suggests past and present genetic exchanges among house mouse subspecies. Genome Biol. 8, R80. Brohede J. and Ellegren H. 1999 Microsatellite evolution: polar-ity of substitutions within repeats and neutralpolar-ity of flanking sequences. Proc. R. Soc. London B 266, 825–833.
Chirhart S. E., Honeycutt R. L. and Greenbaum I. F. 2005 Microsatellite variation and evolution in the Peromyscus
manic-ulatus species group. Mol. Phyl. Evol. 34, 408–415.
Comincini S., Lanfredi M., Rossi R. and Fontana F. 1998 Use of RAPD markers to determine the genetic relationships among sturgeons (Acipenseridae, Pisces). Fish. Sci. 64, 36–39.
Crow J. F. and Kimura M. 1970 An introduction to population
genetics theory, pp. 591. Harper and Row, New York, USA.
De la Herrán R., Fontana F., Lanfredi M., Confiu L., Leis M., Rossi R. et al. 2001 Slow rates of evolution and sequence
homogenization in an ancient satellite DNA family of sturgeons.
Mol. Biol. Evol. 18, 432–436.
Dereeper A., Guignon V., Blanc G., Audic S., Buffet S., Chevenet F. et al. 2008 Robust phylogenetic analysis for the non-specialist.
Nucleic Acids Res. 36 (suppl. 2), W465–W469.
Desper R. and Gascuel O. 2002 Fast and accurate phylogeny recon-struction algorithms based on the minimum-evolution principle.
J. Comput. Biol. 9, 687–705.
Di Rienzo A., Peterson A. C., Garza J. C., Valdes A. M., Slatkin M. and Freimer N. B. 1994 Mutational processes of simple-sequence repeat loci in human populations. Proc. Natl. Acad. Sci. USA 91, 3166–3170.
Estoup A., Jarne P. and Cornuet J. M. 2002 Homoplasy and muta-tion model at microsatellite loci and their consequences for population genetics analysis. Mol. Ecol. 11, 1591–1604. FitzSimmons N. N., Moritz C. and Moore S. S. 1995
Conserva-tion and dynamics of microsatellite loci over 300 million years of marine turtle evolution. Mol. Biol. Evol. 12, 432–440.
Goldstein D. B. and Schlötterer C. 1999 Microsatellites: evolution
and applications, pp. 352. Oxford University Press, New York,
USA.
Guenoche A. and Garreta H. 2000 Can we have confidence in a tree representation? In Proceedings of the First International Con-ference on Biology, Informatics, and Mathematics: 2000 May 3-5, Montpellier. (ed. O. Gascuel and M. F. Sagot), pp. 45– 56. (Lecture Notes in Computer Science 2066), Springer-Verlag, Berlin.
Guindon S. and Gascuel O. 2003 A simple, fast, and accurate algo-rithm to estimate large phylogenies by maximum likelihood. Syst.
Biol. 52, 696–704.
Heist E. J., Nicholson E. H., Sipoorski J. T. and Keeney D. B. 2002 Microsatellite markers for the paddlefish (Polyodon spathula).
Conserv. Genet. 3, 205–207.
Hett A. K. and Ludwig A. 2005 SRY-related (Sox) genes in the genome of European Atlantic sturgeon (Acipenser sturio).
Genome 48, 181–186.
Karhu A., Dieterich J. H. and Savolainen O. 2000 Rapid expansion of microsatellite sequences in pines. Mol. Biol. Evol. 17, 259–265. Kimura M. and Crow J. F. 1964 The number of alleles that can be
maintained in a finite population. Genetics 49, 725–738. Kimura M. and Ohta T. 1978 Stepwise mutation model and
distribu-tion of allelic frequencies in a finite populadistribu-tion. Proc. Natl. Acad.
Sci. USA 75, 2868–2872.
Krieger J. and Fuerst P. A. 2002 Evidence for a slowed rate of molecular evolution in the order Acipenseriformes. Mol. Biol.
Evol. 19, 891–897.
Krieger J., Hett A. K., Fuerst P. A., Artyukhin E. and Ludwig A. 2008 The molecular phylogeny of the order Acipenseriformes revisited. J. Appl. Ichthyol. 24, 36–45.
Kruglyak S., Durrett R. T., Schug M. D. and Aquadro C. F. 1998 Equilibrium distributions of microsatellite repeat length result-ing from a balance between slippage events and point mutations.
Proc. Natl. Acad. Sci. 95, 10774–10778.
Leclercq S., Rivals E. and Jarne P. 2010 DNA slippage occurs at microsatellite loci without minimal threshold length in humans: a comparative genomic approach. Genome Biol. Evol. 2, 325–335. Levinson G. and Gutman G. A. 1987 Slipped-strand mispairing: a major mechanism for DNA sequence evolution. Mol. Biol. Evol.
4, 203–221.
Li J., Macaubas C., Hallmayer J., Kimura A. and Mignot E. 1996 Mutation rate varies among alleles at a microsatellite
locus: Phylogenetic evidence. Proc. Natl. Acad. Sci. 93, 15285– 15288.
Ludwig A., Belfiore N. M., Pitra C., Svirsky V. and Jenneckens I. 2001 Genome duplication events and functional reduction of ploidy levels in sturgeon (Acipenser, Huso and Scaphirhynchus).
Genetics 158, 1203–1215.
Makova K. D., Nekrutenko A. and Baker R. J. 2000 Evolution of microsatellite alleles in four species of mice (Genus Apodemus).
J. Mol. Evol. 51, 166–172.
McQuown E. C., Sloss B. L., Sheehan R. J., Rodzen J., Tranah G. J. and May B. 2000 Microsatellite analysis of genetic vari-ation in sturgeon (Acipenseridae): new primer sequences for
Scaphirhynchus and Acipenser. Trans. Am. Fish. Soc. 129, 1380–
1388.
Messier W., Li S. and Stewart C. 1996 The birth of microsatellite.
Nature 381, 483.
Neff B. D., Fu P. and Gross M. R. 1999 Microsatellite evolution in sunfish (Centrarchidae). Can. J. Fish. Aquat. Sci. 56, 1198–1205. Ortí G., Pears D. E. and Avise J. C. 1997 The effect of marker heterozygosity on the power to detect linkage disequilibrium.
Genetics 147, 927–930.
Peng Z., Ludwig A., Wang D., Diogo R., Wei Q. and He S. 2007 Age and biogeography of major clades in sturgeons and paddlefishes (Pisces: Acipenseriformes). Mol. Phyl. Evol. 42, 854–862.
Rico C., Rico I. and Hewitt G. 1996 470 million years of conser-vation of microsatellite loci among fish species. Proc. R. Soc.
London B 263, 549–557.
Robles F., De la Herrán R., Ludwig A., Ruiz Rejón C., Ruiz Rejón M. and Garrido-Ramos M. A. 2004 Evolution of ancient satellite DNAs in sturgeon genomes. Gene 338, 133–142.
Robles F., De la Herrán R., Ludwig A., Ruiz Rejón C., Ruiz Rejón M. and Garrido-Ramos M. A. 2005 Genomic organization and evolution of the 5S ribosomal DNA in the ancient fish sturgeon.
Genome 48, 18–28.
Shao Z. J., Zhao N., Zhu B., Zhou F. L. and Chang J. B. 2002 Applicability of microsatellite primers developed from shovel-nose sturgeon in Chinese sturgeon. Acta. Hydrobiol. 26, 577–584. (in Chinese with English abstract).
Shao Z. J., Lek S. and Chang J. 2005 Complex mutation at a microsatellite locus in sturgeons: Acipenser sinensis, A.
schrenckii, A. gueldenstaedtii and A. baerii. J. Appl. Ichthyol. 21,
2–6.
Tamura K., Dudley J., Nei M. and Kumar S. 2007 MEGA4: Molec-ular evolutionary genetics analysis (MEGA) software version 4.0. Mol. Biol. Evol. 24, 1596–1599.
Taylor J. S., Durkin J. M. H. and Breden F. 1999a The death of a microsatellite: a phylogenetic perspective on microsatellite interruptions. Mol. Biol. Evol. 16, 567–572.
Thompson J. D., Gibson T. J., Plewniak F., Jeanmougin F. and Higgins D. G. 1997 The clustal x windows interface: flexi-ble strategies for multiple sequence alignment aided by quality analysis tools. Nucleic Acids Res. 24, 4876–4882.
Zardoya R., Vollmer D. M., Craddock C., Streelman J. T., Karl S. and Meyer A. 1996 Evolutionary conservation of microsatel-lite flanking regions and their use in resolving the phylogeny of cichlid fishes (Pisces: Perciformes). Proc. R. Soc. London B 263, 1589–1598.
Zhu Y., Queller D. C. and Strassmann J. E. 2000 A phylogenetic perspective on sequence evolution in microsatellite loci. J. Mol.
Evol. 50, 324–338.
Received 18 April 2010, in revised form 7 November 2010; accepted 29 December 2010 Published on the Web: 19 August 2011