HAL Id: hal-01727045
https://hal.archives-ouvertes.fr/hal-01727045
Submitted on 8 Jan 2021
HAL is a multi-disciplinary open access
archive for the deposit and dissemination of
sci-entific research documents, whether they are
pub-lished or not. The documents may come from
teaching and research institutions in France or
abroad, or from public or private research centers.
L’archive ouverte pluridisciplinaire HAL, est
destinée au dépôt et à la diffusion de documents
scientifiques de niveau recherche, publiés ou non,
émanant des établissements d’enseignement et de
recherche français ou étrangers, des laboratoires
publics ou privés.
Distributed under a Creative Commons Attribution - NonCommercial| 4.0 International
rupture propagation and promote afterslip
Frédérique Rolandone, Jean-Mathieu Nocquet, Patricia Mothes, Paul Jarrin,
Martin Vallée, Nadaya Cubas, Stephen Hernandez, Morgan Plain, Sandro
Vaca, Yvonne Font
To cite this version:
Frédérique Rolandone, Jean-Mathieu Nocquet, Patricia Mothes, Paul Jarrin, Martin Vallée, et al..
Areas prone to slow slip events impede earthquake rupture propagation and promote afterslip. Science
Advances , American Association for the Advancement of Science (AAAS), 2018, 4 (1), pp.eaao6596.
�10.1126/sciadv.aao6596�. �hal-01727045�
G E O P H Y S I C S Copyright © 2018 The Authors, some rights reserved; exclusive licensee American Association for the Advancement of Science. No claim to original U.S. Government Works. Distributed under a Creative Commons Attribution NonCommercial License 4.0 (CC BY-NC).
Areas prone to slow slip events impede earthquake
rupture propagation and promote afterslip
Frederique Rolandone,1,2* Jean-Mathieu Nocquet,2,3Patricia A. Mothes,4Paul Jarrin,4
Martin Vallée,3Nadaya Cubas,1Stephen Hernandez,4Morgan Plain,4Sandro Vaca,4Yvonne Font2 At subduction zones, transient aseismic slip occurs either as afterslip following a large earthquake or as episodic slow slip events during the interseismic period. Afterslip and slow slip events are usually considered as distinct pro-cesses occurring on separate fault areas governed by different frictional properties. Continuous GPS (Global Positioning System) measurements following the 2016Mw(moment magnitude) 7.8 Ecuador earthquake reveal that
large and rapid afterslip developed at discrete areas of the megathrust that had previously hosted slow slip events. Regardless of whether they were locked or not before the earthquake, these areas appear to persistently release stress by aseismic slip throughout the earthquake cycle and outline the seismic rupture, an observation potentially leading to a better anticipation of future large earthquakes.
INTRODUCTION
Large earthquakes not only release previously accumulated elastic stress where they occur but also increase stress at their periphery on the fault plane. The stressed areas, in turn, will respond according to their frictional resistance, stiffness of the surrounding medium, and the stress increment they experience. Previous studies of large and great subduction earthquakes found that most afterslip takes place in areas adjacent to the seismic rupture where interseismic locking is low. This observation, together with the logarithmic decay of slip rate through time, has been interpreted as the response to the earthquake stress increment of fault areas where friction increases with slip rate, so-called rate-strengthening areas (1–5). These results are consistent with a conceptual model of the megathrust where the seismogenic zone is composed of unstable rate-weakening patches, promoting stress accumulation and episodic seismic rupture, embedded in an overall rate-strengthening stable plate interface, where aseismic steady slip occurs at or close to the plate rate during the interseismic phase and where afterslip develops after a nearby large rupture (6). A key im-plication of this view in terms of earthquake forecasting is that rate-weakening fault areas locked during the interseismic period will host future seismic ruptures.
Here, we study aseismic slip that followed the 16 April 2016 moment magnitude (Mw) 7.8 Pedernales earthquake to probe into the mecha-nisms behind afterslip and investigate the relationship between seismic and aseismic slip modes at the subduction interface throughout the earthquake cycle. The Pedernales earthquake ruptured a 100-km-long by 50-km-wide segment of the megathrust (7, 8), with up to 6 m of seis-mic slip confined between depths of 15 and 30 km (7). Seisseis-mic slip occurred at areas of high interseismic coupling but left unbroken a 50 × 50 km2locked patch updip of the southern part of the rupture (latitude, 0.3°S; longitude, 80.7°W) and a smaller one north of it, sub-sequently ruptured by two large aftershocks, Mw6.7 and 6.8, on 18 May (Fig. 1). Combining the interseismic locking model, the rupture area, and the Coulomb stress change calculation (Fig. 1), we would expect
afterslip to develop updip and downdip in the immediate vicinity of the rupture, with little slip updip south of the rupture where inter-seismic locking is high.
RESULTS
Localized and rapid afterslip
Using observations from 40 continuous Global Positioning System (GPS) stations, 12 of them installed within 17 days after the Pedernales earthquake, we derive the time-dependent evolution of aseismic slip at the megathrust during the month following the mainshock (see Materials and Methods). We restrict our analysis to this short time period to avoid significant contribution from viscoelastic relaxation of the lower crust/upper mantle and because the two large aftershocks on 18 May triggered their own afterslip, making the signal more complex to interpret.
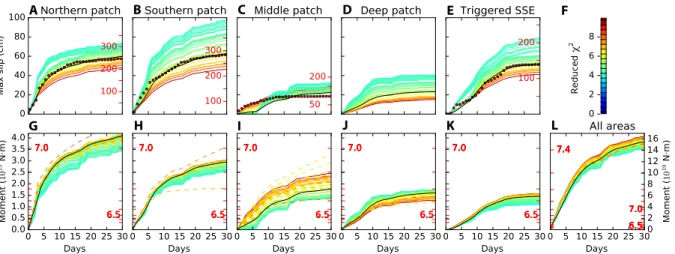
We find that the largest amount of afterslip initiated immediately after the mainshock at two separate ~50 × 50 km2patches, located north and south updip of the seismic rupture (Fig. 2). The cumulative afterslip for 30 days is 0.4 to 0.7 m and 0.4 to 1.0 m for the northern and southern patches, respectively, with equivalent magnitudes of Mw 7.1 and 7.0 (Fig. 3, A, B, G, and H). About half of the slip was already emplaced after 6 days (Figs. 2D and 3, A and B), before the aseismic slip started to propagate from these two patches into the area separating them, updip of the rupture (area referred to as the middle patch in Figs. 2A and 3, C and I). During the same period, aftershocks also occurred mainly updip of the Pedernales earthquake rupture area and were spatially organized into three distinct strips striking perpen-dicular to the trench and outlining the areas of high afterslip (Fig. 2A). For both areas of high afterslip, the cumulative number of earthquakes mimics the time evolution of slip (Fig. 3, A and B). Shallow afterslip therefore appears to be the main process driving the aftershock sequence. In contrast, the area between the two patches of high after-slip updip of the seismic rupture experienced less after-slip and hosted scarce aftershocks (Figs. 2A and 4B). Afterslip also occurred downdip of the Pedernales earthquake rupture area. According to our modeling, the deep afterslip initiated at a depth of 60 km, ~50 km downdip from the rupture, and propagated updip and southward (Fig. 2). The max-imum amount of slip is 0.15 to 0.4 m for a moment release equivalent to Mw6.7 to 6.8 (Fig. 3, D and J).
1Sorbonne Université, CNRS-INSU, Institut des Sciences de la Terre Paris, ISTeP
UMR 7193, F-75005 Paris, France.2Université Côte d’Azur, IRD, CNRS, Observatoire de la Côte d’Azur, Géoazur, Valbonne, France.3Institut de Physique du Globe de Paris,
Sorbonne Paris Cité, Université Paris Diderot, UMR 7154 CNRS, Paris, France.4Instituto
Geofísico, Escuela Politécnica Nacional, Quito, Ecuador. *Corresponding author. Email: frederique.rolandone@upmc.fr
on January 8, 2021
http://advances.sciencemag.org/
A remotely triggered slow slip event
We also find that the 2016 Pedernales earthquake triggered a shallow slow slip event (SSE) ~100 km south of the seismic rupture (Fig. 2A). The slip took place close to the trench at a depth shallower than 10 km. It had maximum slips of 0.4 to 0.8 m, with equivalent magnitudes of Mw6.7 to 6.8, and was spatially and temporally associated with signif-icant microseismicity (Figs. 2A and 3, E and K). Unlike afterslip patches, which show slip initiating immediately after the mainshock and decelerating through time, slip here shows a progressive acceler-ation before a phase of deceleracceler-ation, typical of SSEs (9). All the aseismic slip occurred over a 3-week period, ending 25 days after the mainshock. The static Coulomb stress increment induced by the mainshock is on the order of a few kilopascals at the SSE location, consistent with stress perturbation values proposed for triggering or modulating SSEs (10).
SSEs before the Pedernales earthquake
Aside from the remotely triggered SSE, the pattern for the first month of aseismic slip following the 2016 Pedernales earthquake departs in several ways from the view of stable sliding rate-strengthening regions adjacent to the seismic rupture responding to the coseismic stress
in-crement. The evolution of shallow afterslip shows little spatial corre-lation with the highest static stress perturbations induced by the 2016 earthquake (Figs. 1 and 2). The amount of afterslip observed at the northern and southern patches is abnormally rapid and large com-pared, for instance, to the 2007 Mw8.0 Pisco earthquake and the 2010 Maule Mw 8.8 earthquake (see Materials and Methods and fig. S7) (2, 3). In addition, a large percentage of shallow afterslip in-volves areas that were locked before the Pedernales earthquake. In par-ticular, the southern patch of high afterslip updip of the Pedernales earthquake rupture remarkably overlaps with an area of high interseismic locking, left unbroken by the 2016 earthquake (Fig. 4B).
We further reveal that the four areas of enhanced aseismic slip after the Pedernales earthquake regularly hosted SSEs during the years before the earthquake. As in other shallow SSE-prone subduction zones, SSEs are associated with intense seismic swarms (9, 11) or inferred from re-peating earthquakes (12), an observation that we use as a proxy to iden-tify the occurrence of SSEs before the GPS data became available in 2008–2009 or when SSEs are too small to be analyzed by geodetic data. In the area of the remotely triggered SSE, two SSEs with equivalent magnitudes of Mw6.0 to 6.3 were geodetically detected in 2010 and 2013 with repeating earthquake activity (13, 14). Here, seismic swarms
−81˚ −81˚ −80˚ −80˚ −1˚ −1˚ 0˚ 0˚ 1˚ 1˚ 0 20 40 60 80 100 Coupling (%) −81˚ −81˚ −80˚ −80˚ −1˚ −1˚ 0˚ 0˚ 1˚ 1˚ −40 −30 −20 −10 1 1 3 3 5 Pedernales Nazca Plate 47 mm/year
North Andean Slive r −80 −60 −40 −40 −20 −20 11 3 ΔCFS (bar) −5 −4 −3 −2 −10 1 2 3 4 5
LATITUDE
LONGITUDE
Fig. 1. Interseismic coupling map along the central Ecuador subduction zone. Yellow stars show the location of the two main aftershocks on 18 May 2016 (Mw6.7 to 6.9).
White lines show the Mw7.8 16 April 2016 Pedernales earthquake rupture with coseismic slip contours for 1, 3, and 5 m (7). Dashed lines are depth contours of the
subduction interface every 10 km. Inset shows the Coulomb failure stress change on the subduction interface computed from the coseismic slip distribution of the 2016 Pedernales earthquake.
on January 8, 2021
http://advances.sciencemag.org/
also regularly occurred in 1977, 1998, 2002, and 2005 (Fig. 4, A and C) (13, 15, 16). For the northern patch of large afterslip, families of repeat-ing events activated every 2 years are detected since 2002 (Fig. 4, A and C) (17). Seismic swarms have regularly been detected by the Ecuadorian National Seismic Network since 1994 with similar periodicity, and SSEs were geodetically detected in 2007 (18) and in 2013–2014 with a moment magnitude release of Mw6.3 for the latter (17). At the southern patch of high afterslip, seismic swarms with durations of a
few days to 2 months were detected in 1996, 2000, 2010, and 2015. Although SSEs could not be extracted from the GPS time series avail-able since late 2009, we find at least three periods of repeating earthquake activation since 2010 (see Fig. 4, A and C, and Materials and Methods). In addition, we find that a deep SSE occurred 8 months before the Pedernales earthquake (Fig. 4, A and C, and fig. S10). It had a total duration of 2 months and involved 0.2 m of slip at ~55-km depth for an equivalent magnitude of Mw6.7, with a slip area
A B C D E F G Aseismic slip (cm)
Fig. 2. Afterslip time evolution. (A) Afterslip 30 days following the mainshock. The amount of slip is indicated by the color scale on the left of the figure (in centimeters). Yellow arrows are displacements after the earthquake. Red and green arrows are model-predicted displacements for CGPS sites recorded since the mainshock and installed during the days following the Pedernales earthquake, respectively. Coseismic slip contours (1 and 3 m) of the 2016 Mw7.8 Pedernales earthquake are in black (7). Dashed gray
lines are depth contours of the subduction interface every 10 km. Gray dots show aftershocks (Mw> 3.5) from the IGEPN catalog. (B to G) Snapshots of cumulative afterslip for
different time windows.
A B C D E F
G H I J K L
Fig. 3. Slip and seismic moment time evolution for different areas of the plate interface. (A to E) Cumulative slip time evolution for the subfault that has the maximum final slip in each area. The curve color is the reducedc2for each model according to the color scale shown in (F). Our preferred model is shown by the black curve. The dotted
curve in (A) to (C) and (E) shows the cumulative number of earthquakes (Mw> 3) through time, with the scale shown in red on the right edge of each plot. (G to L) Cumulative
moment time evolution for the different areas of the plate interface. The scale in red shows Mw. Dashed curves indicate model predictions for alternative models explored in
the resolution tests (see the Supplementary Materials).
on January 8, 2021
http://advances.sciencemag.org/
overlapping the patch of deep afterslip. For the four areas, the location of SSEs occurring during the years and decades before 2016 overlays the areas of enhanced postseismic slip. The pattern of seismicity inde-pendently supports this finding because aftershocks and shallow subduction seismicity during the 1994–2007 period (16) show a similar spatial distribution. Interseismic seismicity, mainly occurring as seis-mic swarms, and postseisseis-mic seisseis-micity are both driven by transient aseismic slip taking place at the same areas of the megathrust.
DISCUSSION
Thus far, afterslip and SSEs have been considered as separate classes of transient aseismic slip, corresponding to distinct frictional behaviors operating at different portions of the fault. In the case of Ecuador, patches experiencing postseismic slip and SSEs certainly obey the same friction law during the inter- and postseismic periods. SSEs
are predicted to occur for rate-weakening friction if the nucleation size, a critical number depending on the frictional parameters and the effective stress, is larger than the size of the patch (19–22). Large nucleation sizes could result from elevated pore-fluid pressure leading to low effective stresses, preventing slip evolution toward dynamic in-stability and seismic rupture (20). In the case of a large nucleation size, a rate-weakening patch can have a diversity of aseismic behaviors consistent with our observations, including episodic SSEs and afterslip, thus preventing seismic rupture (Fig. 4) (21, 23, 24).
If the behavior observed here also applies to other subduction zones, then our results offer potential significant implications on seis-mic and tsunami hazard. The areas hosting regular SSEs and large afterslip had a dominant aseismic slip mode that persisted throughout the earthquake cycle during several years and decades: They regularly experienced SSEs during the interseismic phase, they did not rupture during the 2016 Pedernales earthquake, and they had large aseismic
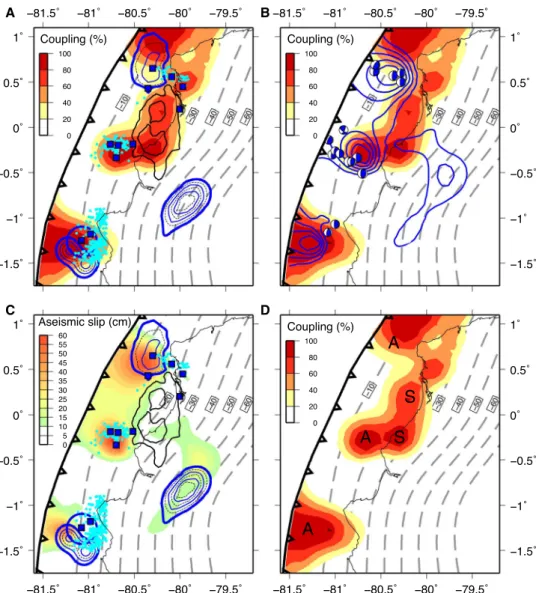
A B C D
A
A
A
S
S
Fig. 4. Summary of slip modes at the plate interface during the earthquake cycle. (A) Interseismic phase. Colors indicate interseismic coupling from the studies of Nocquet et al. (7) and Collot et al. (40). Annotations show SSEs (thick blue lines), seismic swarms (light blue dots), and repeating earthquakes (blue squares) before the Pedernales earthquake. SSE areas are defined by the contour line corresponding to 20% of their maximum slip. Light and dashed blue curves are 5 and 2.5 cm isocontours of slip, respectively. (B) Total afterslip as of 30 days after the mainshock contoured every 10 cm (blue lines) and focal mechanisms for primary aftershocks overlain on inter-seismic coupling (42). (C) Afterslip as in Fig. 2A together with SSEs, inter-seismic swarms, and repeating earthquakes as in (A). (D) Summary of areas that behaved ainter-seismically (A) and seismically (S).
on January 8, 2021
http://advances.sciencemag.org/
slip after it (Fig. 4). Two of these areas further appear to have acted as a barrier to the seismic rupture propagation during the Pedernales earthquake, as observed for the 2012 Mw7.6 earthquake in Costa Rica (25). They prevented the Pedernales earthquake from involving large slip close to the trench that likely would have generated a tsunami. Although rare great earthquakes may still be able to propagate into these areas (21, 23), as the 1906 great earthquake possibly did (8), pre-cisely observing SSEs may contribute to significantly improving our ability to anticipate future large earthquakes. Because continuous geo-detic measurements only span a short time window of the earthquake cycle, interseismic locking models likely quantify the slip deficit accu-mulation between large SSEs (26). Observing where SSEs occur at the megathrust, how frequent they are, and how much strain they release provides additional constraints on the slip budget and highlights areas having a persistent aseismic slip mode regardless of whether they are locked or not. SSE areas, together with interseismic locking maps, can potentially define where seismic rupture will remain confined, leading to better anticipation of the location, size, and tsunami potential of future large earthquakes (25).
Furthermore, an SSE starting in an area of previous regular and large SSEs is unlikely to evolve into unstable seismic slip. On the con-trary, an SSE occurring within or near a locked area devoid of previous large SSEs has a larger probability of forming a nucleation phase leading to seismic slip, as proposed for the 1999 Izmit (27), 2011 Tohoku (28), or 2014 Iquique earthquakes (29–31). Precisely docu-menting SSEs in the vicinity of highly locked areas might therefore open a way to ultimately interpret a transient slip as a precursory signal of an incipient large earthquake.
MATERIALS AND METHODS GPS data
The continuous GPS (CGPS) data include 28 sites from the IGEPN and IRD joint network (18) operating at the time of the earthquake: 4 sites (CHOR, JAM2, MUIS, and PPRT; see fig. S1) installed during the first week following the Pedernales earthquake, 8 new sites (BECH, CJMS, LCSD, MADL, SECO, SIDR, VIHE, and BBUA) installed with-in 17 days after the mawith-inshock, and PTGL, a CGPS malfunctionwith-ing at the date of the earthquake, repaired on 4 May. The CGPS network encompasses the rupture area of the Pedernales earthquake with sites up to 300 km from the rupture. It has an intersite distance of around 20 to 30 km near the Pedernales earthquake rupture area, progressively increasing away from the earthquake (fig. S1).
We analyzed the CGPS data using the GAMIT/GLOBK v10.6 software (32), using the strategy described by Nocquet et al. (33). The input time series used in the inversion were the daily positions from 17 April 2016 to 17 May 2016 calculated with respect to the po-sition at 17 April 2016 indicated by day 0 in the plots for the sites operating at the time of the earthquake or with respect to the first day of measurements for sites installed after the mainshock. Time-dependent slip inversion
We used the SLAB1.0 curved subduction interface geometry (34) dis-cretized into quasi-equilateral triangular dislocation elements to compute the Green’s function relating the unit slip component, along-dip and along-strike, to the component of displacements at the GPS sites. We ran a preliminary series of static inversions using the cumulative displacement over a month (from 17 April 2016 to 17 May 2016) to determine the maximum area potentially experiencing
postseismic slip. We chose an area between latitudes of 2°S and 1.2°N and from the trench to a depth of 85 km that conservatively encompasses the postseismic slip found in all models. The area was discretized into quasi-equilateral triangles with 10-km-long edges. To speed up the calculation, small triangles where all models found no postseismic slip were merged into quasi-equilateral triangles with 30-km-long edges. Our geometry, together with the GPS sites, is shown in fig. S1.
We used the Euler pole for the Nazca plate/North Andean Sliver relative motion defined by Nocquet et al. (33) to calculate the rake of slip at every triangular subfault. We ran inversions with a variable rake to test whether departure from the plate motion direction was re-quired by the GPS data. We found that variable rake inversion did not significantly reduce the misfit to the GPS data, and all subsequent inversions used a rake fixed to the value predicted by the Nazca plate/ North Andean Sliver relative motion.
For the kinematic modeling of slip, our inversion method solved for the slip increment at each subfault between two successive dates of the GPS time series. Regularization constraints were imposed by a model covariance matrix simultaneously controlling the level of damping and smoothing with respect to an a priori model (33, 35) taken here as 0. The linear system was solved using least squares with a non-negativity constraint. The model covariance matrix was taken as an isotropic decreasing exponential: Cmij=s2exp(−dij/Dc), where Cmijis the model covariance matrix elements corresponding to the ith and jth subfaults, s is a constant (unit in mm/√day), dijis the distance between the center of subfaults i and j, and Dc is a correlation length controlling the level of spatial smoothing.s controls the weight given to the regularization and reflects an average value of the slip increment between two successive GPS observations. No temporal smoothing was added aside from the non-negativity constraint imposing that slip must grow through time. In this approach, decreasing values ofs and increasing values of Dc provide smoother models. We used a two-dimensional (2D) L-curve criterion to choose the smoothest model that explains the GPS data, corresponding tos = 15 mm/√day and Dc = 80 km (fig. S2), providing residuals with a weighted root mean square of 1.7 mm on the horizontal components and a reducedc2 (sum of squared residuals divided by the number of observations) of 3.7. The fit for this reference model to the CGPS time series is shown in fig. S3.
As an additional test, we included vertical GPS time series in the inversions. The daily repeatability for the vertical component was around 9 mm for all sites. No clear signal could be extracted, and the models derived using horizontal components fit the vertical time series within their uncertainties. Because vertical time series did not provide additional constraints to the temporal evolution of slip, we did not include them for our final models. We performed several tests to assess how robust the main patterns of the inverted postseismic slip were (see text in the Supplementary Materials and figs. S4 to S6). Coulomb failure stress analysis
We calculated the static Coulomb failure stress changes (DCFS) in-duced by the 2016 Pedernales earthquake at the subduction interface (Fig. 1), becauseDCFS is usually assumed to be a parameter control-ling the postseismic slip distribution for rate-strengthening areas. The DCFS relates to the shear stress change and normal stress change by DCFS = Dt – m Dsn, whereDt is the change in shear stress, m is the effective friction, andDsnis the change in normal stress. We used the coseismic slip distribution from Nocquet et al. (7) for slip larger
on January 8, 2021
http://advances.sciencemag.org/
than 1 m, roughly 20% of the maximum slip. The geometry of the subduction interface was from the SLAB1.0 model (34). In these cal-culations, we assumedm = 0.6 and a rake from the Nazca/North Andean Sliver relative motion (33). If afterslip is controlled by rate-strengthening regions adjacent to the rupture, then we expect afterslip to develop in areas where stress perturbation is large. On the northern patch, afterslip initiated and grew to its maximum value at 80.39°W and 0.56°N, where theDCFS from the 2016 earthquake was +0.66 bars. On the southern patch, afterslip initiated and grew to its maximum value at 80.73°W and 0.28°S, where the DCFS from the 2016 earthquake was +2.54 bars. Both values were small compared to other postseismic observations where theDCFS that induced the large after-slip was of the order of a few tens of bars (1–3).
Postseismic deformation and rate-strengthening friction law Previous studies of large and great subduction earthquakes interpreted the postseismic slip as the response of rate-strengthening regions to the earthquake stress increment. This view was supported by four ob-servations: (i) Areas of large afterslip correlate with areas of low inter-seismic locking; (ii) the logarithmic decay of slip rate through time is well reproduced by the prediction of a simple single degree of freedom spring-slider system with rate-strengthening friction; (iii) the rate of post-earthquake seismicity has a similar logarithmic decay, also predicted by the rate-strengthening law; and (iv) the amount of total afterslip scales with the stress increment (1–3). Hereafter, we evaluated each of these four characteristics in the case of the Pedernales earthquake. Comparison of afterslip with the interseismic
locking distribution
Figure 4B shows that areas of large afterslip do not always correlate with areas of low interseismic locking. Specifically, the southern patch of large afterslip took place in an area that was highly locked in the years preceding the Pedernales earthquake [see resolution analysis for the interseismic models in the supplementary materials of Nocquet et al. (7)].
Logarithmic decay of slip
We can reproduce the logarithmic decay of slip rate through time by the prediction of a single degree of freedom spring-slider system with rate-strengthening friction for the northern afterslip patch (fig. S7). However, compared to previous studies using the same approach, the afterslip appeared to be unusually large and rapid (fig. S7). This approach cannot be applied to the southern afterslip patch because it was locked before the Pedernales earthquake. However, large and rapid afterslip was also observed at the southern patch, similarly to the northern patch of high afterslip.
Rate and location of aftershocks
The aftershock catalog used in the study was from the Ecuadorian National Seismic Network (RENSIG) operated by the Geophysical Institute of the National Polytechnic School (IGEPN) in Quito. The cat-alog is freely available at www.igepn.edu.ec/mapas/mapa-eq20160416. html, and the operational seismic network used for the automatic de-termination of location and magnitude can be seen at www.igepn.edu. ec/red-nacional-de-sismografos.
Post-earthquake seismicity over 30 days occurred mainly at shal-low (<25 km) depth at areas experiencing the largest amount of aseismic slip. Furthermore, the time evolution of the post-earthquake seismicity rate was similar to that of aseismic slip (Fig. 3), suggesting that the aseismic slip drove the time evolution and location of after-shocks. Logarithmic decay in seismicity rate was observed for the areas located updip of the rupture. The spatial distribution of aftershocks
further appeared to reproduce the pattern of seismicity observed dur-ing swarms in the interseismic periods [see figure 8 in the study of Font et al. (16)], likely associated with SSEs.
Finite amount of afterslip
The amount of total afterslip, point (iv) above, in the rate and state formalism, implies that the afterslip cannot exceed a value given by
uðt ¼ ∞Þ ≈ DCFF=k ð1Þ
where k is the equivalent stiffness of the elastic medium surrounding the fault defined by k = G/H (G is the shear modulus and H is the characteristic size of the zone experiencing the afterslip) (36).
Equation 1 thus provides a simple scaling test that can then be used to infer whether a given aseismic slip following an earthquake is physically compatible with the view of afterslip being the frictional response of a rate-strengthening area to the static stress increment induced by the mainshock.
We calculated the amount of afterslip predicted by Eq. 1 for the northern afterslip patch coinciding with a lowly coupled area. With a DCFS of 0.66 bars and a characteristic size of 70 km, the predicted max-imum amount of afterslip was 0.15 m. The maxmax-imum afterslip we ob-served was 0.4 to 0.7 m (Fig. 2A). The amount of afterslip averaged over the whole patch was 0.3 m. These observations were for a 1-month post-seismic time period. They indicated that the afterslip we observed was large and that the Coulomb stress increment was likely too small to solely explain the observed slip as a response of a rate-strengthening area. Shallow SSEs, seismic swarms, and repeating earthquakes before the 2016 Pedernales earthquake
The La Plata area (latitude, 1.3°S; longitude, 81.1°W; Fig. 4), cor-responding to the area of the triggered SSE, is the best-documented region along the Ecuador subduction zone for frequent SSEs, seismic swarms, and/or repeating earthquakes, which have been recorded in 1977, 1998, 2002, 2005, 2010, and 2013 (13–15). Two SSEs, Mw6.0 and 6.3, were detected geodetically in 2010 and 2013 and are associated with repeating earthquakes and/or seismic swarms with a total seismic moment release equivalent to Mw4.2 to 4.8 (Fig. 4) (13, 14). As in other shallow SSE-prone subduction zones (9, 37, 38), seismic swarms asso-ciated with SSE accounts for at most a few percent (1 to 3%) of the total released moment. Scaling laws for SSEs also suggested that the equivalent moment release of an SSE scaled with its characteristic duration (39). The largest seismic swarm in 2005 lasted for 3 months for which scaling laws (39) would predict a moment release equivalent to Mw~6.9.
The 2016 triggered SSE had a total duration of 25 days and equivalent magnitudes of Mw6.7 to 6.8. During the period of occur-rence of the SSE, the earthquake catalog from the Geophysical Insti-tute of Ecuador (IGEPN) showed a rate of seismic events higher than in the previous months, with 139 events of magnitude between 3.0 and 5.6. The seismicity rate follows the time evolution of the slip rate (Fig. 3E), an observation that shows that the seismicity is driven by the SSE. The seismicity released a seismic moment equivalent to a Mw5.8 earthquake, which was about 3% of the moment derived from the inversion of the GPS data. The moment released during the 2016 triggered SSE roughly corresponded to the moment deficit accumu-lated since the previous last large swarm that occurred in 2005 (40), suggesting that this area persistently released the accumulated stress through episodic transient aseismic slip.
Two other areas along the Ecuador subduction are the locus of fre-quent seismic swarms detected since 1994, the Punta Galera–Mompiche
on January 8, 2021
http://advances.sciencemag.org/
zone (PGMZ; 0.5°N, 80.4°W; Fig. 4) and the Jama–Cabo Pasado zone (JCPZ; 0.3°S, 80.7°W; Fig. 4), corresponding to the northern and southern patches of high afterslip. In the PGMZ, seismic swarms were regularly detected with a typical recurrence time of 2 years (17), attest-ing here again the occurrence of frequent SSEs. They lasted from a few days to up to 2 months. Only the events relocated by Font et al. (16) are shown in Fig. 4. The largest swarm in 2007 lasted 1.5 months, with a total seismic moment release equivalent to Mw5.4, suggesting large aseismic slip. A 5-week-long SSE was geodetically observed in 2013 (Mw6.3) associated with a seismic swarm (Mw4.4) and repeating earthquakes (17), also reported in Fig. 4. In the JCPZ, seismic swarms were detected in 1996, 2000, 2010, and 2015 (fig. S8) and are also re-ported in Fig. 4, only for the events relocated by Font et al. (16). The two largest swarms occurred in 1996 and 2000 with a duration of 2 months each and had a cumulated seismic moment release equivalent to Mw5.6 and 5.8, respectively. Shorter seismic swarms with durations of 4 and 20 days also occurred in 2010 and 2015 with equivalent moment release of Mw4.5 and 4.1, respectively.
We also investigated the possible occurrence of frequent SSEs in the JCPZ during the years preceding the Pedernales earthquake by searching for repeating earthquakes using a cross-correlation technique (41). We used continuous records of the vertical component of broad-band seismic station CABP (0.4°S, 80.4°W), installed in spring 2009. We first extracted 50 template waveforms for earthquakes within the JCPZ, with events chosen to be spatially distributed as uniformly as possible over the area. Each template was 18 s long, was filtered be-tween 2 and 8 Hz, and was resampled to 50 Hz. For each template waveform, we performed a loop across the 7 years of data to compute cross-correlation (CC) coefficients between the template and sliding windows of the continuous signal between April 2009 and April 2016. We counted as a repeat any time window with a CC coefficient of≥0.7. From these 50 original templates, we kept 11 families with a number of members per family ranging between 4 and 11 events. Examples of family activation are given in fig. S9. The cumulative number of repeaters over the time period 2009–2016 identified repeat-ing earthquake activity in 2010, 2011, and 2015 (fig. S9). The location of the repeaters found here is reported in Fig. 4. The southern patch of high afterslip was thus the locus of frequent seismic swarms and re-peating earthquake activities attesting to frequent SSEs in that area. The 2015 deep SSE
We found westward transient displacements over a 2-month period starting in July 2015 for nine sites located from the coast to the western Andes. To increase the signal-to-noise ratio and extract the signal, time series were expressed with respect to an optimized local reference frame defined from seven sites surrounding the area, a procedure that was equivalent to removing the regional common mode motion and seasonal terms. We used the same time-dependent slip inversion procedure as for the postseismic slip described above. The resulting slip distribution (fig. S10) showed that the SSE occurred at depths be-tween 50 and 70 km with a maximum slip of 0.2 m. The deep SSE had an equivalent magnitude of Mw6.7.
SUPPLEMENTARY MATERIALS
Supplementary material for this article is available at http://advances.sciencemag.org/cgi/ content/full/4/1/eaao6596/DC1
Resolution of the inversion and sensitivity tests Slip amount required on the northern patch Slip amount required on the southern patch
Slip amount required on the deep patch
Slip amount required updip of the 2016 earthquake rupture area fig. S1. Subduction interface geometry and GPS data used in the study. fig. S2. 2D L-curve.
fig. S3. CGPS east post-earthquake displacement time series (in centimeters). fig. S4. Sensitivity test to the CGPS network.
fig. S5. Resolution test for the northern and southern patches. fig. S6. Resolution test for the updip slip and the deep patch. fig. S7. Slip evolution and rate-strengthening friction.
fig. S8. Earthquake swarms in the JCPZ (southern patch of high afterslip). fig. S9. Repeating earthquakes in the JCPZ (southern patch of high afterslip). fig. S10. Deep SSE.
REFERENCES AND NOTES
1. Y.-J. Hsu, M. Simons, J.-P. Avouac, J. Galetzka, K. Sieh, M. Chlieh, D. Natawidjaja, L. Prawirodirdjo, Y. Bock, Frictional afterslip following the 2005 Nias-Simeulue earthquake, Sumatra. Science 312, 1921–1926 (2006).
2. H. Perfettini, J.-P. Avouac, H. Tavera, A. Kositsky, J.-M. Nocquet, F. Bondoux, M. Chlieh, A. Sladen, L. Audin, D. L. Farber, P. Soler, Seismic and aseismic slip on the Central Peru megathrust. Nature 465, 78–81 (2010).
3. Y.-n. N. Lin, A. Sladen, F. Ortega-Culaciati, M. Simons, J.-P. Avouac, E. J. Fielding, B. A. Brooks, M. Bevis, J. Genrich, A. Rietbrock, C. Vigny, R. Smalley, A. Socquet, Coseismic and postseismic slip associated with the 2010 Maule Earthquake, Chile: Characterizing the Arauco Peninsula barrier effect. J. Geophys. Res. Solid Earth 118, 3142–3159 (2013). 4. S. Ozawa, T. Nishimura, H. Munekane, H. Suito, T. Kobayashi, M. Tobita, T. Imakiire,
Preceding, coseismic, and postseismic slips of the 2011 Tohoku earthquake, Japan. J. Geophys. Res. Solid Earth 117, B07404 (2012).
5. J. H. Dieterich, Modeling of rock friction: 1. Experimental results and constitutive equations. J. Geophys. Res. 84, 2161–2168 (1979).
6. J.-P. Avouac, From geodetic imaging of seismic and aseismic fault slip to dynamic modeling of the seismic cycle. Annu. Rev. Earth Planet. Sci. 43, 233–271 (2015). 7. J.-M. Nocquet, P. Jarrin, M. Vallée, P. A. Mothes, R. Grandin, F. Rolandone, B. Delouis,
H. Yepes, Y. Font, D. Fuentes, M. Régnier, A. Laurendeau, D. Cisneros, S. Hernandez, A. Sladen, J.-C. Singaucho, H. Mora, J. Gomez, L. Montes, P. Charvis, Supercycle at the Ecuadorian subduction zone revealed after the 2016 Pedernales earthquake. Nat. Geosci. 10, 145–149 (2017).
8. L. Ye, H. Kanamori, J.-P. Avouac, L. Li, K. F. Cheung, T. Lay, The 16 April 2016, MW7.8 (MS7.5)
Ecuador earthquake: A quasi-repeat of the 1942 MS7.5 earthquake and partial re-rupture of the
1906 MS8.6 Colombia–Ecuador earthquake. Earth Planet. Sci. Lett. 454, 248–258 (2016).
9. L. M. Wallace, J. Beavan, S. Bannister, C. Williams, Simultaneous long-term and short-term slow slip events at the Hikurangi subduction margin, New Zealand: Implications for processes that control slow slip event occurrence, duration, and migration. J. Geophys. Res. Solid Earth 117, B11402 (2012).
10. J. C. Hawthorne, A. M. Rubin, Tidal modulation of slow slip in Cascadia. J. Geophys. Res. Solid Earth 115, B09406 (2010).
11. H. Hirose, H. Kimura, B. Enescu, S. Aoi, Recurrent slow slip event likely hastened by the 2011 Tohoku earthquake. Proc. Natl. Acad. Sci. U.S.A. 109, 15157–15161 (2012). 12. N. Uchida, T. Iinuma, R. M. Nadeau, R. Bürgmann, R. Hino, Periodic slow slip triggers
megathrust zone earthquakes in northeastern Japan. Science 351, 488–492 (2016). 13. M. Vallée, J.-M. Nocquet, J. Battaglia, Y. Font, M. Segovia, M. Régnier, P. Mothes,
P. Jarrin, D. Cisneros, S. Vaca, H. Yepes, X. Martin, N. Béthoux, M. Chlieh, Intense interface seismicity triggered by a shallow slow slip event in the Central Ecuador subduction zone. J. Geophys. Res. Solid Earth 118, 2965–2981 (2013).
14. M. Segovia, Y. Font, M. M. Regnier, P. Charvis, J.-M. Nocquet, A. Galve, Y. Hello, A. Ogé, P. Jarrin, M. C. Ruiz, Intense microseismicity associated with a SSE at La Plata Island in the central subduction zone of Ecuador. Am. Geophys. Union Fall Meet. 2015, S31A-2736 (2015).
15. S. G. Holtkamp, M. E. Pritchard, R. B. Lohman, Earthquake swarms in South America. Geophys. J. Int. 187, 128–146 (2011).
16. Y. Font, M. Segovia, S. Vaca, T. Theunissen, Seismicity patterns along the Ecuadorian subduction zone: New constraints from earthquake location in a 3-D a priori velocity model. Geophys. J. Int. 193, 263–286 (2013).
17. S. Vaca, M. Vallée, J.-M. Nocquet, J. Battaglia, M. M. Regnier, Recurrent slow slip events acting as barriers for the northward rupture propagation of the 2016 Pedernales earthquake (Central Ecuador). Am. Geophys. Union Fall Gen. Assem. 2016, T51E-2984 (2016). 18. P. A. Mothes, J.-M. Nocquet, P. Jarrín, Continuous GPS network operating throughout
Ecuador. Eos. Trans. AGU 94, 229–231 (2013).
19. A. M. Rubin, Episodic slow slip events and rate-and-state friction. J. Geophys. Res. Solid Earth 113, B11414 (2008).
20. Y. Liu, J. R. Rice, Spontaneous and triggered aseismic deformation transients in a subduction fault model. J. Geophys. Res. Solid Earth 112, B09404 (2007).
on January 8, 2021
http://advances.sciencemag.org/
21. H. Noda, N. Lapusta, Stable creeping fault segments can become destructive as a result of dynamic weakening. Nature 493, 518–521 (2013).
22. D. M. Veedu, S. Barbot, The Parkfield tremors reveal slow and fast ruptures on the same asperity. Nature 532, 361–365 (2016).
23. N. Cubas, N. Lapusta, J.-P. Avouac, H. Perfettini, Numerical modeling of long-term earthquake sequences on the NE Japan megathrust: Comparison with observations and implications for fault friction. Earth Planet. Sci. Lett. 419, 187–198 (2015).
24. P. Segall, Earthquake and Volcano Deformation (Princeton Univ. Press, 2010). 25. T. H. Dixon, Y. Jiang, R. Malservisi, R. McCaffrey, N. Voss, M. Protti, V. Gonzalez,
Earthquake and tsunami forecasts: Relation of slow slip events to subsequent earthquake rupture. Proc. Natl. Acad. Sci. U.S.A. 111, 17039–17044 (2014).
26. M. Radiguet, H. Perfettini, N. Cotte, A. Gualandi, B. Valette, V. Kostoglodov, T. Lhomme, A. Walpersdorf, E. C. Cano, M. Campillo, Triggering of the 2014 Mw7.3 Papanoa
earthquake by a slow slip event in Guerrero, Mexico. Nat. Geosci. 9, 829–833 (2016). 27. M. Bouchon, H. Karabulut, M. Aktar, S. Özalaybey, J. Schmittbuhl, M.-P. Bouin, Extended
nucleation of the 1999 Mw7.6 Izmit earthquake. Science 331, 877–880 (2011).
28. A. Kato, K. Obara, T. Igarashi, H. Tsuruoka, S. Nakagawa, N. Hirata, Propagation of slow slip leading up to the 2011 Mw9.0 Tohoku-Oki earthquake. Science 335, 705–708 (2012).
29. L. Meng, H. Huang, R. Bürgmann, J. P. Ampuero, A. Strader, Dual megathrust slip behaviors of the 2014 Iquique earthquake sequence. Earth Planet. Sci. Lett. 411, 177–187 (2015). 30. A. Socquet, J. Piña Valdes, J. Jara, F. Cotton, A. Walpersdorf, N. Cotte, S. Specht,
F. Ortega-Culaciati, D. Carrizo, E. Norabuena, An 8 month slow slip event triggers progressive nucleation of the 2014 Chile megathrust. Geophys. Res. Lett. 44, 4046–4053 (2017). 31. S. Ruiz, M. Metois, A. Fuenzalida, J. Ruiz, F. Leyton, R. Grandin, C. Vigny, R. Madariaga,
J. Campos, Intense foreshocks and a slow slip event preceded the 2014 Iquique Mw8.1
earthquake. Science 345, 1165–1169 (2014).
32. T. A. Herring, M. A. Floyd, R. W. King, S. C. McClusky, GAMIT/GLOBK Reference Manual, Release 10.6 (Massachusetts Institute of Technology, 2015).
33. J.-M. Nocquet, J. C. Villegas-Lanza, M. Chlieh, P. A. Mothes, F. Rolandone, P. Jarrin, D. Cisneros, A. Alvarado, L. Audin, F. Bondoux, X. Martin, Y. Font, M. Régnier, M. Vallée, T. Tran, C. Beauval, J. M. Maguiña Mendoza, W. Martinez, H. Tavera, H. Yepes, Motion of continental slivers and creeping subduction in the northern Andes. Nat. Geosci. 7, 287–291 (2014). 34. G. P. Hayes, D. J. Wald, R. L. Johnson, Slab1.0: A three-dimensional model of global
subduction zone geometries. J. Geophys. Res. Solid Earth 117, B01302 (2012). 35. A. Tarantola, B. Valette, Generalized nonlinear inverse problems solved using the least
squares criterion. Rev. Geophys. 20, 219–232 (1982).
36. H. Perfettini, J.-P. Avouac, Postseismic relaxation driven by brittle creep: A possible mechanism to reconcile geodetic measurements and the decay rate of aftershocks, application to the Chi-Chi earthquake, Taiwan. J. Geophys. Res. Solid Earth 109, B02304 (2004).
37. S. Ozawa, H. Suito, M. Tobita, Occurrence of quasi-periodic slow-slip off the east coast of the Boso peninsula, central Japan. Earth Planets Space 59, 1241–1245 (2007). 38. E. J. Delahaye, J. Townend, M. E. Reyners, G. Rogers, Microseismicity but no tremor
accompanying slow slip in the Hikurangi subduction zone, New Zealand. Earth Planet. Sci. Lett. 277, 21–28 (2009).
39. S. Ide, G. C. Beroza, D. R. Shelly, T. Uchide, A scaling law for slow earthquakes. Nature 447, 76–79 (2007).
40. J.-Y. Collot, E. Sanclemente, J.-M. Nocquet, A. Leprêtre, A. Ribodetti, P. Jarrin, M. Chlieh, D. Graindorge, P. Charvis, Subducted oceanic relief locks the shallow megathrust in central Ecuador. J. Geophys. Res. Solid Earth 122, 3286–3305 (2017).
41. S. J. Gibbons, F. Ringdal, The detection of low magnitude seismic events using array-based waveform correlation. Geophys. J. Int. 165, 149–166 (2006).
42. G. Ekström, M. Nettles, A. M. Dziewoński, The global CMT project 2004–2010: Centroid-moment tensors for 13,017 earthquakes. Phys. Earth Planet. Inter. 200–201, 1–9 (2012).
Acknowledgments: We thank the Instituto Geográfico Militar for the use of their GPS data and the IGEPN for the use of their aftershock catalog. We are grateful to the International GNSS Service network (www.igs.org) for free access to their data. Support from the IRD office in Quito during the post-earthquake survey is acknowledged. Funding: This work was supported by the Institut de Recherche pour le Développement of France (IRD) and the Instituto Geofísico, Escuela Politécnica Nacional (IGEPN), Quito, Ecuador, in the frame of the Joint International Laboratory“Earthquakes and Volcanoes in the Northern Andes.” Previous funding from the Agence Nationale de la Recherche of France (grant ANR-07-BLAN-0143-01), SENESCYT (grant Fortalecimiento del Instituto Geofísico), and SENPLADES (grant Generación de Capacidades para la Difusión de Alertas Tempranas) from Ecuador as well as current funding from the ANR REMAKE (grant ANR-15-CE04-004) and E-POST (grant ANR-14-CE03-0002) are acknowledged. Author contributions: F.R. coordinated the study, performed the research, analyzed the data, and wrote the manuscript with J.-M.N., M.V., and N.C. J.-M.N. performed the research, analyzed the data, developed the time-dependent slip inversion code, and carried out the resolution tests. J.-M.N., F.R., and P.J. performed the GPS analysis. P.A.M., P.J., F.R., and J.-M.N. carried out the field work to collect the data after the earthquake. M.V. and N.C. participated in overall interpretation. S.H. and M.P. performed the repeating earthquake analyses. S.V. analyzed the northern SSE sequence. Y.F. helped with the seismicity discussion. All authors discussed the results and edited the manuscript. Competing interests: The authors declare that they have no competing interests. Data and materials availability: All data needed to evaluate the conclusions in the paper are present in the paper and/or the Supplementary Materials. Additional data related to this paper may be requested from the corresponding author.
Submitted 12 August 2017 Accepted 3 January 2018 Published 31 January 2018 10.1126/sciadv.aao6596
Citation:F. Rolandone, J.-M. Nocquet, P. A. Mothes, P. Jarrin, M. Vallée, N. Cubas, S. Hernandez, M. Plain, S. Vaca, Y. Font, Areas prone to slow slip events impede earthquake rupture propagation and promote afterslip. Sci. Adv. 4, eaao6596 (2018).
on January 8, 2021
http://advances.sciencemag.org/
Hernandez, Morgan Plain, Sandro Vaca and Yvonne Font
Frederique Rolandone, Jean-Mathieu Nocquet, Patricia A. Mothes, Paul Jarrin, Martin Vallée, Nadaya Cubas, Stephen
DOI: 10.1126/sciadv.aao6596 (1), eaao6596. 4
Sci Adv
ARTICLE TOOLS http://advances.sciencemag.org/content/4/1/eaao6596
MATERIALS
SUPPLEMENTARY http://advances.sciencemag.org/content/suppl/2018/01/29/4.1.eaao6596.DC1
REFERENCES
http://advances.sciencemag.org/content/4/1/eaao6596#BIBL This article cites 40 articles, 7 of which you can access for free
PERMISSIONS http://www.sciencemag.org/help/reprints-and-permissions
Terms of Service Use of this article is subject to the
is a registered trademark of AAAS. Science Advances
York Avenue NW, Washington, DC 20005. The title
(ISSN 2375-2548) is published by the American Association for the Advancement of Science, 1200 New Science Advances
License 4.0 (CC BY-NC).
Science. No claim to original U.S. Government Works. Distributed under a Creative Commons Attribution NonCommercial Copyright © 2018 The Authors, some rights reserved; exclusive licensee American Association for the Advancement of
on January 8, 2021
http://advances.sciencemag.org/