HAL Id: inserm-01325021
https://www.hal.inserm.fr/inserm-01325021
Submitted on 1 Jun 2016HAL is a multi-disciplinary open access archive for the deposit and dissemination of sci-entific research documents, whether they are pub-lished or not. The documents may come from teaching and research institutions in France or abroad, or from public or private research centers.
L’archive ouverte pluridisciplinaire HAL, est destinée au dépôt et à la diffusion de documents scientifiques de niveau recherche, publiés ou non, émanant des établissements d’enseignement et de recherche français ou étrangers, des laboratoires publics ou privés.
Longitudinal study of maternal body mass index,
gestational weight gain, and offspring asthma.
Orianne Dumas, Raphaëlle Varraso, Matthew Gillman, Alison Field, Carlos
Camargo
To cite this version:
Orianne Dumas, Raphaëlle Varraso, Matthew Gillman, Alison Field, Carlos Camargo. Longitudi-nal study of materLongitudi-nal body mass index, gestatioLongitudi-nal weight gain, and offspring asthma.: MaterLongitudi-nal BMI, gestational weight gain, and asthma. Allergy, Wiley, 2016, ahead of print. �10.1111/all.12876�. �inserm-01325021�
1
Longitudinal study of maternal body mass index, gestational weight gain, and offspring asthma
Orianne Dumas1,2,3,4, Raphaëlle Varraso3,4, Matthew W. Gillman5, Alison E. Field1,6,7, and Carlos
A. Camargo Jr1,2,7.
1. Channing Division of Network Medicine, Department of Medicine, Brigham & Women’s Hospital and Harvard Medical School, Boston, MA, USA
2. Department of Emergency Medicine, Massachusetts General Hospital and Harvard Medical School, Boston, MA, USA
3. INSERM, VIMA: Aging and chronic diseases. Epidemiological and public health approaches, U1168, F-94807, Villejuif, France
4. UVSQ, UMR-S 1168, Université Versailles St-Quentin-en-Yvelines, F-78180, Montigny le Bretonneux, France
5. Department of Population Medicine, Harvard Medical School and Harvard Pilgrim Health Care Institute, Boston, MA, USA
6. Division of Adolescent Medicine, Boston Children's Hospital, and Harvard Medical School, Boston, MA, USA
7. Department of Epidemiology, Harvard T.H. Chan School of Public Health, Boston, MA, USA
Correspondence
Carlos A. Camargo Jr., MD, DrPH Department of Emergency Medicine
2 Massachusetts General Hospital
125 Nashua Street, Suite 920 Boston, MA 02114-1101 USA
Tel: 617-726-5276. Fax: 617-724-4050. eMail: ccamargo@partners.org
Short title: Maternal BMI, gestational weight gain, and asthma
Keywords: Allergy; Childhood Asthma; DOHaD; gestational weight gain; maternal obesity; Word count: 3,516 words
References: 45 Figure/Tables: 5
3
ABSTRACT
Background: Sparse data are available on the relationship between prenatal exposures and
asthma during later childhood. In a longitudinal study of adolescents and their mothers, we examined the association of (1) maternal pre-pregnancy body mass index (BMI) and (2) gestational weight gain (GWG), with incidence of allergic and non-allergic asthma in offspring.
Methods: Analyses were conducted using data from 12,963 children aged 9-14 years at
enrollment in the Growing Up Today Study, and their mothers, who are participants in the Nurses’ Health Study II. Physician-diagnosed asthma and allergies were assessed by questionnaires sent regularly to participants and their mothers. Logistic regression was used to evaluate associations of maternal BMI and GWG with offspring asthma, overall and by subtype.
Results: Physician-diagnosed asthma during childhood or adolescence was reported by 2,694
children (21%). Maternal pre-pregnancy overweight (OR: 1.19, 95% CI: 1.03-1.38) and obesity (1.34, 1.08-1.68) were associated with offspring asthma. In asthma subtype analyses, the association was seen only for asthma onset before age 12 years. Moreover, the association of maternal obesity with non-allergic asthma was observed in boys (2.39, 1.40-4.09) and not in girls (0.96, 0.50-1.85; Pinteraction=0.03); the opposite pattern was suggested for allergic asthma. With
regard to GWG, an association was suggested between gains of <15 lb and higher risk of offspring asthma (1.28, 0.98-1.66), without clear allergy- or sex-related patterns.
Conclusion: The relation of several prenatal factors to risk of childhood asthma supports the
early origins hypothesis for asthma. The observed allergy- and sex-specific patterns suggest multiple etiologic pathways.
4
INTRODUCTION
Asthma is a worldwide public health problem (1), affecting almost 10% of U.S. children (2). The growing body of research on the Developmental Origins of Health and Disease (DOHaD) has underlined the impact of the prenatal and perinatal environment in lifelong health (3–5). Although asthma and allergies affect individuals of all ages, and result from complex interactions between genetic and environmental factors throughout life, it is widely accepted that they have origins early in life (6,7). A better knowledge of risk factors for asthma as early as in-utero could offer opportunities for primary prevention (8–10).
Recently, several prospective cohort studies have shown associations between a high maternal body mass index (BMI) before or during pregnancy, and risk of asthma during early childhood (11–19). The independent role of gestational weight gain (GWG) has received less attention (13,15,20), and the results of a recent meta-analysis were not entirely consistent, although a positive association with childhood asthma or wheeze was suggested (11). Moreover, few studies have examined the associations between prenatal and perinatal exposures and asthma incidence during later childhood and adolescence (18).
The mechanisms for any link between maternal BMI and GWG to offspring asthma remain poorly understood. While a relationship between maternal BMI and childhood asthma is consistently observed (11), associations with allergic phenotypes (e.g., eczema, hay fever, skin sensitization to allergens) are lacking (14,15,18,19), suggesting a potential role for non-allergic pathways. Asthma in obese patients is increasingly regarded as a unique phenotype, characterized by non-allergic mechanisms (21,22). A recent study (23) showed an association between obesity and asthma only among children with a low Fractional Exhaled Nitric Oxide, a marker of eosinophilic airway inflammation. This result further supports non-allergic pathways
5 in the relationship between obesity and asthma inception. However, data on the associations between maternal BMI and GWG with the risk of developing allergic and non-allergic asthma remain scarce. Finally, despite well-known sex differences in the natural history of asthma (24,25), with a switch in male to female ratio in asthma incidence during adolescence, and gender difference in the obesity-asthma relationship in childhood (26), very limited data are available regarding sex-specific associations of maternal BMI and GWG with asthma outcomes (27).
To address this knowledge gap, we examined longitudinal data from pre-adolescents and adolescents, and their mothers, to investigate the association of (i) maternal pre-pregnancy BMI and (ii) GWG, with incidence of allergic and non-allergic asthma in offspring. We also examined effect modification by the child’s sex.
METHODS
Study design and data collection
The Growing Up Today Study (GUTS) was initiated in 1996. The original cohort comprised 9,039 girls and 7,842 boys born in the 1980s and living throughout the United States. The participants are children of women in the Nurses’ Health Study II (NHSII), a prospective cohort study of female registered nurses. Details of the GUTS cohort recruitment have been published previously (28,29). From age 9-14 years, participants were mailed questionnaires approximately annually, to collect a variety of information pertaining to adolescent health. The current study uses data from 1996, 1997, 1998 and 1999 questionnaires, when all participants were aged <18 years. The response rates to one or more questionnaires in 1997-1999 were 89% in boys and 94% in girls. GUTS participant’s mothers were also sent supplemental
6 questionnaires in 1997, 1999, and 2004, regarding their children’s health, and pre-natal and early-life risk factors; 99% of mothers completed one or more questionnaires. The current analysis was approved by the human subjects committees at Harvard School of Public Health and Brigham and Women's Hospital, Boston, Massachusetts.
Asthma and allergies
The main outcome was the incidence of allergic and non-allergic asthma during childhood or adolescence. Asthma was defined by the self-report of physician-diagnosed asthma on any questionnaires (“Has a doctor ever said you have asthma?”) from 1996 through 1999. A more stringent definition of asthma, involving further confirmation of child’s physician-diagnosis of asthma by the mother, was used in sensitivity analyses. Age at asthma onset was estimated as the minimum value between age at onset reported in mothers’ questionnaires (available for 93% of children with asthma), or age at onset calculated based on the first time that incident asthma was reported by the GUTS participant on their annual questionnaires from 1997 through 1999 (among those who did not report asthma at baseline in 1996). Age at asthma onset was then classified as <6, 6-11.9 and 12-17.9 years.
Allergy was assessed by a question about whether the child’s doctor had ever diagnosed the child with “hay fever, seasonal allergies or allergic rhinitis” asked in GUTS mothers’ questionnaires in 1997, 1999, and 2004 and in GUTS participants’ questionnaire in 2007. Because we hypothesized that maternal BMI and GWG would be more strongly related to non-allergic asthma, we used a sensitive definition for allergy (i.e., a specific definition for "absence of allergy") in the main analyses, based on the mother or the offspring report of allergies in one or more questionnaires. A more specific definition for allergy, based on the mother and the
7 offspring report of allergies, was used in sensitivity analyses. The definitions used for asthma and allergies are summarized in table S1.
Participants with asthma and without allergies ("non-allergic asthma") and participants with asthma and allergies ("allergic asthma") were compared to participants without asthma.
Prenatal and perinatal exposures
The primary exposures of interest were maternal pre-pregnancy BMI and GWG. We also studied two closely related factors: gestational diabetes and the child’s birth weight. All variables were ascertained from either NHSII or GUTS mother’s questionnaires: pre-pregnancy BMI (kg/m2) was ascertained from the NHSII 1989 questionnaire (height) and 1999 GUTS mother’s questionnaires (pre-pregnancy weight); gestational weight gain (lb) and gestational diabetes were ascertained from 1999 GUTS mother’s questionnaires; and child’s birth weight was ascertained from 1997 GUTS mother’s questionnaires (see additional details in supporting information) (29). To evaluate potentially non-linear relationships, each variable was classified into 5 categories: pre-pregnancy BMI (< 20, 20-22.4, 22.5-24.9, 25-29.9, and ≥30 kg/m2), GWG (<15, 15-24,
25-34, 35-44, and ≥45 lb gained) and birth weight (<5.5, 5.5-6.9, 7.0-8.4, 8.5-9.9, and ≥10 lb).
Covariates
Maternal or early childhood risk factors considered as potential confounders are presented in figure 1 (directed acyclic graph), and were ascertained from either NHSII or GUTS mother’s questionnaires (see additional supporting information).
8
Statistical analyses
The associations between prenatal and perinatal exposures and offspring asthma, overall and by subtype, were evaluated in bivariate analyses and by multivariable logistic regressions. Familial dependence between children of the same mother was taken into account using generalized estimating equations (GEE). Separate models were used for each of the exposures of interest. Models for GWG, gestational diabetes and birth weight were adjusted for maternal pre-pregnancy BMI. We performed stratified analyses by sex and tested interaction in multivariable models. For all tests (including tests for interaction), a two-sided P<0.05 was considered statistically significant. All analyses were run using SAS V.9 (SAS Institute, Cary, North Carolina, USA).
RESULTS
Of the 16,875 children enrolled in GUTS, we excluded 437 children without asthma data, and 3,475 children without information on maternal pre-pregnancy BMI and GWG. This yielded an analytic cohort of 12,963. Comparison of included vs. excluded participants is presented in table S2. Participants without asthma data only differed from included participants for maternal smoking. Participants without information on maternal pre-pregnancy BMI and GWG differed from included participants for several characteristics; however, the observed differences were small, and in a multivariable model, only differences for maternal age at delivery, maternal asthma, breast feeding duration and birth order remained significant.
9 Before pregnancy, 11% of the mothers were overweight and 4% were obese (table 1). The average GWG was 31.2 lb (SD: 10.6). A higher pre-pregnancy BMI was associated with a lower GWG, higher risk of gestational diabetes, and a higher birth weight (table S3).
A total of 2,694 children (21%) reported physician-diagnosed asthma during childhood or adolescence, and for 88% of them, asthma was confirmed by their mother. When considering reports from either the mother or the offspring, 48% of the children ever had allergies. However, this proportion was much lower (17%) when considering a more stringent definition that required concordance between mother and child. Age at asthma onset was under 6 years for 46% of the children, between 6 and 11.9 years for 35% and after 12 years for 19%; among them, respectively 83%, 82% and 68% had allergic asthma.
Association between prenatal and perinatal exposures and asthma
In multivariable models, we observed a positive association between maternal pre-pregnancy BMI and offspring asthma (table 2). An increased offspring asthma risk was observed in overweight (BMI 25-29.9, Odds Ratio [OR]: 1.19, 95% Confidence Interval [CI]: 1.03-1.38) and obese women (BMI ≥30, OR: 1.34, 1.08-1.68) compared to women with BMI 20-22.4 kg/m2. As hypothesized, the association appeared stronger for non-allergic asthma than for
allergic asthma, although the difference was not statistically significant (P for comparison of allergic asthma vs. non-allergic asthma=0.12). While the association between maternal BMI and allergic asthma was observed only for the highest BMI category (obese, OR: 1.28, 1.00-1.64), the risk of non-allergic asthma increased from BMI category in the upper end of the “healthy” weight range (BMI 22.5-24.9 vs. 20-22.4 kg/m2: OR: 1.29, 1.03-1.62), and further increased
10 After adjustment for maternal pre-pregnancy BMI, there was a suggestive association between a low GWG (<15 lb vs. 25-34 lb) and increased risk of asthma (OR: 1.28, 95% CI: 0.98-1.66, P=0.07), without noticeable difference between allergic and non-allergic asthma. The association between GWG and offspring asthma did not differ according to maternal pre-pregnancy BMI (Pinteraction=0.37, table S4).
Gestational diabetes was not associated with offspring asthma. A suggestive association between low birth weight (<5.5 lb) and asthma was observed (OR: 1.25, 95% CI: 0.99-1.57, P=0.06), with a stronger and significant association for non-allergic asthma (OR: 1.72, 1.16-2.57; P for comparison of allergic asthma vs. non-allergic asthma=0.04). The association between low birth weight and non-allergic asthma was attenuated when further adjusting for preterm birth (OR: 1.45, 95% CI: 0.89-2.36).
When using a more stringent definition for asthma (table S5) or for allergy (table S6), all results were confirmed, with similar or stronger associations. In addition, we verified that studying associations between prenatal and perinatal exposures and asthma separately among allergic or non-allergic participants subgroups led to similar conclusions (table S7), as sometime recommended when analyzing allergic and non-allergic asthma (30).
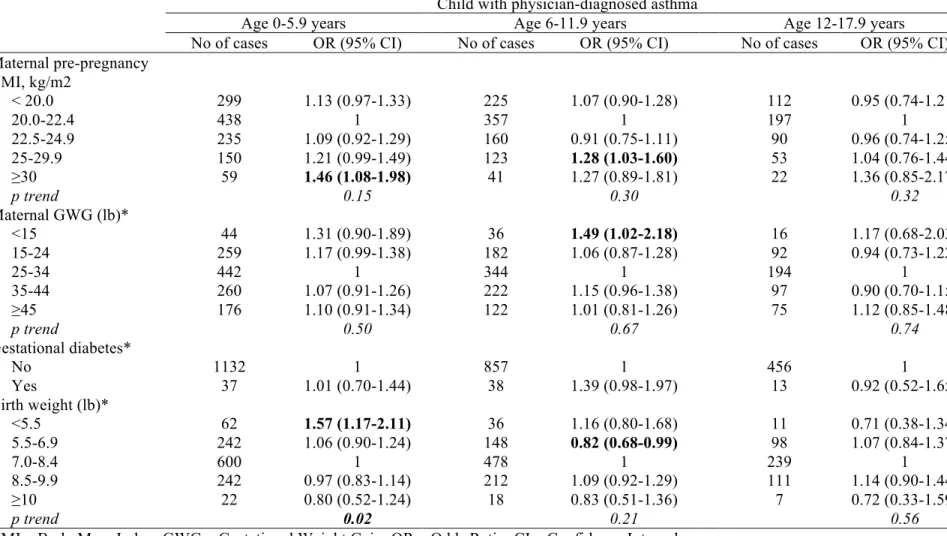
Age at asthma onset
Associations were generally more pronounced for early-onset asthma (0-5.9 years, table 3). We did not observe associations between prenatal and perinatal exposures and asthma incidence in adolescence (12-17.9 years). Associations between maternal BMI and asthma according to age at onset and allergy are presented in table S8. The association between maternal
11 BMI and early-onset asthma appeared stronger for non-allergic (OR for BMI≥30: 1.99, 95% CI: 1.06-3.73) than for allergic asthma (1.36, 0.97-1.90, p for comparison of allergic asthma vs. non-allergic asthma=0.26).
Effect modification by child sex
Associations between maternal pre-pregnancy obesity and asthma in childhood stratified by child’s sex are presented in figure 2. While no sex difference was observed in the association between maternal obesity and asthma overall, sex-specific patterns were observed for the associations with allergic and non-allergic asthma. In boys, an association was observed with non-allergic asthma (OR: 2.39, 95% CI: 1.40-4.09), while no association was present in girls (OR: 0.96, 95% CI: 0.50-1.85; Pinteraction=0.03). An association was observed with allergic asthma
(OR: 1.50, 95% CI: 1.08-2.08) in girls and not in boys (OR: 1.09, 95% CI: 0.76-1.56), but the difference was not statistically significant (Pinteraction=0.26). Results were confirmed when using a
more stringent definition for allergy. No clear sex-specific pattern emerged when studying associations with asthma according to age at onset. No effect modification was observed (Pinteraction ranged from 0.30 to 0.40) for GWG, gestational diabetes and birth weight (detailed
results not shown).
Potential mediators
Despite a positive association between delivery by C-section and offspring asthma (table 1), adjustment for mode of delivery did not change the associations between the exposures of interest and offspring asthma (OR for maternal BMI≥30: 1.37, 95% CI: 1.10-1.71). The association between maternal pre-pregnancy BMI and offspring asthma persisted after
12 adjustment for GWG (OR for BMI≥30: 1.28, 95% CI: 1.02-1.60) or for birth weight (OR for BMI≥30: 1.34, 95% CI: 1.07-1.68). Finally, the association between a low GWG and offspring asthma remained similar (OR: 1.28, 95% CI: 0.98-1.67) when further adjusting for the child’s birth weight and preterm birth.
DISCUSSION
In a longitudinal study of 12,963 children and adolescents and their mothers, we found that high maternal pre-pregnancy BMI, low GWG and low birth weight, were associated with an elevated risk of asthma in the offspring. Overall, stronger associations were observed with non-allergic asthma than with non-allergic asthma, but the associations varied by child sex.
Recent meta-analysis (11) and pooled analysis (12) found relatively modest associations between asthma or wheezing in early childhood and maternal overweight (OR: 1.13-1.18) or obesity (OR: 1.22-1.49). However, asthma is heterogeneous in terms of etiology and pathobiology (31). We thus hypothesized that maternal BMI may be more strongly associated with specific asthma subtypes. One subgroup of interest was early versus late childhood onset of asthma. Indeed, we found a stronger association of maternal BMI with asthma onset before age 6 and a suggested association with asthma onset at age 6-12, but no significant association with later asthma development. Similar results were observed in the only other study examining asthma prevalence from childhood through adolescence: among 3,294 Swedish children, early pregnancy maternal BMI was more strongly associated with prevalent asthma in early life than in adolescence (18).
Although allergic and non-allergic asthma are widely recognized asthma subtypes (31), studies examining their associations with maternal BMI and GWG are scarce. A few studies
13 reported an absence of association between maternal BMI and eczema, hay fever, or skin sensitization, indirectly suggesting a role for non-allergic pathways in the relationship between maternal BMI and childhood asthma (14–16,18,19). Indeed, we consistently found a stronger association of maternal BMI with non-allergic asthma than with allergic asthma. However, our results further suggest sex-specific patterns in this relationship, with a stronger association with non-allergic asthma in boys than in girls. Only one other study has examined sex-specific relationships with asthma outcomes for prenatal risk factors (27). In this Swedish registry-based study, investigators reported some evidence that maternal obesity was associated with a higher risk of inhaled corticosteroid use in childhood among girls, especially after age 6 years; however, allergy phenotypes were not studied.
Sex differences in asthma and atopic diseases are well-known (24–26,32), with a higher risk among males in childhood and among females in adolescence and adulthood. Hormone-related events are also associated with asthma and allergy in women (24,33). However, it is unclear at what ages sex differences in asthma originate (34), and factors other than hormones (e.g., lung growth, environmental factors) are likely to play a role (25,35). In the current study, in both boys and girls, the associations were mainly observed in children with asthma onset before the age of 12, suggesting that hormonal factors may not explain the observed sex differences. Although our results need replication, future research on the relationship between maternal BMI and asthma development should consider the existence of multiple, possibly sex-specific pathways.
Maternal GWG has been much less studied in relation to offspring asthma. Our results were suggestive of an association between a lower GWG and a higher risk of asthma, even after
14 adjustment for maternal BMI. A recent meta-analysis suggested an association with a high GWG (11), but the authors underlined the need for further studies, as only three studies investigated GWG and maternal BMI simultaneously. Two of these studies, including a much lower number of participants than the current study (13,20), reported positive association between GWG and wheezing or asthma. In a large Danish study of young children (15), a U-shaped relationship between GWG and asthma was suggested, although a significant association was observed only for high GWG (>25 kg), similarly in atopic and non-atopic children.
While the mechanisms by which high GWG may impact the child’s asthma may be related, as maternal BMI, to a specific inflammatory state associated with adiposity (11), different pathways are likely to be involved in a potential effect of a low GWG. Low GWG is associated with intrauterine growth restriction (36), which is a risk factor for reduced lung function and respiratory disorders in the offspring (37). However, in the current study, the suggested association between low GWG and asthma was not attenuated when further adjusting for low birth weight and preterm birth. A low GWG may also be a consequence of an inappropriate maternal diet during pregnancy, resulting in suboptimal fetus nutrition (7,37). A role of epigenetic modifications via intrauterine mechanisms has also been suggested for both low and high maternal adiposity in a recent study (38), but results were less conclusive for GWG. Given the potentially important prevention opportunities occurring during pregnancy (8,10), the exact role of GWG in offspring asthma as well as potential mechanisms warrant further study.
Our results of a higher risk of asthma among children with a low birth weight is consistent with a recent meta-analysis showing that low, but not high birth weight, is associated with childhood wheezing disorders (39). Although a detailed assessment of the separate effects
15 of gestational duration and fetal growth was not the main purpose of the current study, we found that the association between low birth weight and asthma was attenuated when further adjusting for preterm birth. This result is also in accordance with a Swedish study (40) suggesting that, even though intrauterine growth retardation is associated with an increased risk of asthma, preterm birth may be a stronger risk factor.
Maternal diabetes and offspring asthma has been scarcely studied, and inconsistent results have been reported (positive association (41) or absence of association (12)). However, in these previous studies, no distinction between maternal diabetes before or during pregnancy was made. In the current study, when examining gestational diabetes, we did not observe any association with offspring asthma.
The interrelations between maternal BMI, GWG, birth weight and child’s BMI and asthma are complex (21). Disentangling each of these associations into causal pathways is challenging and could not be fully addressed in the current study. In particular, a higher pre-pregnancy BMI is also associated with the child’s BMI in childhood and in adolescence (10,29,42). However, in the current study, no information on weight and height was available before age 9 years, the time period when most cases of asthma onset, and for which an association with maternal pre-pregnancy BMI was observed. Thus, we could not investigate mediation by the child’s BMI. Nevertheless, studies of young children have found the relationship between maternal BMI and offspring asthma only slightly attenuated by the child’s BMI (13,16), suggesting that the association is not exclusively explained by the child’s own overweight or obesity.
This study had several potential limitations. First, it was not specifically designed to study asthma or allergies, and our analyses were based only on a question on self (or mother’s)
16 report of physician-diagnosed diseases in generic questionnaires. However, 88% of child’s reported asthma diagnoses were confirmed by their nurse mothers. Although children’s and mothers’ reports of allergy were less consistent, our results were systematically confirmed when using more stringent definitions for asthma as well as for allergy. Second, the possibility of unmeasured or residual confounding cannot be ruled out, especially when studying risk factors strongly related to lifestyle and socioeconomic characteristics. Although no data was available regarding maternal smoking during pregnancy, we adjusted for maternal smoking during child’s early life. In addition, mothers reflected a relatively homogenous population (registered nurses) in terms of education and socioeconomic status, and we controlled for other sources of socioeconomic disparities (husband’s education, household income). Finally, although GUTS design is prospective, maternal risk factors as well as outcomes were assessed retrospectively. In particular, pre-pregnancy weight and GWG were collected 12-17 years after pregnancy. Recall of GWG was not specifically assessed in NHSII nurses but a moderate agreement between recalled and documented GWG was suggested in another study (43). However, validity may be higher among NHSII nurses; indeed, a high validity of recalled weight, pre-pregnancy weight, and other pregnancy-related events up to 30 years later, has been demonstrated in NHSII participants (44,45). A possible misclassification bias may still have driven some associations towards the null and limited power to detect modest associations. However, it is unlikely that our results are affected by a differential misclassification bias (which would lead to spurious associations) since our main analyses use an asthma definition based on the child’s report only, while exposures were based on mother’s reports in separate questionnaires.
In summary, we observed relationships of three prenatal or perinatal factors (maternal BMI, GWG, birth weight) with a higher risk of childhood asthma, supporting the early origins
17 hypothesis for asthma. The observed allergy- and sex-specific patterns in the relationship between a high maternal BMI and childhood asthma suggest an impact on respiratory health through multiple etiologic pathways. Clarification of these issues is required for the design and implementation of primary prevention programs for asthma.
18
Acknowledgements
We would like to thank the participants and staff of the Growing Up Today Study and the Nurses’ Health Study II for their valuable contributions.
Funding source
National Institutes of Health R01 HL84401, UM1 CA176726
Conflict of interest: The authors have no potential conflicts of interest to disclose
Author contributions:
OD contributed in the study conception, statistical programming and data analysis, data interpretation and primary manuscript preparation. RV contributed in the study conception, assistance with statistical programming and data analysis, data interpretation and critical revision of the manuscript. AEF and MWG participated in the acquisition of the data, data interpretation and critical revision of the manuscript. CAC participated in the study conception, acquisition of the data, data interpretation and critical revision of the manuscript. All authors approved the final version of the manuscript.
19
REFERENCES
1. Asher M, Montefort S, Bjorksten B, Lai C, Strachan D, Weiland S et al. Worldwide time trends in the prevalence of symptoms of asthma, allergic rhinoconjunctivitis, and eczema in childhood. Lancet 2006;368:733–743.
2. Akinbami LJ, Moorman JE, Bailey C, Zahran HS, King M, Johnson CA et al. Trends in asthma prevalence, health care use, and mortality in the United States, 2001-2010. NCHS
Data Brief 2012;94:1–8.
3. Haugen AC, Schug TT, Collman G, Heindel JJ. Evolution of DOHaD: the impact of environmental health sciences. J Dev Orig Heal Dis 2015;6:55–64.
4. Prescott SL. Early-life environmental determinants of allergic diseases and the wider pandemic of inflammatory noncommunicable diseases. J Allergy Clin Immunol 2013;131:23–30.
5. Bousquet J, Anto JM, Berkouk K, Gergen P, Pinto Antunes J, Auge P et al. Developmental determinants in non-communicable chronic diseases and ageing. Thorax 2015;70:595–597.
6. Martinez FD. The origins of asthma and chronic obstructive pulmonary disease in early life. Proc Am Thorac Soc 2009;6:272–277.
7. Duijts L. Fetal and infant origins of asthma. Eur J Epidemiol 2012;27:5–14.
8. Camargo C a. Gestational weight gain and offspring asthma: A novel opportunity for primary prevention research. Clin Exp Allergy 2015;45:544–546.
9. Bisgaard H, Jensen SM, Bønnelykke K. Interaction between asthma and lung function growth in early life. Am J Respir Crit Care Med 2012;185:1183–1189.
10. Gillman MW, Ludwig D. How early should obesity prevention start? N Engl J Med 2013;369:2173–2175.
11. Forno E, Young OM, Kumar R, Simhan H, Celedón JC. Maternal Obesity in Pregnancy, Gestational Weight Gain, and Risk of Childhood Asthma. Pediatrics 2014;134:e535– e546.
12. Zugna D, Galassi C, Annesi-Maesano I, Baiz N, Barros H, Basterrechea M et al. Maternal complications in pregnancy and wheezing in early childhood: A pooled analysis of 14 birth cohorts. Int J Dermatol 2015;44:199–208.
13. Leermakers ETM, Sonnenschein-van der Voort AMM, Gaillard R, Hofman A, de Jongste JC, Jaddoe VW V et al. Maternal weight, gestational weight gain and preschool wheezing: the Generation R Study. Eur Respir J 2013;42:1234–1243.
14. Pike KC, Inskip HM, Robinson SM, Cooper C, Godfrey KM, Roberts G et al. The relationship between maternal adiposity and infant weight gain, and childhood wheeze and atopy. Thorax 2013;68:372–379.
20 15. Harpsøe MC, Basit S, Bager P, Wohlfahrt J, Benn CS, Nøhr E a. et al. Maternal obesity, gestational weight gain, and risk of asthma and atopic disease in offspring: A study within the Danish National Birth Cohort. J Allergy Clin Immunol 2013;131:1033–1040.
16. Scholtens S, Wijga AH, Brunekreef B, Kerkhof M, Postma DS, Oldenwening M et al. Maternal overweight before pregnancy and asthma in offspring followed for 8 years. Int J
Obes 2010;34:606–613.
17. Patel S, Rodriquez A, Little M, Elliott P, Pekkanen J, Hartikainen A-L et al. Associations between pre-pregnancy obesity and asthma symptoms in adolescents. J Epidemiol
Community Heal 2012;66:809–814.
18. Ekström S, Magnusson J, Kull I, Lind T, Almqvist C, Melén E et al. Maternal BMI in early pregnancy and offspring asthma, rhinitis and eczema up to 16 years of age. Clin Exp
Allergy 2014;:283–291.
19. Kumar R, Story RE, Pongracic JA, Hong X, Arguelles L, Wang G et al. Maternal Pre-Pregnancy Obesity and Recurrent Wheezing in Early Childhood. Pediatr Allergy Immunol
Pulmonol 2010;23:183–190.
20. Halonen M, Lohman IC, Stern DA, Ellis WL, Rothers J, Wright AL. Perinatal tumor necrosis factor-α production, influenced by maternal pregnancy weight gain, predicts childhood asthma. Am J Respir Crit Care Med 2013;188:35–41.
21. Frey U, Latzin P, Usemann J, Maccora J, Zumsteg U, Kriemler S. Asthma and obesity in children: current evidence and potential systems biology approaches. Allergy 2015;70:26– 40.
22. Stream AR, Sutherland ER. Obesity and asthma disease phenotypes. Curr Opin Allergy
Clin Immunol 2012;12:76–81.
23. Han YY, Forno E, Celedón JC. Adiposity, fractional exhaled nitric oxide, and asthma in U.S. Children. Am J Respir Crit Care Med 2014;190:32–39.
24. Jensen-Jarolim E, Untersmayr E. Gender-medicine aspects in allergology. Allergy 2008;63:610–615.
25. Almqvist C, Worm M, Leynaert B. Impact of gender on asthma in childhood and adolescence: a GA2LEN review. Allergy 2008;63:47–57.
26. Chen YC, Dong GH, Lin KC, Lee YL. Gender difference of childhood overweight and obesity in predicting the risk of incident asthma: a systematic review and meta-analysis.
Obes Rev 2013;14:222–231.
27. Lowe AJ, Ekeus C, Bråbäck L, Rajaleid K, Forsberg B, Hjern A. Impact of Maternal Obesity on Inhaled Corticosteroid Use in Childhood: A Registry Based Analysis of First Born Children and a Sibling Pair Analysis. PLoS One 2013;8:1–7.
28. Gillman MW, Rifas-Shiman SL, Camargo CAJ, Berkey CS, Frazier a L, Rockett HR et al. Risk of overweight among adolescents who were breastfed as infants. JAMA 2001;285:2461–2467.
21 29. Oken E, Rifas-Shiman SL, Field AE, Frazier AL, Gillman MW. Maternal gestational
weight gain and offspring weight in adolescence. Obstet Gynecol 2008;112:999–1006. 30. Pekkanen J, Lampi J, Genuneit J, Hartikainen AL, Jarvelin MR. Analyzing atopic and
non-atopic asthma. Eur J Epidemiol 2012;27:281–286.
31. Wenzel SE. Asthma phenotypes: the evolution from clinical to molecular approaches. Nat
Med 2012;18:716–725.
32. Hancox RJ, Milne BJ, Poulton R, Taylor DR, Greene JM, McLachlan CR et al. Sex differences in the relation between body mass index and asthma and atopy in a birth cohort. Am J Respir Crit Care Med 2005;171:440–445.
33. Siroux V, Curt F, Oryszczyn MP, Maccario J, Kauffmann F. Role of gender and hormone-related events on IgE, atopy, and eosinophils in the Epidemiological Study on the Genetics and Environment of Asthma, bronchial hyperresponsiveness and atopy. J Allergy
Clin Immunol 2004;114:491–498.
34. Wijga A, Tabak C, Postma DS, Kerkhof M, Wieringa MH, Hoekstra MO et al. Sex differences in asthma during the first 8 years of life: The Prevention and Incidence of Asthma and Mite Allergy (PIAMA) birth cohort study. J Allergy Clin Immunol 2011;127:275–277.
35. Genuneit J. Sex-Specific Development of Asthma Differs between Farm and Nonfarm Children: A cohort Study. Am J Respir Crit Care Med 2014;190:588–590.
36. Kramer MS. The epidemiology of adverse pregnancy outcomes: an overview. J Nutr 2003;133:1592S – 1596S.
37. Stocks J, Hislop A, Sonnappa S. Early lung development: Lifelong effect on respiratory health and disease. Lancet Respir Med 2013;1:728–742.
38. Sharp GC, Lawlor DA, Richmond RC, Fraser A, Simpkin A, Suderman M et al. Maternal pre-pregnancy BMI and gestational weight gain, offspring DNA methylation and later offspring adiposity: findings from the Avon Longitudinal Study of Parents and Children.
Int J Epidemiol 2015;44:1288–1304.
39. Mebrahtu TF, Feltbower RG, Greenwood DC, Parslow RC. Birth weight and childhood wheezing disorders: a systematic review and meta-analysis. J Epidemiol Community Heal 2015;69:500–508.
40. Källén B, Finnstrom O, Nygren KG, Olausson PO. Association between preterm birth and intrauterine growth retardation and child asthma. Eur Respir J 2013;41:671–676.
41. Rusconi F, Galassi C, Forastiere F, Bellasio M, De Sario M, Ciccone G et al. Maternal complications and procedures in pregnancy and at birth and wheezing phenotypes in children. Am J Respir Crit Care Med 2007;175:16–21.
42. Ziyab AH, Karmaus W, Kurukulaaratchy RJ, Zhang H, Arshad SH. Developmental trajectories of Body Mass Index from infancy to 18 years of age: prenatal determinants and health consequences. J Epidemiol Community Heal 2014;68:934–941.
22 43. McClure CK, Bodnar LM, Ness R, Catov JM. Accuracy of maternal recall of gestational
weight gain 4 to 12 years after delivery. Obesity (Silver Spring) 2011;19:1047–1053. 44. Troy LM, Hunter DJ, Manson JE, Colditz GA, Stampfer MJ, Willett WC. The validity of
recalled weight among younger women. Int J Obes Relat Metab Disord 1995;19:570–572. 45. Tomeo CA, Rich-Edwards JW, Michels KB, Berkey CS, Hunter DJ, Frazier AL et al. Reproducibility and validity of maternal recall of pregnancy-related events. Epidemiology 1999;10:774–777.
23 Table 1. Maternal and child’s characteristics according to the child’s asthma status, among 12,963 mother-child pairs in the Growing Up Today Study
All (n=12,963)
Child with physician-diagnosed asthma No (n=10,269) Yes (n=2,694) P Maternal characteristics Pre-pregnancy BMI, kg/m2, % < 20.0 24.4 24.3 24.5 <0.001 20.0-22.4 41.2 41.7 38.9 22.5-24.9 19.7 19.9 19.2 25-29.9 11.0 10.6 12.6 ≥30 3.7 3.5 4.8 GWG, lb, % <15 2.8 2.6 3.7 0.005 15-24 20.6 20.6 20.7 25-34 40.8 41.3 38.6 35-44 22.2 22.1 22.5 ≥45 13.6 13.4 14.5 Gestational diabetes, % 3.0 2.9 3.5 0.13 C-section, % Yes 19.3 18.7 21.6 0.003 Missing 6.6 6.6 6.6
Age at delivery, mean (SD) 29.4 (3.5) 29.5 (3.5) 29.4 (3.5) 0.25
White, % 97.5 97.7 97.0 0.04
Hispanic, % 1.7 1.6 2.0 0.10
Maternal asthma, % 17.8 14.9 29.1 <0.001
Smoking in child’s early life†, %
Never 70.2 70.7 68.3 0.02
Past 21.2 20.6 23.2
Current 8.6 8.7 8.5
US region in child’s early life†, %
West 14.3 13.6 17.1 <0.001
Midwest 35.3 36.2 31.8
South 13.8 14.0 13.3
Northeast 36.6 36.2 37.8
Breast feeding duration, %
Never 9.4 9.5 8.8 0.69 <3 months 20.0 19.8 20.8 4-6 months 20.4 20.5 20.0 ≥7 months 47.0 47.0 47.2 Missing 3.2 3.2 3.2 Household income ≤ $44,500 10.5 10.8 9.3 0.04 > $44,500 71.7 71.3 73.4 Missing 17.8 18.0 17.3 Husband education
High school or less 16.5 16.5 16.5 0.87
College graduate 46.1 46.3 45.5
Graduate degree 30.3 30.2 30.8
24 Table 1. Maternal and child’s characteristics according to the child’s asthma status, among 12,963 mother-child pairs in the Growing Up Today Study
All (n=12,963)
Child with physician-diagnosed asthma No (n=10,269) Yes (n=2,694) P Child’s characteristics Female, % 53.8 54.5 51.2 0.002 Birth weight, lb, (n=12,788), % <5.5 3.5 3.2 4.4 0.05 5.5-6.9 19.7 19.8 19.2 7.0-8.4 52.6 52.6 52.2 8.5-9.9 22.1 22.0 22.3 ≥10 2.2 2.2 1.9 Birth order 1 44.0 43.6 45.5 0.001 2 33.9 33.7 34.8 3+ 15.5 16.1 13.1 Missing 6.6 6.6 6.6
Asthma confirmed by mother, % - - 87.9 -
Allergies* reported by mother or offspring, % 47.7 39.4 79.4 <0.001 Allergies* reported by mother and offspring, % 17.3 8.2 60.8 <0.001
Age at asthma onset (n=2,561), mean (SD) - - 6.6 (4.6) -
BMI – Body Mass Index; GWG – Gestational Weight Gain
* Ever had hay fever, seasonal allergies or allergic rhinitis, assessed by mother's report during the child's adolescence or by the offspring in early adulthood. † (age 2-7 years).
25 Table 2. Associations of prenatal and perinatal exposures with incidence of allergic and non-allergic asthma in childhood
Child with physician-diagnosed asthma
All asthma Non-allergic asthma Allergic asthma
No of cases OR (95% CI) No of cases OR (95% CI) No of cases OR (95% CI) Maternal pre-pregnancy BMI, kg/m2 < 20.0 661 1.05 (0.94-1.18) 124 1.04 (0.83-1.32) 537 1.05 (0.93-1.19) 20.0-22.4 1,049 1 204 1 845 1 22.5-24.9 517 1.01 (0.89-1.14) 128 1.29 (1.03-1.62) 389 0.93 (0.82-1.07) 25-29.9 339 1.19 (1.03-1.38) 71 1.35 (1.02-1.79) 268 1.15 (0.98-1.35) ≥30 128 1.34 (1.08-1.68) 28 1.60 (1.06-2.41) 100 1.28 (1.00-1.64) p trend 0.04 0.006 0.30 Maternal GWG (lb)* <15 99 1.28 (0.98-1.66) 22 1.47 (0.91-2.36) 77 1.24 (0.93-1.64) 15-24 558 1.07 (0.95-1.20) 110 1.03 (0.81-1.31) 448 1.07 (0.94-1.22) 25-34 1,041 1 210 1 831 1 35-44 606 1.04 (0.93-1.17) 130 1.12 (0.89-1.40) 476 1.02 (0.90-1.16) ≥45 390 1.05 (0.92-1.21) 83 1.16 (0.89-1.51) 307 1.03 (0.88-1.20) p trend 0.55 0.68 0.41 Gestational diabetes* No 2,573 1 537 1 2,036 1 Yes 92 1.12 (0.88-1.43) 12 0.73 (0.40-1.32) 80 1.22 (0.94-1.58) Birth weight (lb)* <5.5 116 1.25 (0.99-1.57) 32 1.72 (1.16-2.57) 84 1.14 (0.88-1.47) 5.5-6.9 510 0.96 (0.85-1.08) 98 0.89 (0.70-1.13) 412 0.98 (0.86-1.12) 7.0-8.4 1,386 1 295 1 1,091 1 8.5-9.9 593 1.05 (0.94-1.17) 108 0.86 (0.69-1.09) 485 1.10 (0.98-1.24) ≥10 51 0.83 (0.61-1.14) 11 0.82 (0.44-1.54) 40 0.84 (0.59-1.19) p trend 0.72 0.08 0.68
BMI – Body Mass Index; GWG – Gestational Weight Gain; OR – Odds Ratio; CI – Confidence Interval
Analyses were adjusted for maternal age at delivery, asthma, race, ethnicity, smoking in child’s early life, household income, husband’s education, US region in child’s early life, mode of delivery (C-section), child’s birth order, and breast feeding duration. *Analyses were further adjusted for maternal pre-pregnancy BMI.
26 0
Table 3. Associations of prenatal and perinatal exposures with incident asthma in childhood, according to age at asthma onset (n=12,830) Child with physician-diagnosed asthma
Age 0-5.9 years Age 6-11.9 years Age 12-17.9 years
No of cases OR (95% CI) No of cases OR (95% CI) No of cases OR (95% CI) Maternal pre-pregnancy BMI, kg/m2 < 20.0 299 1.13 (0.97-1.33) 225 1.07 (0.90-1.28) 112 0.95 (0.74-1.21) 20.0-22.4 438 1 357 1 197 1 22.5-24.9 235 1.09 (0.92-1.29) 160 0.91 (0.75-1.11) 90 0.96 (0.74-1.25) 25-29.9 150 1.21 (0.99-1.49) 123 1.28 (1.03-1.60) 53 1.04 (0.76-1.44) ≥30 59 1.46 (1.08-1.98) 41 1.27 (0.89-1.81) 22 1.36 (0.85-2.17) p trend 0.15 0.30 0.32 Maternal GWG (lb)* <15 44 1.31 (0.90-1.89) 36 1.49 (1.02-2.18) 16 1.17 (0.68-2.03) 15-24 259 1.17 (0.99-1.38) 182 1.06 (0.87-1.28) 92 0.94 (0.73-1.22) 25-34 442 1 344 1 194 1 35-44 260 1.07 (0.91-1.26) 222 1.15 (0.96-1.38) 97 0.90 (0.70-1.15) ≥45 176 1.10 (0.91-1.34) 122 1.01 (0.81-1.26) 75 1.12 (0.85-1.48) p trend 0.50 0.67 0.74 Gestational diabetes* No 1132 1 857 1 456 1 Yes 37 1.01 (0.70-1.44) 38 1.39 (0.98-1.97) 13 0.92 (0.52-1.65) Birth weight (lb)* <5.5 62 1.57 (1.17-2.11) 36 1.16 (0.80-1.68) 11 0.71 (0.38-1.34) 5.5-6.9 242 1.06 (0.90-1.24) 148 0.82 (0.68-0.99) 98 1.07 (0.84-1.37) 7.0-8.4 600 1 478 1 239 1 8.5-9.9 242 0.97 (0.83-1.14) 212 1.09 (0.92-1.29) 111 1.14 (0.90-1.44) ≥10 22 0.80 (0.52-1.24) 18 0.83 (0.51-1.36) 7 0.72 (0.33-1.59) p trend 0.02 0.21 0.56
BMI – Body Mass Index; GWG – Gestational Weight Gain; OR – Odds Ratio; CI – Confidence Interval
Analyses were adjusted for maternal age at delivery, asthma, race, ethnicity, smoking in child’s early life, household income, husband’s education, US region in child’s early life, mode of delivery (C-section), child’s birth order, and breast feeding duration. *Analyses were further adjusted for maternal pre-pregnancy BMI.
27
Figure 1. Directed Acyclic Graph (DAG) presenting the relationships between the main
exposures of interests, covariates and asthma outcomes.
Maternal smoking and US region were evaluated early in the child’s life (age 2-7).
In main analyses, we hypothesized that mode of delivery (C-section), breastfeeding duration, and child’s birth order may confound the relationship of prenatal and perinatal exposures with asthma through unmeasured common causes (U); we thus adjusted for these 3 factors when studying the associations with offspring asthma. However, mode of delivery is also a possible mediator in this relationship (alternative hypothesis not represented in the DAG); models not adjusted for C-section were thus also tested in sensitivity analyses.
For simplicity, gestational diabetes was omitted from the DAG; the hypotheses posited for the relationship with the other variables were similar for gestational diabetes than for GWG.
28
Figure 2. Associations (adjusted odds ratio and 95% confidence intervals) between maternal
pre-pregnancy obesity (body mass index ≥30 kg/m2) and incidence of allergic and non-allergic asthma in childhood, according to the child’s sex. Reference category for body mass index: 20.0-22.4 kg/m2. P for interaction are displayed only if statistically significant (<0.05).
1
Supporting information
Longitudinal study of maternal body mass index, gestational weight gain, and offspring asthma
Orianne Dumas, Raphaëlle Varraso, Matthew W. Gillman, Alison E. Field, and Carlos A. Camargo Jr.
Data collection and definitions of variables Outcomes
Data available in GUTS participant’s and mother’s questionnaires on asthma and allergy and definitions used for asthma and allergy in main and sensitivity analyses are summarized in table S1. Further information on asthma was available from supplemental questionnaires sent in 2007-2008 to a sub-sample of children with asthma (with diagnosis before 1999), and to their mothers, for validation purpose. This additional information was also used in the current study to define allergy and age at asthma onset, if not available from other questionnaires.
Exposures
Maternal pre-pregnancy BMI (kg/m2) was ascertained from the NHSII 1989 questionnaire (height) and 1999 GUTS mother’s questionnaires (pre-pregnancy weight: “Thinking back about your pregnancy with [child’s name]: how much did you weight before this pregnancy”). Maternal gestational weight gain (“How much weight did you gain during this pregnancy”, lb) and gestational diabetes (“During this pregnancy, were you diagnosed with gestational diabetes?”) were ascertained from 1999 GUTS mother’s questionnaires. Birth weight
2 (“How much did this child weight at birth?”) was ascertained from 1997 GUTS mother’s questionnaires.
In the main analyses, we examined GWG by categories of 10 pound increment. The U.S. Institute of Medicine 1990 and 2009 guidelines provide different ranges of recommended weight gain for underweight (1990 and 2009: 28-40 lb), normal-weight (1990 and 2009: 25-35 lb), overweight (1990 and 2009: 15-25 lb) and obese (1990: ≥15lb; 2009: 11-20 lb) women. We thus also examined the associations of maternal GWG with incident asthma in childhood according to maternal pre-pregnancy BMI. Results are presented in table S4.
Covariates
Maternal history of asthma was defined by the self-report of physician-diagnosed asthma in at least one of the biennial NHSII questionnaire from 1989 through 2011. Maternal race, maternal ethnicity, US region and maternal smoking early in the child’s life (age 2-7) were ascertained from the NHSII baseline questionnaire (1989); mother’s husband’s education and household income were ascertained from 1999 and 2001 NHSII questionnaires respectively. Preterm birth (≤37 week pregnancy) and breast feeding duration was ascertained in 1997 GUTS mother’s questionnaires. Finally, mode of delivery (C-section), and child’s birth order were ascertained from the 2009 NHSII questionnaire.
Missing data
In multivariable models, missing values for covariates (see table 1) were included as an additional “missing” category for each covariate.
3
Additional sensitivity analyses
We also verified that studying associations between prenatal and perinatal exposures and asthma separately among allergic or non-allergic asthma subgroup led to similar conclusions. Results for main analyses are presented in table S7. Analyses stratified by both allergy and sex for the association between maternal obesity and incident asthma also led to similar conclusion than results presented in figure 2: in boys, an association was observed with asthma among non-allergic participants (OR: 2.73, 95% CI: 1.55-4.79) but not among non-allergic participants (OR: 0.88, 95% CI: 0.59-1.31); in girls, no association was observed with asthma among non-allergic participants (OR: 1.05, 95% CI: 0.53-2.05), and a non-significant increased risk of asthma was observed among allergic participants (OR: 1.29, 95%CI: 0.88-1.89).
4
Table S1. Definition of asthma and allergy in main and sensitivity analyses
Asthma Allergy
Data available from GUTS participants’ questionnaires
Question: “Has a doctor ever said you have asthma?” Questionnaire years: 1996, 1997, 1998, 1999
Question: “Has a doctor ever said you have hay fever (allergic rhinitis)”
Questionnaire year: 2007 Data available from mothers’
questionnaires
Question: “Has a doctor ever said that this child has asthma (reactive airway disease)?” Questionnaire years: 1997, 1999, 2004
Question: “Has a doctor ever said that this child has hay fever, seasonal allergies, or allergic rhinitis?”
Questionnaire years: 1997, 1999, 2004
Definition in main analysis Child’s report Child’s or mother’s report Definition in sensitivity
5 Table S2. Comparison of maternal and child’s characteristics of the 12,963 mother-child pairs included in the analyses with excluded mother-child pairs
Included (n=12,963) Excluded Missing value for asthma (n=437) P†
Missing value for maternal BMI or GWG (n=3,475)‡ P† Maternal characteristics Pre-pregnancy BMI, kg/m2, % < 20.0 24.4 19.9 0.30 - - 20.0-22.4 41.2 41.6 - 22.5-24.9 19.7 20.5 - 25-29.9 11.0 13.3 - ≥30 3.7 4.7 - GWG, lb, % <15 2.8 2.8 0.45 - - 15-24 20.6 20.6 - 25-34 40.8 44.7 - 35-44 22.2 21.6 - ≥45 13.6 10.3 - Gestational diabetes, % 3.0 3.4 0.68 - C-section, % 20.6 24.2 0.09 19.1 0.09
Age at delivery, mean (SD) 29.4 (3.5) 29.3 (3.4) 0.37 29.1 (3.5) <0.001
White, % 97.5 96.6 0.22 97.0 0.08
Hispanic, % 1.7 1.6 0.90 1.2 0.06
Maternal asthma, % 17.8 20.1 0.22 20.3 0.001
Smoking in child’s early life, %
Never 70.2 65.0 0.05 66.7 <0.001
Past 21.2 25.9 23.0
Current 8.6 9.1 10.3
US region in child’s early life, %
West 14.3 14.4 0.17 12.1 0.01
Midwest 35.3 39.4 35.9
South 13.8 10.7 13.9
Northeast 36.6 35.5 38.1
Breast feeding duration, %
Never 9.7 6.8 0.14 13.1 <0.001 <3 months 20.7 22.6 21.0 4-6 months 21.0 23.5 21.7 ≥7 months 48.6 47.1 44.2 Household income > $44,500, % 87.3 84.6 0.15 85.1 0.007 Husband education
High school or less 17.8 17.2 0.51 18.1 0.002
College graduate 49.6 52.5 52.6
Graduate degree 32.6 30.3 29.3
Child’s characteristics
6 Table S2. Comparison of maternal and child’s characteristics of the 12,963 mother-child pairs included in the analyses with excluded mother-child pairs
Included (n=12,963) Excluded Missing value for asthma (n=437) P†
Missing value for maternal BMI or GWG (n=3,475)‡ P† Birth weight, lb, % <5.5 3.4 2.6 0.31 3.4 0.16 5.5-6.9 19.7 18.0 21.1 7.0-8.4 52.6 52.2 51.0 8.5-9.9 22.1 25.7 21.8 ≥10 2.2 1.5 2.7 Birth order 1 47.1 44.5 0.58 40.4 <0.001 2 36.3 38.5 39.0 3+ 16.6 17.0 20.6
Asthma reported by offspring, % 20.8 - - 19.2 0.04
Allergies* reported by mother or
offspring, % 47.7 47.8 0.98 - -
BMI – Body Mass Index; GWG – Gestational Weight Gain
* Ever had hay fever, seasonal allergies or allergic rhinitis, assessed by mother's report during the child's adolescence or by the offspring in early adulthood.† Compared to included participants
7 Table S3. Associations between prenatal and perinatal exposures of interest, among 12,963 mother-child pairs in the Growing Up Today Study
Pre-pregnancy BMI, kg/m2, % < 20.0 20.0-22.4 22.5-24.9 25-29.9 ≥30 P
n 3,160 5,334 2,555 1,430 484
GWG, lb, mean (SD) 30.6 (10.1) 31.7 (10.2) 32.3 (10.9) 30.6 (11.1) 26.5 (13.5) <0.001 Birth weight, lb, mean (SD) 7.5 (1.1) 7.7 (1.2) 7.8 (1.2) 7.9 (1.3) 7.9 (1.4) <0.001
Birth weight <5.5 lb, % 3.6 3.4 3.2 3.4 5.2 0.24
Gestational diabetes, % 2.7 2.6 2.8 4.1 7.2 <0.001
GWG, lb <15 15-24 25-34 35-44 ≥45 P
n 365 2,676 5,285 2,875 1,762
Birth weight, lb, mean (SD) 7.2 (1.5) 7.4 (1.2) 7.7 (1.1) 7.9 (1.1) 8.0 (1.3) <0.001
Birth weight <5.5 lb, % 11.1 5.0 2.8 2.1 3.6 <0.001
Gestational diabetes, % 5.8 3.1 2.8 2.7 3.4 0.02
BMI – Body Mass Index; GWG – Gestational Weight Gain; SD – Standard Deviation; p for overall comparison across BMI or GWG categories (anova or Chi-2 tests).
8 Table S4. Associations of maternal GWG with incident asthma in childhood, according maternal pre-pregnancy BMI
Maternal pre-pregnancy BMI, kg/m2
< 25 (n=11,049) 25.0-29.9 (n=1,430) ≥30 (n=484)
No of cases OR (95% CI) No of cases OR (95% CI) No of cases OR (95% CI) Maternal GWG (lb) <15 41 1.22 (0.84-1.77) 22 1.14 (0.66-1.97) 36 1.27 (0.70-2.32) 15-24 449 1.06 (0.93-1.20) 80 1.17 (0.84-1.63) 29 0.94 (0.49-1.81) 25-34 883 1 128 1 30 1 35-44 519 1.08 (0.96-1.23) 69 0.76 (0.54-1.07) 18 1.05 (0.47-2.34) ≥45 335 1.12 (0.97-1.30) 40 0.73 (0.48-1.11) 15 0.63 (0.29-1.35)
BMI – Body Mass Index; GWG – Gestational Weight Gain; OR – Odds Ratio; CI – Confidence Interval
Analyses were adjusted for maternal age at delivery, asthma, race, ethnicity, smoking in child’s early life, household income, husband’s education, US region in child’s early life, mode of delivery (C-section), child’s birth order, and breast feeding duration.
9 Table S5. Associations of prenatal and perinatal exposures with incidence of allergic versus non-allergic asthma in childhood, using a more stringent definition of asthma
Child with physician-diagnosed asthma, with mother’s confirmation of child’s asthma diagnosis
All asthma Non-allergic asthma Allergic asthma
No of cases OR (95% CI) No of cases OR (95% CI) No of cases OR (95% CI) Maternal pre-pregnancy BMI, kg/m2 < 20.0 594 1.08 (0.96 - 1.22) 99 1.11 (0.86 - 1.44) 495 1.08 (0.95 - 1.22) 20.0-22.4 916 1 154 1 762 1 22.5-24.9 444 0.99 (0.87 - 1.12) 93 1.24 (0.95 - 1.62) 351 0.94 (0.81 - 1.08) 25-29.9 302 1.21 (1.04 - 1.41) 56 1.41 (1.03 - 1.94) 246 1.16 (0.99 - 1.37) ≥30 113 1.37 (1.08 - 1.72) 24 1.83 (1.17 - 2.85) 89 1.28 (0.99 - 1.65) p trend 0.09 0.02 0.42 Maternal GWG (lb)* <15 90 1.32 (1.01 - 1.73) 19 1.60 (0.95 - 2.68) 71 1.27 (0.95 - 1.70) 15-24 491 1.06 (0.94 - 1.20) 87 1.05 (0.80 - 1.37) 404 1.06 (0.93 - 1.21) 25-34 921 1 163 1 758 1 35-44 529 1.03 (0.91 - 1.16) 94 1.05 (0.81 - 1.36) 435 1.03 (0.90 - 1.17) ≥45 338 1.03 (0.89 - 1.19) 63 1.15 (0.85 - 1.56) 275 1.01 (0.86 - 1.19) p trend 0.36 0.91 0.37 Gestational diabetes* No 2,263 1 413 1 1,850 1 Yes 82 1.14 (0.88 - 1.46) 10 0.80 (0.42 - 1.53) 72 1.20 (0.92 - 1.57) Birth weight (lb)* <5.5 110 1.37 (1.09 - 1.74) 29 2.17 (1.43 - 3.31) 81 1.22 (0.94 - 1.58) 5.5-6.9 450 0.96 (0.85 - 1.09) 77 0.93 (0.71 - 1.22) 373 0.98 (0.86 - 1.11) 7.0-8.4 1,220 1 225 1 995 1 8.5-9.9 514 1.03 (0.92 - 1.16) 79 0.82 (0.63 - 1.06) 435 1.08 (0.96 - 1.23) ≥10 43 0.78 (0.56 - 1.09) 8 0.75 (0.36 - 1.57) 35 0.80 (0.56 - 1.15) p trend 0.26 0.007 0.94
BMI – Body Mass Index; GWG – Gestational Weight Gain; OR – Odds Ratio; CI – Confidence Interval
Analyses were adjusted for maternal age at delivery, asthma, race, ethnicity, smoking in child’s early life, household income, husband’s education, US region in child’s early life, mode of delivery (C-section), child’s birth order, and breast feeding duration. *Analyses were further adjusted for maternal pre-pregnancy BMI.
10 Table S6. Associations of prenatal and perinatal exposures with incidence of allergic asthma in childhood, using a more stringent definition of allergies
Asthma with allergies (mother and offspring report)
No of cases OR (95% CI)
Maternal pre-pregnancy BMI, kg/m2
< 20.0 220 1.11 (0.93-1.33) 20.0-22.4 333 1 22.5-24.9 163 1.01 (0.83-1.24) 25-29.9 103 1.16 (0.91-1.47) ≥30 40 1.36 (0.94-1.98) p trend 0.47 Maternal GWG (lb)† <15 22 0.87 (0.55-1.38) 15-24 179 1.05 (0.87-1.27) 25-34 342 1 35-44 189 0.97 (0.80-1.17) ≥45 127 1.01 (0.80-1.26) p trend 0.81 Gestational diabetes† No 821 1 Yes 30 1.09 (0.74-1.61) Birth weight (lb) † <5.5 29 1.02 (0.69-1.51) 5.5-6.9 186 1.14 (0.95-1.37) 7.0-8.4 427 1 8.5-9.9 195 1.15 (0.96-1.38) ≥10 17 0.94 (0.57-1.54) p trend 0.99
BMI – Body Mass Index; GWG – Gestational Weight Gain; OR – Odds Ratio; CI – Confidence Interval Analyses were adjusted for maternal age at delivery, asthma, race, ethnicity, smoking in child’s early life, household income, husband’s education, US region in child’s early life, mode of delivery (C-section), child’s birth order, and breast feeding duration. †Analyses were further adjusted for maternal pre-pregnancy BMI.
11 Table S7. Associations of prenatal and perinatal exposures with asthma incidence among allergic and non-allergic participants
Non-allergic participants (n=6,778) Allergic participants (n=6,183)
No of cases OR (95% CI) No of cases OR (95% CI)
Maternal pre-pregnancy BMI, kg/m2 < 20.0 124 1.11 (0.88-1.40) 537 0.96 (0.83-1.10) 20.0-22.4 204 1 845 1 22.5-24.9 128 1.38 (1.09-1.75) 389 0.83 (0.72-0.97) 25-29.9 71 1.33 (1.00-1.78) 268 1.16 (0.97-1.40) ≥30 28 1.80 (1.19-2.75) 100 1.07 (0.81-1.42) Maternal GWG (lb)* <15 22 1.58 (0.96-2.60) 77 1.15 (0.84-1.58) 15-24 110 1.03 (0.81-1.31) 448 1.08 (0.94-1.25) 25-34 210 1 831 1 35-44 130 1.10 (0.87-1.34) 476 1.06 (0.92-1.22) ≥45 83 1.17 (0.89-1.53) 307 0.99 (0.84-1.17) Gestational diabetes* No 537 1 2,036 1 Yes 12 0.80 (0.44-1.47) 80 1.10 (0.82-1.46) Birth weight (lb)* <5.5 32 1.74 (1.15-2.62) 84 1.16 (0.86-1.57) 5.5-6.9 98 0.89 (0.70-1.14) 412 0.98 (0.85-1.13) 7.0-8.4 295 1 1,091 1 8.5-9.9 108 0.88 (0.70-1.11) 485 1.09 (0.96-1.25) ≥10 11 0.85 (0.45-1.60) 40 0.81 (0.55-1.19)
BMI – Body Mass Index; GWG – Gestational Weight Gain; OR – Odds Ratio; CI – Confidence Interval
Analyses were adjusted for maternal age at delivery, asthma, race, ethnicity, smoking in child’s early life, household income, husband’s education, US region in child’s early life, mode of delivery (C-section), child’s birth order, and breast feeding duration. *Analyses were further adjusted for maternal pre-pregnancy BMI.
12 Table S8. Associations of maternal pre-pregnancy BMI with incident asthma in childhood, according to age at asthma onset and allergy
Child with physician-diagnosed asthma
Age 0-5.9 years Age 6-11.9 years Age 12-17.9 years
No of cases OR (95% CI) No of cases OR (95% CI) No of cases OR (95% CI) Non-allergic asthma Maternal pre-pregnancy BMI, kg/m2 < 20.0 41 1.06 (0.72-1.57) 44 1.24 (0.83-1.84) 31 0.81 (0.52-1.25) 20.0-22.4 68 1 61 1 65 1 22.5-24.9 44 1.30 (0.90-1.91) 33 1.13 (0.73-1.76) 39 1.29 (0.86-1.93) 25-29.9 34 1.79 (1.18-2.74) 19 1.26 (0.74-2.14) 14 0.90 (0.51-1.60) ≥30 12 1.99 (1.06-3.73) 9 1.65 (0.79-3.45) 5 1.04 (0.42-2.61) Allergic asthma Maternal pre-pregnancy BMI, kg/m2 < 20.0 258 1.15 (0.97-1.36) 181 1.04 (0.86-1.26) 81 1.01 (0.76-1.35) 20.0-22.4 370 1 296 1 132 1 22.5-24.9 191 1.05 (0.87-1.26) 127 0.87 (0.70-1.08) 51 0.80 (0.58-1.12) 25-29.9 116 1.10 (0.87-1.38) 104 1.28 (1.01-1.63) 39 1.11 (0.76-1.61) ≥30 47 1.36 (0.97-1.90) 32 1.20 (0.81-1.79) 17 1.49 (0.86-2.57)
BMI – Body Mass Index; GWG – Gestational Weight Gain; OR – Odds Ratio; CI – Confidence Interval
Analyses were adjusted for maternal age at delivery, asthma, race, ethnicity, smoking in child’s early life, household income, husband’s education, US region in child’s early life, mode of delivery (C-section), child’s birth order, and breast feeding duration. The reference category in all analyses was children without asthma.