HAL Id: hal-00299255
https://hal.archives-ouvertes.fr/hal-00299255
Submitted on 8 Sep 2005
HAL is a multi-disciplinary open access
archive for the deposit and dissemination of
sci-entific research documents, whether they are
pub-lished or not. The documents may come from
teaching and research institutions in France or
abroad, or from public or private research centers.
L’archive ouverte pluridisciplinaire HAL, est
destinée au dépôt et à la diffusion de documents
scientifiques de niveau recherche, publiés ou non,
émanant des établissements d’enseignement et de
recherche français ou étrangers, des laboratoires
publics ou privés.
Earthquake lights and rupture processes
T. V. Losseva, I. V. Nemchinov
To cite this version:
T. V. Losseva, I. V. Nemchinov. Earthquake lights and rupture processes. Natural Hazards and Earth
System Science, Copernicus Publications on behalf of the European Geosciences Union, 2005, 5 (5),
pp.649-656. �hal-00299255�
SRef-ID: 1684-9981/nhess/2005-5-649 European Geosciences Union
© 2005 Author(s). This work is licensed under a Creative Commons License.
and Earth
System Sciences
Earthquake lights and rupture processes
T. V. Losseva and I. V. Nemchinov
Institute of Geosphere’s Dynamics of the Russian Academy of Sciences, Moscow, Russia
Received: 1 July 2005 – Revised: 5 August 2005 – Accepted: 5 August 2005 – Published: 8 September 2005 Part of Special Issue “Seismic hazard evaluation, precursory phenomena and seismo electromagnetics”
Abstract. A physical model of earthquake lights is proposed. It is suggested that the magnetic diffusion from the electric and magnetic fields source region is a dominant process, ex-plaining rather high localization of the light flashes. A 3D numerical code allowing to take into account the arbitrary distribution of currents caused by ground motion, conductiv-ity in the ground and at its surface, including the existence of sea water above the epicenter or (and) near the ruptured segments of the fault have been developed. Simulations for the 1995 Kobe earthquake were conducted taking into ac-count the existence of sea water with realistic geometry of shores. The results do not contradict the eyewitness reports and scarce measurements of the electric and magnetic fields at large distances from the epicenter.
1 Introduction
Numerous eyewitness reports on the earthquake lights and even occasional photographs (Derr, 1973; Lockner et al., 1983; Enriquez, 2003) have not yet revealed the mechanisms of these fascinating events. Recently eyewitness data have been gathered after a strong (magnitude 7.2) and shallow (depth 17.2 km) Hyogo-ken Nanbu earthquake near Kobe, Japan, on 17 January 1995 (Tsukuda, 1997). Electric and magnetic fields have been measured at large distances (70– 100 km) from the epicenter (Iyemori et al., 1996; Electro-magnetic Research Group, 1997). We use this data in an attempt to build a model of earthquake light phenomena.
The epicenter was located in the Akashi strait between the Awaji Island and Honsu Island (with depth of the strait of about 100 m). The length of the rupture on the ground created after the main shock on the north-west shore of the Awaji Island above the Nojima fault was about 12 km. On the Honsu Island, were the city of Kobe is located, no obvi-ous rupture on the ground is found. The upper margin of the
Correspondence to: T. V. Losseva
faults on the Honsu Island near the strait and fault segments near Kobe are larger than 1 km and 2 km, respectively. To-tal length of the aftershock active region on both sides of the strait was about 70 km (Hashimoto et al., 1996; Katao et al., 1997). The Nojima fault does not extend continuously to-ward the Rokko fault system on the Honsu Island (Takahashi et al., 1996).
Three subevents of rupture are suggested (Umeda et al., 1996; Kikuchi and Kanamori, 1996; Song and Beroza, 2004). The first is the rupture initiation and upward prop-agation from the depth of 15–16 km, the second is the bilat-eral rupture and the third is the unilatbilat-eral propagation reach-ing the Kobe area. The characteristic horizontal and vertical sizes of the moving crack zone is less than about 3–5 km, the rupture velocity is ∼3 km/s. The horizontal and vertical displacements were about 1–2 m.
A number of light flashes were detected along the fault with the half-width of about 5–10 km (Tsukuda, 1997). In addition to lightning-type and short duration light flashes (1– 3 s) some flashes had longer duration (4–5 s and 7–10 s). The longest duration flash (more than 30 s) was seen before the first shock was felt by the eyewitnesses. The white lu-minous hemisphere appeared near the ground and gradually floated up becoming orange. The largest size of the lumi-nous volume was about 100–200 m. It is difficult to find natural analogue of such events. We only note that the aver-age velocity of expansion of this volume is several m/s and that is the typical drift velocity of ions in the electric field with strength of several kV/m. It is generally assumed that all these flashes are caused by generation of charges and cur-rents in the ground during its motion.
Several mechanisms may be proposed to explain charge formation and separation: triboelectricity (Parkhomenko and Balbachan, 1981), electrokinetic processes (Mizutani et al., 1976), opening of the tips of cracks (Molchanov and Hayakawa, 1995; Molchanov et al., 2001). Lockner et al. (1983) have drawn attention that most difficult moment in explaining the earthquake lights phenomena is the sur-vival of charges for seconds and tens of seconds in the highly
650 T. V. Losseva and I. V. Nemchinov: Earthquake lights and rupture processes
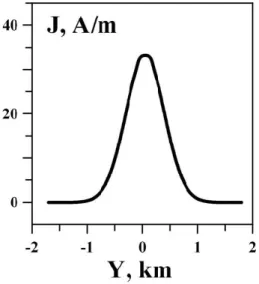
Fig. 1. Distribution of the current J versus length of the fault Y at
time t=50 ms for the H1 variant.
conducting soil. Lockner et al. (1983) suggested that retain-ment of the charge near the fault plane is caused by the evap-oration of water due to friction and heat release, and the dras-tic decrease of the electric conductivity. Analysis of kerns ex-tracted from the drill holes at Awaji Island allowed to give es-timates of the maximum temperature of about 1200◦C (Boul-lier et al., 2001). That confirms high level of heating, at least in small regions of the central part of the fault. But the melted zones do not constitute the continuos, non-interrupted barrier to charge spreading. Moreover, the most intense light flashes (lightning-like discharges) were seen above the strait with sea water having electric conductivity much higher than the typ-ical conductivity of wet rocks (Enomoto and Zheng, 1998). So we propose alternative mechanism - the skin effect, in-voking diffusion of electric currents and magnetic fields in the highly conductive medium from the current generation zone due to nonstationary magnetoelectrodynamic processes (Nemtchinov, 2002; Nemtchinov and Losseva, 2002; Los-seva and Nemtchinov, 2002). The higher is the conductivity the thinner is the skin layer.
2 Physical model and set of equations
We start with the full system of Maxwell equations:
rotH = 4πc j +1c∂D∂t , divB = 0, B = µH , rotE = −1c∂B∂t, divD = 4πρ, D = εE,
∂ρ
∂t +divj = 0, j = jσ +j0, jσ =σE.
(1)
Here t is the time, E is the electric field, B is the magnetic field, ρ is the charge density, j0 is the density of currents in the fault caused by mechanical processes, c is the speed of light, σ is the specific electric conductivity, A is the magnetic vector-potential, ϕ is the electrostatic potential:
rotA = B, divA +εµc ∂ϕ∂t =0, E = −∇ϕ −1 c ∂A ∂t. (2)
Substituting Eq. (2) into the system of Eqs. (1) we obtain εµ c2 ∂2A ∂t2 + 4π µσ c2 ∂A ∂t −1A = − 4π µσ c ∇ϕ + 4π µ c j0 εµ c2 ∂2ϕ ∂t2 −1ϕ = 4π ε ρ, ∂ρ ∂t +div (σ E) = −div j0 (3) We ignoreεµ c2 ∂2A ∂t2 and εµ c2 ∂2ϕ
∂t2 in our calculations. We assume
ε=1, µ=1. The remaining equations are diffusion-type ones (Losseva, 2003): 4π µσ c2 ∂A ∂t −1A=− 4π µσ c ∇ϕ+ 4π µ c j0, 1ϕ=− 4π ε ρ .(4)
For large times the characteristic size of the magnetic field disturbance outside the source region and the charged zone at the conductivity discontinuity is 1x=pt ×c2/σ =
√ D2t,
where D is the magnetic diffusion coefficient. For typi-cal value of σ =10−2 S/m we have D2=108 m2/s and at
t =10−1s the size of the magnetic diffusion zone 1x=3 km, and that approximately coincides with the characteristic size of the luminosity zone.
Boundary conditions at large distances from the fault are as follows:
Ax =0, Ay =0, Az=0, Ex=0, Ey =0, Ez=0 (5) System of diffusion-type equations Eq. (4) is solved using a specially developed 3D numerical code for an arbitrary ge-ometry of the fault, distribution of the conductivity σ in it and in the surrounding ground, distribution of the “mechan-ical” current j0(r, t) in space and its dependence on time
(Losseva, 2003).
3 Current generation impulses shape, duration and ge-ometry of the source zone
Function j0(r, t) is an arbitrary one. It is to be constrained
by analyzing the dynamics of the ground during the rupture process, mechanisms of charge generation, and comparing the results of simulations with observations.
For the widely used electrokinetic mechanism of current generation j0 =K∇p/σ, where p is the pressure, K is the coupling coefficient depending on the porosity, tortuosity of capillary channels in the rock massif, chemical composition of the electrolyte filling the pores, including its pH-value, temperature, and so on. We do not have these data during the earthquake.
The flow of the charged fluid through pores depends on the geometry of ruptured segment, pressure variation during rup-ture process and mode of the ruprup-ture segment propagation, dilatancy of the rock during “opening” of the fault etc. Var-ious models of rupturing during earthquake were proposed. If the wrinkle-like self-healing pulse model (Heaton, 1990; Andrews and Zion, 1997; Zion, 2001, 2003; Ben-Zion and Huang, 2002) is valid, the porosity, the hydraulic and electric conductivity increases at the leading edge of the ruptured segment and decreases at the trailing edge. Pres-sure decreases at the leading edge and increases at the trail-ing edge, so the pressure gradient is oppositely directed at
Fig. 2. Horizontal components of electric (EH, left panel) and magnetic (BH, center panel) fields and vertical component of magnetic field (BV, right panel) at the air/ground interface at time t=50 ms for the H1 variant. The boundaries of the fault are shown by white line.
these edges. Thus the charged fluid flows from those wedge-like ends of the ruptured segment to its center. In this case the electrokinetic mechanism of current generation may be dominated.
Other mechanisms of current generation are possible, e.g. triboelectricity. In this case the current flows in the direction of the slip. Several numerical simulation runs were fulfilled with various configurations of the currents:
1. The current flows horizontally only in one direction (variant H1).
2. The current flows from the two opposite edges of the ruptured segment into its center in horizontal direction (variant H2).
3. The current flows from the two opposite edges of the ruptured segment into its center in vertical direction (variant V2).
In the numerical simulations described below the fault, in which the current j0is assumed to flow, was chosen to be a rectangular prism with plane vertical and horizontal bound-aries. The upper boundary of the fault is located at the depth
Z=0 below the air-ground interface located at Z=Z1>0.
Below Z=Z1 we assume the conductivity σ =σ1, at Z>Z1
we assume σ =σ2 σ1. Value of σ2in simulations was
cho-sen to be much higher than the real, very small conductivity of the air, but it is sufficiently low to obtain very high veloc-ity of electromagnetic signals above the ground, much faster than the magnetic diffusion it the soil. In all the simulations we took Z1=800 m.
The width W of the current producing segment of the fault was assumed to be 200 m. The exact values of W and of the current density j0 has no importance, if W 1x. Only
the value of product J = j0 ×W (the total current per unit length or unit height) determines the values of magnetic and electric fields outside the source zone.
We assume that along the length of the vertical crack or along the height of the horizontal crack the current is flow-ing uniformly. The current distribution on the height (or the
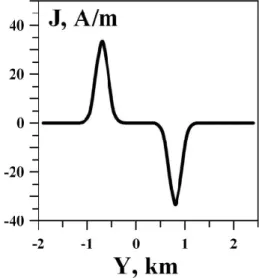
Fig. 3. Distribution of the current J versus length of the fault Y at
time t=50 ms for the H2 variant.
length) of horizontal (or vertical) rupture is rather arbitrary chosen to have Gaussian character.
The electric current j0
was assumed to rise linearly in
time. This corresponds to the initial phase of crack propaga-tion. Typical behavior of the time history of shear stress, slip and slip velocity on the fault is given by Mikumo et al. (2003). The slip-rate increases to about 3 m/s during
∼0.17 s after initiation of the slip. During this period the rupture propagates to about 500 m and this distance becomes comparable to the horizontal or vertical size of the crack. Later the rupture may stop and begin to propagate once more, if a start-stop mode is realized, e.g. due to acoustic fluidiza-tion process (Melosh, 1996). Another opfluidiza-tion is a quasista-tionary regime of propagation, in which the velocity of the magnetic diffusion front ahead of the leading rupture edge approximately coincides with the rupture velocity. Numer-ical simulations for these late phases of rupture propaga-tion are to be conducted in the future, but we suggest that
652 T. V. Losseva and I. V. Nemchinov: Earthquake lights and rupture processes
Fig. 4. Horizontal components of electric (EH, left panel) and magnetic (BH, center panel) fields and vertical component of magnetic field
(BV, right panel) at the air/ground interface at time t=50 ms for the H2 variant. The boundaries of the fault are shown by white line.
the duration of the current impulse in the start-stop process of rupture propagation or the duration of the quasistation-ary regime onset is about 0.05–0.1 s, while the total duration of rupture (and current production) is at least by two orders of magnitude larger. Thus the source zone of the currents and fields in the late phases of the earthquake process propa-gate with the rupture edge, and the total duration of luminous events is at least as long the rupture process, though current generation impulses may be rather short. Here we shall try to describe only one at these impulses, which may follow in succession.
4 Results of simulations
In the simulations described below axis Z is directed up-wards, axis Y horizontally along the fault, axis X horizon-tally perpendicular to the fault.
The distribution of the current J along the fault length Y for the case of horizontal propagation of the rupture is given in Fig. 1 (variant H1, current is flowing in one direction). Maximum value of J at time 50 ms is 33 A/m. It is assumed that the current flows in the segment with the length of 2 km and the height (h) of 3500 m. So the total peak value of “me-chanical” current I =J ×h flowing in horizontal direction is about 100 kA. We note the system of dynamical equations is linear in respect to the mechanical current j0 , and that
al-lows us to recalculate the results for arbitrary values of j0 .
The results of simulation for the variant H1 at time
t =50 ms at the air/ground interface are presented in Fig. 2. Here EH is the absolute value of horizontal component of electric field, BHand BV are the absolute values of horizon-tal and vertical components of magnetic field, respectively. The boundaries of the fault in the horizontal plane in this and next figures are shown by white lines. The boundary condi-tions were located at distances of 400 km in the all direccondi-tions. The distribution of current in variant H2 versus length at time t =50 ms is given in Fig. 3. The current flows in
oppo-site direction in two sections with the length of about 0.75 km each. The results of simulations are presented in Fig. 4 (at
t =50 ms). In both variants (H1 and H2) the electric and mag-netic fields are mainly located in the zones with characteris-tic sizes increasing in time (∼
√
t) and approximately corre-sponding to the magnetic diffusion estimate given above.
In the variant with current flowing in one direction (H1) the magnetic field is rather high, but no high residual mag-netic field have beam found (Iyemori et al., 1996). We note that in the case with the opposite currents the direction of ro-tation of the magnetic field around the current direction at the leading and trailing edges of the ruptured segments are oppo-site in sign. The magnetic diffusion zones from each of the ruptured segments are also opposite in sign. These magnetic diffusion zones from each of the source zones move along the direction of rupture propagation, and cancel one another. So the residual magnetic field would be low.
In the case of simple sliding of two walls of the fault in respect one to another, and generation of charges, e.g. due to triboelectricity, the electric current will flow in one direction, and this canceling will be absent. Thus, our model speaks in favor of wrinkle-like self-healing type of rupture propagation (Heaton, 1990). Further investigation of the electromagnetic phenomenon may give insight into the mechanical processes in the earthquakes.
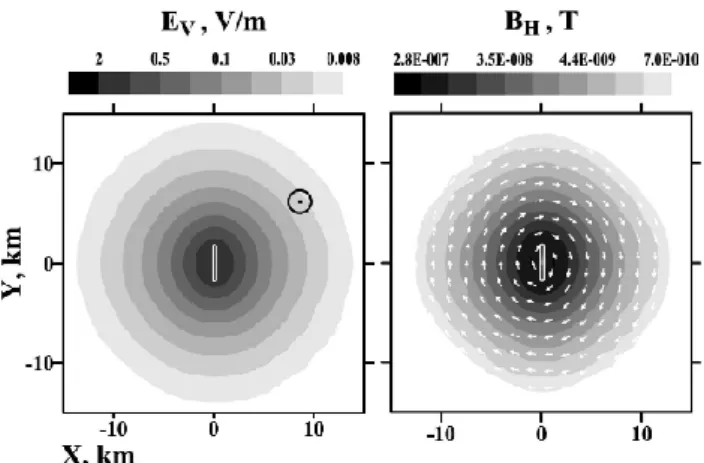
Distribution of current in the variant V2 (vertical direction of rupture propagation, currents flowing in opposite direc-tions) at time t =50 ms may be obtained from Fig. 3, substi-tuting Z for Y . The length of the active part of the fault in the horizontal direction is 3500 m.
Results of simulation for variant V2 (distribution of the absolute values of the vertical electric field EV and the hori-zontal magnetic field EH)are given in Fig. 5. Difference in maximum values of the electric and magnetic fields in vari-ants with horizontal direction of current (H1 and H2) and similar depth (Z1) and similar maximum current is explained
by difference in the active length of the rupture (compare Figs. 1 and 3).
Maximum values of the electric and magnetic fields are 8.2 V/m, 1.4 V/m, and 2.1 V/m, 2840 nT, 910 nT and 280 nT for variants H1, H2 and V2, respectively. In the region with the size of 10 km along the fault the electric field exceeds 0.08, 0.017 and 0.025 V/m in the configurations of currents H1, H2 and V2, respectively. The corresponding values of magnetic field exceed 9.5 nT, 1.7 nT and 2.2 nT, respectively. The electric and magnetic field values obtained in our simula-tions do not contradict those measured at distances of 70 km and 100 km from the epicenter, i.e. 10−5V/m and 0.6 nT, re-spectively (Electromagnetic Research Group, 1997; Iyemori et al., 1996).
5 Role of the sea water
Some other numerical runs have been made. We know, that the epicenter of the Kobe earthquake is located under the strait, so the ground in some place is covered by high con-ductivity sea water, e.g. by a “lid”, which reduces magnetic diffusion. We conducted all variants additionally assuming that some part of the ground is covered by sea water with the conductivity of 3 S/m and the constant depth of 100 m. These variants are denoted by SH1, SH2 and SV2. The contours of the land, sea and the strait were taken from the Japan’s map, and they are shown in Figs. 6–8. The epicenter is marked by a star. The directions of the active part of the fault are shown by white line. Comparing Figs. 2 and 6, Figs. 4 and 7, Figs. 5 and 8 one can see that the shape of the zone of electric and magnetic disturbances may drastically change, though gen-eral character remains the same. Maximum values of elec-tric field in variants SH1, SH2 and SV2 at time t =50 ms are 0.81 V/m, 0.23 V/m and 0.18 V/m, respectively. These values substantially differ from those in the variants without the sea water (we note that the current j0 was the same
as in variants H1, H2, V2). Maximum magnetic fields are: 290 nT, 120 nT and 44 nT. The average electric and magnetic fields in the region with the size of 10 km for variant SH1, SH2 and SV2 are as follows: 1.6×10⁻³V/m, 10−3V/m and 4×10⁻³V/m, 0.8 nT, 0.1 nT and 10−2nT.
6 Discussion
Comparing data of variants H1, H2, V2 and SH1, SH2 and SH3 we see that the electric and magnetic fields above the sea/air boundary, at least for t =50 ms, are substantially lower than above the ground/air boundary, when the existence of sea-water was not taken into account. That is probably ex-plained by the fact that the magnetic fields need more time to leak throughout the rather thin, but highly conductive layer of the sea water. We need to investigate the effect of the sea water for larger durations of the current generation im-pulses. That has not been done here, as 3D simulations for large times of simulation are consuming very large computer resources. We have intentions to fulfill such simulations in the future.
Fig. 5. Vertical components of electric field (EV, left panel) and
horizontal component of magnetic field (BH, right panel) at the
air/ground interface at time t=50 ms for the V2 variant. The bound-aries of the fault are shown by white line.
Let us note that in the case of horizontal propagation of the current generation rupture segment the largest compo-nents of the electric field are horizontal and that may change the thresholds of corona discharges, arching and lightning discharges onset in comparison to the more usual case when vertical fields dominate.
Let us mention the possible role of the weather conditions. During Kobe earthquake it was cloudy and raining in some places, the altitude of the clouds was only about 200 m. Win-ter thunderstorms are rather frequent in Japan and typical al-titude of the clouds is about 200–500 m (Kito et al., 1985; MacGorman and Rust, 1998). A large number of intracloud and cloud-to-ground discharges (500–100 per hour) were ob-served on 9–10 January, a week before the earthquake (Na-gao and Uyeda, 2001). But on 15 January, the thunderstorm lightnings were not reported. We can not exclude some elec-trification of the nonthunderstorm clouds before the earth-quake, but typically electric field strengths inside such clouds do not exceed 10–20 kV/m, and are insufficient for initia-tion of lightnings (MacGorman and Rust, 1998). The clouds may be electrificated due to the underground and underwa-ter sources during the earthquake. That effect should be the goal of future investigations. In all the places short duration flashes were observed, there was no rain, and the atmospheric electric currents associated with precipitation were not in-tense. Nevertheless, it is clear that we should additionally investigate role of the weather conditions on the threshold of corona discharges, arching, lightning initiations, and EM impulse propagation, to compare the observations and simu-lations.
7 Conclusions
A new physical model explaining localization of electric fields and light flashes near the fault have been proposed. A 3D numerical code allowing to calculate the evolution of
654 T. V. Losseva and I. V. Nemchinov: Earthquake lights and rupture processes
Fig. 6. Same results as in Fig. 2, but accounting the sea water layer with the depth of 100 m and real coastline (dark gray lines) near Akashi
strait (variant SH1). The epicenter is marked by a star. The directions of the active part of the fault are shown by white line.
Fig. 7. Same results as in Fig. 4, but accounting the sea water layer with the depth of 100 m and real coastline (dark gray lines) near Akashi
strait (variant SH2). The epicenter is marked by a star. The directions of the active part of the fault are shown by white line.
Fig. 8. Same results as in Fig. 5, but accounting the sea water layer with the depth of 100 m and real coastline (dark gray lines) near Akashi
electric and magnetic fields in an arbitrary geometry of the fault, conductivity in the ground and at its surface, including the existence of sea water above the epicentre and near the ruptured segment of the fault has been developed. The re-sults of simulations do not contradict the eyewitness reports and scarce measurements of the electric and magnetic fields at large distances from the epicentre.
The earthquake lights investigations, including numerical simulations using the proposed physical model and described mathematical code should be continued and refined. Other mechanisms of current and field generation, in addition to the already mentioned, should be analysed, e.g. motion of the highly conductive salted water in the geomagnetic field due to the underbottom earthquake (Ismaguilov et al., 2001). We have mentioned other directions of future theoretical re-search. But first of all to prove or reject any of the models one should try to organize instrumental measurements of the EM effects and their manifestations, including the luminosity effects.
Acknowledgements. This work was supported by the Russian
Foundation for Basic Research (project No. 04-05-64752). Edited by: P. F. Biagi
Reviewed by: O. Molchanov and another referee
References
Andrews, D. and Ben-Zion, Y.: Wrinkle-like slip pulse on a fault be-tween different materials, J. Geophys. Res., 102, 553–571, 1997. Ben-Zion, Y.: Dynamic ruptures in recent models of earthquake
faults, J. Mech. Phys. Solids, 49, 2209–2244, 2001.
Ben-Zion, Y. and Huang, Y.: Dynamic rupture on an interface be-tween a compliant fault zone layer and a stiffer surrounding solid, J. Geophys. Res., 107, doi:10.1029/2001JB000254, 2002. Ben-Zion, Y.: Key formulas in earthquake seismology,
interna-tional handbook of earthquake and engineering seismology, Part B, Academic Press, 1–50, 2003.
Boullier, A. M., Ohtani, T., Fujimoto, K., Ito, H., Dubois, M.: Fluid inclusions in pseudotachylytes from the Nojima fault, Japan, J. Geophys. Res., 106, 21 965–21 977, 2001.
Derr, J. S.: Earthquake lights: a review of observations and present theories, Bull. Seismol. Soc. Am., 63, 2177–2187, 1973. Electromagnetic Research Group for the 1995 Hyogo-ken Nanbu
Earthquake: Tectonoelectric signal related with the occurrence of the 1995 Hyogo-ken Nanbu Earthquake (M7.2) and preliminary results of electromagnetic observation around the focal area, J. Phys. Earth, 45, 91–104, 1997.
Enomoto, Y. and Zheng, Z.: Possible evidences of earthquake light-ning accompanying the 1995 Kobe earthquake inferred from the Nojima fault gouge, Geophys. Res. Lett., 25, 2721–2724, 1998. Enriquez, A.: The shining, New Scientist, 179, 2402, 26–29, 2003. Hashimoto, M., Sagiya, T., Tsuji, H., Hatanaka, Y., and Tada, T.: Co-seismic displacements of the 1995 Hyogo-ken Nanbu Earth-quake, J. Phys. Earth, 44, 255–279, 1996.
Heaton, T. H.: Evidence for and implications of self-healing pulses of slip in earthquake rupture, Phys. Earth Planet. Inter., 64, 1–20, 1990.
Ismaguilov, V. S., Kopytenko, Yu. A., Hattori, K., Voronov, P. M., Molchanov, O. A., and Hayakawa, M.: ULF magnetic
emis-sions connected with under sea bottom earthquakes, Nat. Haz-ards Earth Syst. Sci., 1, 23–31, 2001,
SRef-ID: 1684-9981/nhess/2001-1-23.
Iyemori, T., Kamei, T., Tanaka, Y., Takeda, M., Hashimoto, T., Araki, T., Okamoto, T., Watanate, K., Sumitomo, N., and Os-himan, N.: Co-seismic geomagnetic variations observed at the 1995 Hyogoken-Nanbu earthquake, J. Geomag. Geoelectr., 48, 1059–1070, 1996.
Katao, H., Maeda, N., Hiramatsu, Y., Iio, Y., and Nakao S.: De-tailed mapping of focal mechanism in/around the 1995 Hyogo-ken Nanbu earthquake rupture zone, J. Phys. Earth, 45, 105–119, 1997.
Kikuchi, M. and Kanamori, H.: Rupture process of the Kobe, Japan, Earthquake of 17 January 1995, determined from teleseismic body waves, J. Phys. Earth, 44, 429–436, 1996.
Kito, Y., Horii, K., Higashiyma, Y., and Nakamara, K.: Optical as-pect of winter lightning discharges triggered by the rocket-wire technique in Hokuriku district of Japan, J. Geophys. Res., 90, 6147–6157, 1985.
Lockner, D. A., Johnston, M. J. S., and Byerlee, J. D.: A mechanism to explain the generation of earthquake lights, Nature, 302, 28– 33, 1983.
Losseva, T. V.: Numerical simulations of the electric and mag-netic fields formation by current generation in the faults during earthquakes, in Geophysical processes in the upper and lower geospheres, Institute Geospheres Dynamics, Moscow, 48–53, in Russian, 2003.
Losseva, T. V. and Nemtchinov, I. V.: Electrification of the atmo-sphere by the underground sources causing lightnings and corona discharges, in Eos, Trans., AGU, 83, 47, Fall Meeting Suppl., Abstract A71B-0104, F99, 2002.
MacGorman, D. R. and Rust, W. D.: The electrical nature of storms, Oxford University Press, 422 pp., 1998.
Melosh, H. J.: Dynamical weakening of faults by acoustic fluidiza-tion, Nature, 379, 601–606, 1996.
Mikumo, T., Olsen, K. B., Fukuyama, E., and Yagi, Y.: Stress-breakdown time and weakening distance inferred from slip-velocity functions on earthquake faults, Bull. Seism. Soc. Amer-ica, 93, 264–282, 2003.
Mizutani, H., Ishido, T., Yokokura, T., and Ohnishi, S.: Electroki-netic phenomena associated with earthquakes, Geophys. Res. Lett., 3, 365–368, 1976.
Molchanov, O. A. and Hayakawa, M.: Generation of ULF electro-magnetic emissions by microfacturing, Geophys. Res. Lett., 22, 3091–3094, 1995.
Molchanov, O., Kulchitsky, A., and Hayakawa, M.: Inductive seismo-electromagnetic effect in relation to seismogenic ULF emission, Nat. Hazards Earth Syst. Sci., 1, 61–67, 2001,
SRef-ID: 1684-9981/nhess/2001-1-61.
Nagao, T. and Uyeda, S.: What happened electro-magnetically at 1995 Hyogo-Ken Nanbu (Kobe) earthquake?, in Problems in Lithosphere Dynamics and Seismicity, Computational Seismol-ogy, 32, 113–121, GEOS, Moscow, 2001.
Nemtchinov, I. V.: Electric-fields and currents near the Earth/atmo-sphere boundary and origin of the earthquake lights, in Nonsta-tionary processes in upper and lower geospheres, Institute Geo-sphere Dynamics, Moscow, 209–230, in Russian, 2002. Nemtchinov, I. V. and Losseva, T. V.: Earthquake lights and
es-timates of electric fields and currents, in III Intern, Workshop on Magnetic, Electrical and Electromagnetic Methods in Seis-mology and Volcanology (MEEMSV-2002), Abstracts, Moscow, Russia. 3–6 September 2002, Geoelectromagnetic Research
In-656 T. V. Losseva and I. V. Nemchinov: Earthquake lights and rupture processes
stitute, RAS, Moscow, 134, 2002.
Parkhomenko, E. I. and Balbachan, M. Ya.: Triboelectric effect of rocks, Dokladi Acad. Sci. USSR, 261, 325–328, in Russian, 1981.
Song, S. G. and Beroza, G. C.: A simple dynamic model for the 1995 Kobe, Japan earthquake, Geophys. Res. Lett., 31, L18613, doi:10.1029/2004GL020557, 2004.
Takahashi, N., Suyehiro, K., Shinohara, M., Kubo, A., Nishizawa, A., and Matsuoka, H.: Aftershocks and faults of the Hyogo-ken Nanbu Earthquake beneath Akashi Strait, J. Phys. Earth, 44, 337–347, 1996.
Tsukuda, T.: Sizes and some features of luminous sources associ-ated with the 1995 Hyogo-ken Nanbu Earthquake, J. Phys. Earth, 45, 73–82, 1997.
Umeda, Y., Yamashita, T., Ito, K., and Horikawa, H.: The bright spot and growth process of the 1995 Hyogo-ken Nanbu Earth-quake, J. Phys. Earth, 44, 519–527, 1996.