DEVELOPMENT AND APPLICATION OF A METHOD FOR COMPUTING CUMULUS TRANSPORTS
by
ROBERT ALVIN HOUZE, JR.
B. S., Texas A & M University (1967)
S. M., Massachusetts Institute of Technology (1969)
SUBMITTED IN PARTIAL FULFILLMENT OF THE REQUIREMENTS FOR THE DEGREE OF DOCTOR OF PHILOSOPHY
at the
MASSACHUSETTS INSTITUTE OF TECHNOLOGY
February, 1972
Signature of Author ... ...
Department of Meteorology, February 2 , 1972
Certified by ... ... ... ... ...
Thesis Supervisor
Acceptedby ... ... " .' '. .a D " * * " "
/ / Chairman, Departmental Committee Lindgren on Graduate Students WPRSS. 'NS. EEj
MAR
29
1972
DEVELOPMENT AND APPLICATION OF A METHOD FOR COMPUTING CUMULUS TRAN PORTS
by
ROBERT ALVIN HOUZE, JR.
Submitted to the Department of Meteorology on 2 February 1972 in Partial Fulfillment of the Requirements for
the Degree of Doctor of Philosophy. ABSTRACT
This study is concerned primarily with the role of cumulus convection as a vertical transport process. The characteristics of the convection are deter-mined from precipitation patterns and, consequently, non-precipitating cumulus ele-ments are excluded. The three principle components of the investigation are: (1) a
synthesis of rain gauge and radar data to establish the nature and relative importance of precipitation associated with cumulus convection; (2) the development of a model for computing vertical transports by cumulus updrafts, with rainfall data as the basic input; and (3) the application of the model in a climatological study of the vertical transports of sensible heat and angular momentum.
Precipitation patterns (referred to as storms) were studied for 6 cy-clonic and 2 thunderstorm situations in New England. Cumulus-scale showers (cells) in each storm were located within small mesoscale precipitation areas (SMSA's), 100 to 400 km2; on the average four cells were in a SMSA at any one time. Altogether, life histories of 25 SMSA's and 125 cells were examined. In an air mass thunder-storm situation SMSA's were isolated; however, in all the other cases SMSA's oc-curred in groups of three to six within large mesoscale areas (LMSA's), 2000 to
5000 km2 . A supplementary study showed that LMSA's in seventeen cyclones formed banded structures aligned within ± 30 deg of the surface isobars. In cyclonic storms,
LMSA's were grouped within synoptic-scale rainfall areas with a density of 1 to 6 per 105 kmn2 . Depth of cells ranged from 1 to 14 km and the cellular rain ranged from 2% to 25% of the total in a LMSA.
Equations for computing model quantities express the conservation of properties in cumulus-scale updrafts. The effects of entrainment and detrainment are specified. The mass of air transported upward Mc(z), where z is height, in cellu-lar updrafts is computed from the conservation of water, given the amounts of cellucellu-lar and mesoscale precipitation. Important factors which must be considered are the efficiency with which condensate is converted to precipitation in cells and tile amount of mesoscale precipitation which should be attributed to cellular lifting. That some mesoscale rain comes from cumulus cells is suggested observationally since each SMSA studied for its lifetime contained at least one cell. The temperature difference,
Tc(z) - T'(z), between cumulus-scale updrafts and their environment is calculated from conservation relations for vertical momentum and water. Temperature Tc(z)
-2-
-3-in cells is approximated by a moist adiabat represent-3-ing atmospheric conditions and T'(z) is a computed quantity, the second variable being the hydrometeor mixing ratio. The environment is assumed saturated since the modelled cells are enmbedded in mesoscale rainfall areas. For the temperature calculations, the vertical velocity is specified from a knowledge of cell depth, available measurements of cumulus up-draft speeds being referred to for making realistic estimates. The vertical
velo-city used in the calculation of temperature differences is estimated independently of the calculation of Mc(z). The latter, which is not a rate of transport, is later con-verted to a vertical velocity only to provide a guide for selecting realistic modelling
parameters. The westerly wind speed difference between model cells and their en-vironment is calculated from the conservation of horizontal momentum in the up-drafts. The form drag exerted by the relative wind on the updrafts is included but contains a large uncertainty. The vertical transports of sensible heat and angular momentum by cumulus-scale updrafts are proportional to Mc(z) [Tc(z) - T'(z)] and M,(z) [Uc(z) - u'(z)] respectively. The uncertainty in each of these transports is es-timated to be plus or minus a factor of four, by considering extreme assumptions.
The model equations are tested on 1900 hr of detailed rainfall data representing four seasons at Boston, Mass.; New Orleans, La.; San Juan, P.R.; and Tatoosh, Wash. The computed cumulus-scale vertical transports for different months are plausible, and during certain seasons at each station, the cumulus-scale fluxes are the same order of magnitude as larger-scale fluxes. The cumulus-scale sensi-ble heat flux at Boston in July at the 6 km level is 70% as large as the average annual synoptic-scale heat flux, for Tatoosh in October a similar comparison gives 60% at the 4 km level, for New Orleans above 6 km the cumulus -scale flux exceeds the
synoptic-scale heat flux by a factor of five in April and July, while at San Juan in Oc-tober the cumulus-scale sensible heat transport at 7.5 km is 100% as large as the total required flux. Similar results are obtained by comparing cumulus-scale fluxes of angular momentum with the transport accomplished by the mean meridional cir-culation. Cumulus-scale transports become negligible in such locations as Tatoosh in summer and small in regions represented by Boston in winter and San Juan in winter and spring.
Analysis of the uncertainties in the calculations indicates that more accurate cumulus-scale transports may be obtained from a better understanding of the condensation and precipitation processes in cells and mesoscale areas. The model would be made more general by incorporating downdrafts, but too little appears to be known about them for their present quantitative inclusion. The plausibility of the
results of this study indicates that the modelling technique could be applied to a more extensive climatological study of global transports.
Thesis Supervisor: James M. Austin Title: Professor of Meteorology
ACKNOWLEDGEMENTS
The author most gratefully acknowledges his principal advisors, Professor James M. Austin and Dr. Pauline M. Austin for their guidance and
en-couragement during the development of this thesis. The critical comments and ad-vice of Professor Frederick Sanders were also most helpful.
Appreciation is extended to Mrs. Mary Wolf for typing the final manuscript and to Mr. Steven Ricci for drafting the figures. The author's wife, Mrs. Yolonda Houze, was most helpful in typing initial drafts and proofreading the manuscript. The careful and accurate technical assistance of Mr. Christopher Schmandt in the data processing for Chapter IV was invaluable and especially
marked by his interest.
The Massachusetts Institute of Technology and the National Science Foundation provided the author and his family with financial support and comfortable living conditions during their stay at M.I.T.
The author thanks his wife Yolonda for four and a half years of patience and his daughter Rebecca for the joy she has provided.
-4-li-L
TABLE OF CONTENTS TITLE 1 ABSTRACT 2-ACKNOWLEDGEMENT'S 4 TABLE OF CONTENTS 5 LIST OF TABLES 8 LIST OF FIGURES 9 CHAPTER I. INTRODUCTION 13
CHAPTER II. TYPICAL PRECIPITATION PATTERNS 17
A. Occurrence of precipitation areas of various scales 18
1. New England 18
2. Other geographical areas 21
B. Characteristics of areas of various scales 24
1. Cells 24
2. Small mesoscale areas 25
3. Large mesoscale areas 27
4. Intensity of precipitation 27
C. Origin of mesoscale precipitation 29
D. Outcome of descriptive studies; empirical basis for modelling 35
CHAPTER III. MODEL STORM 37
A. General description of model 37
B. Role of entrainment in model 46
C. Mass of air transported upward 48
1. Basic equation for cellular mass transport 48 2. Specification of entraimnent and vertical variation of Mc(z) 49 3. Expression for total cellular condensation 54 4. Mesoscale and synoptic mass transport 56 D. Temperature difference between cells and environment 57 E. Horizontal wind speed difference between cells and environment 64 F. Consistency between water budget and kinematics 65
1. Cells 66
2. Water budget and kinematics of whole storm 67 3. Limits and best estimates for cellular condensation 71
-5-
-6-CHAPTER III cont'd
G. Uncertainties 72
H. Determination of input quantities 73
1. Cellular precipitation 74
2. Mesoscale and synoptic precipitation 74
3. Vertical structure of storm 75
4. Temperature in cells 76
5. Humidities 77
6. Synoptic-scale wind field 77
I. Computational scheme 77
J. Examples of calculations 80
CHAPTER IV. CLIMATOLOGICAL STUDY OF CUMULUS TRANSPORTS 85
A. Data sample 85 1. Selection of stations 85 2. Description of data 87 B. Data processing 90 1. Rain-gauge records 91 2. Radar data 93 3. Soundings 93
C. Monthly transports for each station 94
1. Computation of monthly curves 94
2. Standards of comparison 96
3. Results for Boston 98
4. Tatoosh 101
5. San Juan 102
6. New Orleans 105
D. Climatology of cumulus transports 107
E. Comment on temporal concentration of cumulus transports 113 CHAPTER V. CONCLUSIONS AND SUGGESTIONS FOR FURTHER 114
RESEARCH
FIGURES 117
APPENDIX A. DATA AND METHODS OF ANALYSIS USED IN DESCRIPTIVE 151 STUDIES OF NEW ENGLAND PRECIPITATION PATTERNS
APPENDIX B. SPECTRAL ANALYSIS OF RAIN-GAUGE RECORDS 157 APPENDIX C. CHARACTERISTICS OF LARGE MESOSCALE AREAS
_L ~I____*~___I~__I1__~^_~ L__Y il__i~_~__ ___I_^^_~
-7-APPENDIX D. INVESTIGATION OF SURFACE VORTICITY AND DIVER-GENCE IN THE VICINITY OF MESOSCALE PRECIPITATION AREAS
APPENDIX E. FLOWCHART OF MODEL COMPUTATIONS FOR A STORM
BIOGRAPHICAL NOTE 169 REFERENCES 173 179 181
LIST OF TABLES
Table Page
1 The average number and density of small mesoscale 20 areas in each large mesoscale area at any one time.
2 Durations of small mesoscale areas. 26
3 Average areas and durations of large mesoscale precipi- 26 tation areas.
4 Rainfall rates in areas of various scales for different 28 storms.
5 Rate at which water is deposited by various parts of large 28 mesoscale areas.
6 Vertical velocities considered realistic for model cells at 62 heights of maximum updraft.
7 Peak updraft velocities measured in cumulus clouds. 62
8 Comparison of storm-averaged vertical velocities computed 69 from model storm and from wind data.
9 Precipitation parameters for storm of 24-25 March 1969. 82
10 Total number of storms and total number of hours with at 88 least 0.01 in of precipitation in data sample.
11 Total rainfall and the amounts considered cellular for 12 mo 103 at Tatoosh.
12 Summary of comparisons of monthly cumulus-scale trans- 108 ports with transports by circulations of other scales.
A-i Characteristics of Weather Radars at MIT. 151
-8-
LIST OF FIGURES
Figure Page
1 Precipitation pattern showing large mesoscale areas, small 117 mesoscale areas, and cells.
2 Distribution of number of large mesoscale areas appearing 118 simultaneously in area observed by the radar, a circle
with 200-km radius.
3 Distributions for average number at one time and density of 118 cells within small mesoscale areas.
4 Plan position display of a hurricane as viewed with an air- 119 borne radar.
5 Average vertical extent of cells and of surrounding preci- 120 pitation during different storms.
6 Examples of distributions of the durations of cells for 121 individual storms.
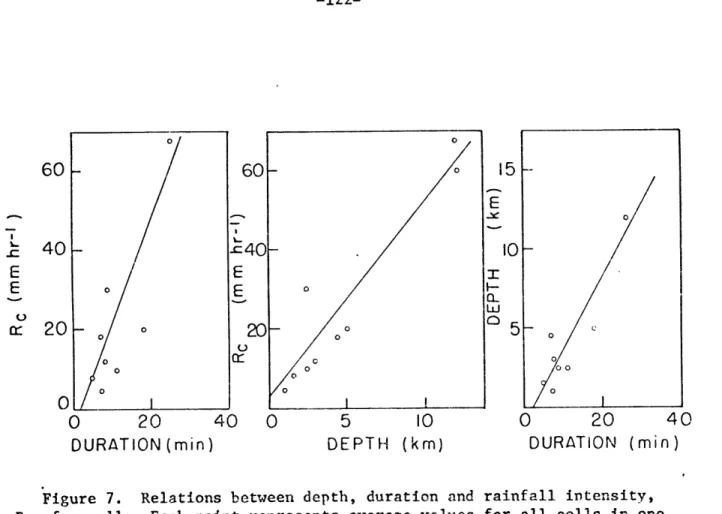
7 Relations between depth, duration, and rainfall intensity for 122 cells.
8 Distributions of areas of small mesoscale precipitation areas. 122 9 Relative humidity pattern shown by hourly soundings at 123
Bedford, Mass.
10 Schematic diagram of model storm. 124
11 Sketch illustrating entrainment, detrainment, and vertical 125 transport of an arbitrary quantity in cumulus cells.
12 Computed vertical mass transports for various assumptions 126 about entrainment and detrainment.
13 Model cell radius and entrainment rate as functions of cell 127 depth.
14 Model profiles of mass transport, entrainment rate, entrain- 128 ment, detrainment, and net entrainment.
- 10
-Figure Page
15 Calculations of cellular temperature excess and hydro- 129 meteor content for different sets of assumptions.
16 Computed values of difference in westerly wind speed inside 130 and outside of cells for two extreme values of drag coefficient.
17 (a) Curves of cellular temperature excess as computed from 131 physical principles and approximated in model-storm
pro-gram. (b) Temperature excesses for two different values of
8
e which characterizes the lapse rate in the cells.18 Thirty-second average rainfall rates printed out by com- 132 puter for the hours 1000 to 1200 EST, 25 March 1969,
West Concord, Mass.
19 Photograph of MIT WR-66 radar RHI for 25 March 1969, 133 1140 EST.
20 Temperature soundings for Nantucket, Mass., 24-25 March 134 1969.
21 Westerly winds and least-square fits for Nantucket, Port- 135 land, and Albany, 24-25 March 1969.
22 Model cumulus-scale vertical mass transport, sensible 136 heat transport, angular momentum transport and associated
model temperature and westerly wind speed differences be-tween cells and their immediate environment for the hour 1100 to 1200 EST, 24-25 March 1969, at West Concord, Mass.
23 Model cumulus-scale vertical mass transport, sensible 137 heat transport, angular momentum transport and associated
model temperature and westerly wind speed differences be-tween cells and their immediate environment for the hour 1200-1300 EST, 9 July 1962, at West Concord, Mass.
24 Monthly upward transport of sensible heat by cumulus- 138 scale cells at Boston.
25 Monthly downward transport of angular momentum by 140 cumulus-scale cells at Boston.
- 11
-Figure Page
26 Monthly upward transport of sensible heat by cumulus - 142 scale cells at Tatoosh.
27 Monthly downward transport of angular momentum by 143 cumulus-scale cells at Tatoosh.
28 Monthly upward transports of sensible heat by cumulus- 144 scale cells at San Juan.
29 Monthly downward transport of angular momentum by 145 cumulus-scale cells at San Juan.
30 Monthly upward transport of sensible heat by cumulus- 146 scale cells at New Orleans.
31 Monthly downward transport of angular momentum by 147 cumulus-scale cells at New Orleans.
32 Latitude-height distribution of upward transport of heat 148 by large-scale eddies in a model of the atmospheric
general circulation, after Manabe et al (1970).
33 Latitude-height distribution of vertical transport of angu- 148 lar momentum by the large-scale eddies in an
atmos-pheric general circulation model, after Smagorinsky et al (1965).
34 Winter heat budget for the belts 50 N to 320 N and 320 N 149 to 900 N, and the vertical heat fluxes through the 500-mb
surface and from the earth's surface. After Palmen and Newton (1969).
35 The winter total mass circulations and angular momen- 149 tum budget north and south of latitude 300 in the northern
hemisphere. After Palmen and Newton (1969).
36 Vertical absolute angular momentum flow due to standing 150 and transient eddies plus friction, on a meridional cross
section through the atmosphere. After Starr et al (1970).
- 12
-Figure Page
A-1 Example of data from high-resolution tipping-bucket 155 rain gauge.
B-I Spectra of rainfall rate for seven periods of precipitation 158 at Boston.
B-2 Spectrum obtained by converting individual spectra to a 161 scale of wavelength and averaging the spectra for seven
storms.
C-I Precipitation pattern, as depicted by WR-66 radar, and 166 surface winds and isobars for 5 November 1969, 1300 EST.
C-2 Distribution of elongation of banded structures formed 167 by large mesoscale areas.
C-3 Orientation of elongated rain areas relative to surface 167 isobars and surface wind direction.
D-1 Vorticity and divergence computed by the triangulation 170 method from surface winds at three stations enclosing an
area of 605 km2 during a period when mesoscale precipi-tation areas were passing over the triangle.
CHAPTER I
INTRODUCTION
Meteorologists have studied cumulus convection from a variety of
viewpoints such as its relationship to synoptic map parameters, its climatology, the
dynamics and thermodynamics of cumulus development, and its accompanying
con-densation or precipitation processes. For the last two :considerations, models of
cumulus clouds have been postulated and explored (e.g. Weinstein, 1970; Simpson and
Wiggert, 1969, 1971). Much of this modelling effort has been concerned with the
question of what determines the vertical growth of a cumulus cloud. The
investiga-tion reported in this thesis has a different objective, namely, to study the role of
cumulus convection as a transport mechanism in the atmosphere. The present
con-cern, therefore, is the effect of cumulus rather than its mode of development.
Although it is recognized that cumulus convection transports such
quantities as sensible heat and horizontal momentum vertically, quantitative estimates
of the relative role of cumulus-scale processes in the total spectrum of atmospheric
motions are difficult to obtain. The small horizontal dimensions and the turbulent
nature of the cumulus phenomenon make it practically impossible to obtain useful
measurements of such dynamically significant quantities as wind, temperature,
pres-sure, and humidity. If cumulus transports are to be computed, a modelling
tech-nique is required. The inability to obtain satisfactory measurements of the
conven-tional variables in and around cumulus clouds also has led the various investigators
of growth aspects of cumuli to adopt a modelling approach.
-- 14
-From a climatological viewpoint, cumulus activity can be classified
according to the occurrence or non-occurrence of precipitation. When cumulus cells
are accompanied by precipitation, an important product of the convection, namely
the rainfall, can be measured. The question arises whether cumulus transports can
be deduced or modelled from a knowledge of the detailed nature of the precipitation
associated with the convection. This study has been concerned, therefore, with the
development of a consistent model which satisfies such readily observed aspects of
the cumulus elements as cloud depth and surface rainfall amounts while remaining
consistent with only the grosser features of the larger-scale environmental fields
of temperature, humidity, and horizontal wind. The approach was suggested by
Austin (1968). The applicability of the transport model which is developed here is
tested, or at least indicated, by comparing the cumulus-scale transports of sensible
heat and angular momentum, computed for a climatological sample of rainfall data,
with fluxes which have been calculated by other investigators for larger-scale
atmos-pheric modes of overturning. The comparison also provides some insight into the
relative importance of cumulus -scale motion as a vertical transport mechanism in
the atmosphere.
Chapter II of this thesis deals with the question of whether cumulus
convection is organized within atmospheric precipitation systems in such a way that
the rainfall associated with convective activity may be readily identified, measured,
and represented in a parameterized manner. Further, an assessment of the
cumulus-scale component of the total precipitation indicates the climatological significance of
the process. Extensive analyses of precipitation observed with radars and __~I_
- 15
-high-resolution rain gauges show that storms in all types of situations are in fact
com-posed of certain basic structures.* The smallest are cumulus-scale elements or
cells which have the largest rainfall rates and are 1 to 10 km2 in area. Cells are
always found within small mesoscale areas which are of the order of 100 km2 and
are less intense. Small mesoscale areas are usually found grouped together in large
mesoscale areas of the order of 1000 km2. Synoptic areas are larger than 104 km2
and are usually associated with cyclones. Synoptic areas contain a number of large
mesoscale areas which in turn contain small mesoscale areas and cells. Although a
particular storm may not contain all of these scales, whenever one occurs, all of the
smaller more intense ones are found within it. The origin of the mesoscale
precipi-tation does not appear to be known and several possible explanations for its
occur-rence may be offered. One hypothesis is that part of the mesoscale precipitation is
produced within the cumulus cells. This possibility is an important consideration
for the modelling of cumulus-scale transports which are related to the amount of
con-densation that occurs in cells.
A model storm for which cumulus-scale transports of sensible heat
and angular momentum are computed is developed in Chapter III. The model is
com-posed of cells, mesoscale areas, and synoptic areas within which net transports of
air upward are deduced from given or observed precipitation amounts. Temperature
and horizontal momentum differences between cellular updrafts and their environments
are computed from observed parameters of the vertical depth of the cells and broader
* The term storm in this study refers either to a horizontal area covered by precipi-tation or to a continuous period of precipiprecipi-tation at a point.
- 16
-characteristics of the environment. Important aspects of the physical modelling
in-volve specifying the entrainment process and relating condensation which occurs in
cumulus updrafts to measurements of precipitation. Equations are developed from
present theoretical and empirical knowledge of cumulus convection and uncertainties
in the calculations are analyzed.
The model storm is applied in a climatological study of the vertical
transports of sensible heat and angular momentum by cumulus updrafts. This inves
-tigation is discussed in Chapter IV. Input data for the model are obtained from a
climatological sample of storms at Boston, Mass.; New Orleans, La.; San Juan, P.R.;
and Tatoosh, Wash. These stations represent climates which on the basis of air
mass properties would be expected to have different amounts of cumulus activity.
From the calculations for these representative stations, a climatology of cumulus
transports is constructed. This application of the model gives an indication of the
relative importance of transports on the cumulus scale as compared with those arising
from larger-scale motions in the atmosphere.
CHAPTER II
TYPICAL PRECIPITATION PATTERNS
In this chapter, several descriptive studies of precipitation patterns are discussed. These show that patterns in storms of different seasonal and synop-tic types, and in different geographical locations, are composed of certain basic
structures which may be described or modelled in a parameterized manner. In Chap-ter III, a model is described which has been designed to calculate the vertical trans-ports of sensible heat and angular momentum by cumulus updrafts from certain ob-served parameters of a storm. As noted in Chapter I, a crucial aspect of this modelling involves estimating the amount of water condensed in cumulus cells from measurements of rainfall. Thus, an important observed parameter of the storm is the amount of rain which falls within intense cumulus showers. The descriptive
studies discussed in this chapter, however, show that cumulus cells are typically organized within mesoscale precipitation areas of a few hundred to a few thousand square kilometers in dimension and that part of the mesoscale precipitation also may have been condensed within cumulus cells. It is therefore necessary to measure both cumulus and mesoscale rainfall to properly assess the amount of condensation which occurs within cumulus updrafts. Much of the present chapter is devoted to the des-cription of the characteristics of basic features of precipitation patterns. It is this knowledge of typical patterns which makes it possible to identify and measure the
observed input parameters for the model storm described and applied in the following chapters.
-A. Occurrence of precipitation areas of various scales 1. New England
Quantitative radar observations made at MIT over a number of years
have shown that precipitation patterns in both cyclonic storms and thunderstorm
situ-ations are characterized by the consistent occurrence of precipitation areas on the
order of one hundred to several thousand square kilometers. As noted in Chapter I,
these have been generally referred to as mesoscale precipitation areas since they
are intermediate between showers produced by cumulus convection and the broad
re-gions of precipitation usually associated with warm frontal lifting in extratropical
cyclones. A particularly notable feature of mesoscale areas is that they are regions
where cumulus activity is likely to be found.
Austin and Houze (1972) investigated quantitatively the structure of
precipitation areas in New England with particular emphasis on the characteristics
of mesoscale areas and their observed relationships to larger- and smaller-scale
phenomena. The basic data used were quantitative radar PPI (Plan Position Indicator)
and RHI (Range Height Indicator) displays and tipping-bucket rain-gauge records.
The data and methods of analysis are described in more detail in Appendix A.
Al-together, Austin and Houze examined precipitation patterns in 25 storms
represent-ing a variety of synoptic and seasonal situations.
They define the following horizontal scales for precipitation areas.
(1) Synoptic areas are 104 km2 or more in area.
(2) Large mesoscale areas (LMSA's) are 103 to 104 km2 in area.
(3) Small mesoscale areas (SMSA's) are 50 to 103 kim2 in area.
_~II_
-- 19
-(4) Cells are 1 to 10 km2 in area; they are assumed to be associated with cumulus convection.
The observed characteristics of cells, SMSA's, and LMSA's are described in some detail in section B of this chapter and in Appendix C. An example of a precipitation pattern containing all of the above scales is shown in Figure 1. An area of any of these scales is identified as a region with higher rainfall rates than its surroundings.
Synoptic areas were observed in each cyclonic storm analyzed, but not with a cold frontal passage or air mass thunderstorms.
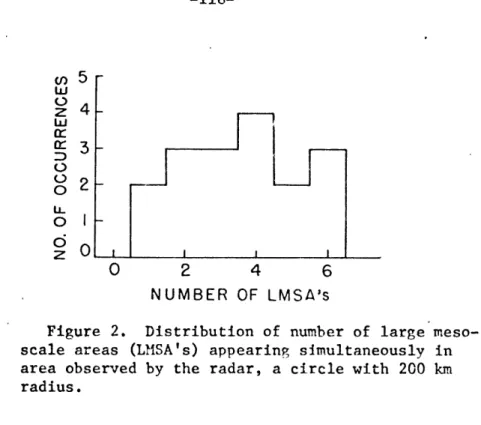
Within every synoptic precipitation area there was at least one LMSA, usually several. The number of LMSA's present within a circle 200 km in radius surrounding MIT, ranged from one to six; the observed distribution is shown in Figure 2.
Within every large mesoscale area, both those in the synoptic preci-pitation areas and the frontal band which was per se a LMSA, several small meso-scale areas were found. Also, with the exception of the air mass thunderstorms, which in themselves were separate small mesoscale areas, SMSA's rarely, if ever, were observed outside of LMSA's. The number and concentration of small
meso-scale areas within each large mesomeso-scale area were recorded at several times dur-ing the lifetime of each large mesoscale area, and the average values of these quan-tities for any one time are listed in Table I.
Cells were almost always located either within a clearly identifiable SMSA or in a cluster forming an area of similar size. At least one cell was found within each SMSA. The number and concentration of cells within individual S MSA's
- 20
-Table 1. The average number of small mesoscale areas in each large mesoscale area at any one time, NSM, and the average density
of SMSA's within each LMISA, DSM.
NSM 18 May 1963 8 July 1963 a 8 July 1963 b 29 August 1962 17 September 1963 DSM(SMSA's per 2500 km2) 2 4 2 5 3 4 3
- 21
-were recorded at several times during their lifetimes and an average for each SMSA
was obtained, the results being summarized in Figure 3.
The basic pattern which was observed is that a precipitation area of
any of the three sizes, synoptic, LMSA or SMSA, contains one or several of the next
smaller-sized areas. It should be pointed out, however, that the structures are not
rigid. The lifetimes of the smaller areas are considerably shorter than those of the
larger ones. A synoptic area may last several days moving along with the cyclone:
LMSA's typically have lifetimes of several hours; SMSA's last about an hour; and
the duration of cells ranges from a few minutes to about half an hour. Therefore the
basic precipitation pattern continually changes texture as LMSA's build and dissipate
within the synoptic areas, SMSA's build and dissipate within the LMSA's, and the
individual cells are relatively short-lived components of the SMSA's.
An attempt was made to analyze the scales present in rainstorms
more objectively and for a larger sample of data by performing a spectral analysis
on tipping-bucket rain-gauge records. After several storms were analyzed, it
be-came apparent that large mesoscale areas, small mesoscale areas, and cells which
are notable by their rainfall intensities, horizontal and vertical dimensions,
dura-tions, and motions are not clearly characterized by local periodicities which are
detectable by spectral analysis. The spectral computations are discussed in
Appendix B.
2. Other geographical areas
Similar behavior in precipitation patterns is observed in other
- 22
-pattern within a wave depression which passed over Great Britain. Within this dis-turbance, they found generally band-shaped areas with widths of 50 - 100 km and lengths of 300 - 900 man; within the bands there were more intense "small areas" of
the order of 1500 lac2; clusters of cells were located within the "small areas." Matsumoto, Ninomiya, and Akiyama (1967) described a family of mesoscale disturbances which passed over a dense rawinsonde network in Japan. They detected areas of upward motion of the same horizontal dimensions as Austin's and Houze's large mesoscale areas. Heavy snowfalls were associated with the pas-sage of these areas, and cumulus-scale cells within these disturbances were observed by radar.
Mesoscale phenomena associated with frontal rainstorms in California are described by Elliott and Hovind (1964, 1965). They found that these storms were characterized by alternating warm-moist and cold-dry regions of the order of
104 km2 in area, oriented roughly parallel to the frontal zone. Superposed on the first warm-moist area preceding the frontal passage they found bands of relatively more intense precipitation. These bands apparently also corresponded in dimension to Austin's and Houze's large mesoscale areas, and they contained cumulus showers of a few square kilometers in area.
Patterns of large mesoscale areas containing smaller ones which in turn contain cumulus-scale elements are also observed in the tropics. Figure 4 con-tains a quantitative plan position display obtained in a hurricane with an airborne
radar. The rainbands which form a spiral pattern around the eye of the storm have the general dimensions of large mesoscale areas. Numerous small mesoscale areas
- 23
-are aligned along each band; some of these appear as regions outlined by a particular
contour of intensity while others are denoted as clusters of cells. In several instances,
cells denoted by a contour of one level appear within a small mesoscale area which
is outlined by a lower valued contour. In the northeast quadrant of the radar display,
breaks along azimuthal lines in the precipitation pattern are caused by banking of the
aircraft.
Mason (1970) notes that pictures from geostationary satellites reveal
that, over the tropical oceans, cumulus and cumulonimbus clouds, individually
1 - 10 km across tend to group into mesoscale units up to 100 km in diameter and that these, in turn, form "cloud clusters" of 100 - 1000 km in diameter. These large
mesoscale to synoptic-scale clusters are generally associated with the troughs of
lower-tropospheric wave disturbances of characteristic wavelength 2, 000 - 10, 000 km
or with the "intertropical convergence zone."
All of the above findings suggest that precipitation patterns at different
latitudes and longitudes have some similar features in their horizontal structure.
However, in view of the differences in the stability of air masses influencing the
cli-mates of different geographical areas, the cumulus-scale phenomena may be more
extensively observed in some regions than others.
The occurrence of certain basic structures which may be identified in
all types of storms allows the construction of model storms which may be used for
a variety of purposes, such as to study precipitation mechanisms or, as described
24
-B. Characteristics of areas of various scales
This section, with Appendix C, summarizes the detailed
characteris-tics of precipitation areas of the different scales defined and studied by Austin and
Houze (1972). More detail may be found in their paper and in Houze's (1969) thesis.
Knowledge of these characteristics is used to set criteria for identifying and
measur-ing basic parameters of the model storm described in the next chapter.
1. Cells
Horizontal dimensions of the cells could not be determined because
they often appeared to be at least as small as the dimensions of the radar beam, but
vertical extents were observed on the RHI by viewing cells at close ranges. In any
single storm, the cells tended to be roughly the same height at their maximum
de-velopment, but the depths of the cells and the position of the layer containing them
varied considerably from storm to storm. Vertical extent of cells and height of the
surrounding precipitation for each of the storms studied are shown in Figure 5. In
the summer showers and thunderstorms the cells appeared to extend throughout the
depth of the surrounding precipitation and protruded above, while in the cyclonic
storms they seemed to be completely embedded in the more widespread rain.
Figure 6 shows distributions of the durations of cells measured in
several storms. The distribution for 2 December 1962 is typical of the three winter
storms in which most of the cells lasted only a few minutes. In cyclonic storms in
other seasons there are also very many cells with only a few minutes' duration, but
the distribution is broader as on 17 September 1963. In summer showers and
- 25
-than 10 minutes and very few longer -than 30 minutes, the distribution for 9 June 1965
being typical.
The durations, depths and intensities of cells are more or less linearly
related, as indicated in Figure 7. Each of the points in the figure represents one
storm, showing the average values for the cells observed in that storm. The lines
of least-square fit indicate that the cells tend to last about 5 minutes for every 2 km
of height and for each 12 mm hr-1 of intensity.
The motions of cells observed from the radar were compared with
the winds at the level midway between the top and bottom of the cells. Because of
their short duration, cell motions were sometimes difficult to determine and in some
of the storms appeared quite variable. On the average, however, velocities in each
storm were roughly in agreement with the wind flow at the mid-cell level (within + 25
degrees in direction and + 50% in speed in all cases, and generally much closer.)
2. Small mesoscale areas
For each of the small mesoscale areas examined, the average area
was computed from a number of individual observations during its lifetime, the values
being given in Figure 8. The majority of the SMSA's were between 100 and 400 km2,
with occasional larger ones up to 800 km2. Durations could be observed for only 15
of the SMSA's: for the other nine, either the data were interrupted or the areas
moved out of range. The durations varied from 20 to 150 minutes as shown in Table 2,
the median value being 50 minutes.
With the exception of the one isolated thunderstorm complex that was
- 26
-Table 2. Duration of small mesoscale areas.
Time Interval (Minutes) Number of S MSA's 420 20-39 40-59 60-79 80-99 100-119 120-139 140-159
Table 3. Average areas and durations of large mesoscale precipitation areas.
Date 18 May 1963 8 July 1963 a 8 July 1963 b 29 August 1962 17 September 1963 Area (km2) 3000 2200 3000 3300 2500 4000 3300 4500 Duration* (min.) 200 240 80 ) 80 720 240 ' 210 )210
*Durations preceded by > could not be determined more precisely because the data were interrupted.
- 27
-the cells within it (again within + 25 degrees in direction and + 50% in speed).
3. Large mesoscale areas
Large mesoscale precipitation areas were recognizable in all of the
storms except the air mass thunderstorm complex; however, the characteristics of
LMSA's have not been determined as conclusively as the typical features of cells and
SMSA's. The average areas, durations, and motions for those LMSA's which could
be identified and followed for most of their lifetimes are listed in Table 3. The
de-tailed characteristics of LMSA's, as observed by Austin and Houze (1972), are
discussed in Appendix C.
4. Intensity of precipitation
Of the characteristics of precipitation areas, probably the most
im-portant for the model which is described in Chapter III are the relative precipitation
rates in areas of various scales. In the modelling, cells and mesoscale areas are
detected from rain-gauge records. Relative rates together with a knowledge of
typi-cal durations over the gauge are used to determine whether precipitation is cellular,
mesoscale, or synoptic in the storms from which input data for the model are
obtained.
Precipitation rates within the various areas, as determined from the
radar and rain-gauge data, are summarized in Table 4. Although the rainfall rates
within the mesoscale areas varied considerably from day to day, on any given day
the variations were generally slight, except in the thunderstorm situations on 9 June
65 and 8 July 63 b. The ratios were about the same in all of the storms with the
- 28
-Table 4. Rainfall rates in mm hr -1 for large mesoscale areas (rLM), cells (rC) in each storm.
Date 12 Jan 2 Feb 18 May 9 Jun 8 Jul 8 Jul 29 Aug 17 Sep 6 Dec 0.5 0.5-1 0.2-0.5 0 0.5-1 0 0.5-2 Trace 0.5-1
synoptic-scale precipitation areas (rS), small mesoscale areas (rSM), and
rLM * 2-3 0 2 0.5-5 5 0.5-1 * rSM 1-2 2-3 5 5-20 5 5-25 10 2 3-6 rC 3-4 5-10 10-15 45-90 10-40 20-100 15-20 4-15 10-50
*Not possible to determine.
Table 5. Water deposited by various parts of the larger mesoscale areas. LM denotes region in LMSA's but outside of SMSA's; SM is in SMSA's but outside of cells, and C denotes within cells.
Total for LMSA (107 m3 hr- 1)
18 May 63
8 Jul 63 a
Percent in each area
LM SM 10.4 7.1 10.4 15.7 31.2 32.7 2.8 3.4 Date 8 Jul 29 Aug 17 Sep 63 b 62 63
rs
29
-the small mesoscale rate about twice -the size of -the large mesoscale rate. The
rates in the cells varied more widely, ranging from 2 to 10 times as large as the
small mesoscale rate.
The rate at which water was deposited by areas of each scale was
computed from their observed rainfall rates and their average areas during the
life-time of each large mesoscale area. In these computations an area of 8 km2 was
as-signed to each cell. The rates of deposit which were calculated are in Table 5; it is
evident that of the total water deposited by the large mesoscale areas, significant
fractions came from each of the small and large mesoscale regions, while the
cellu-lar contribution ranged from 2 to 35 percent.
C. Origin of mesoscale precipitation
In this section, the term mesoscale precipitation refers both to the
enhancement over the synoptic rate in regions surrounding cumulus cells in cyclonic
storms and to the lighter precipitation observed in the vicinity of the intense cells
in bands or complexes of thunderstorms. While there is little doubt that the rain
which falls from the cells is condensed within cumulus updrafts, the origin of the
mesoscale precipitation does not appear to be known. Several explanations which
may be offered for the occurrence of mesoscale precipitation areas are discussed in
this section. It is important to understand the origin of the rain which falls from
areas of different scales since in the modelling described in Chapter III, the amount
of water condensed in cells is estimated from measurements of precipitation.
An hypothesis is advanced by Austin and Houze (1972) that part of the
mesoscale precipitation is actually formed in cumulus updrafts and is spread by
- 30
-divergence aloft or simply left as cloud when the updraft dies. In particular, this
hypothesis is directed toward explaining the origin of the precipitation in SMSA's
which appear to have a close relationship with the cells, shown by the facts that
every SMSA contained at least one cell and that their motions were very similar to
those of the cells within them. As pointed out by Houghton (1968) cumulus updrafts
are generally of such short duration that they have a low precipitation efficiency.
During the time that the updraft is active, water is condensed out rather rapidly in a
region of limited horizontal extent. When the updraft dies part of the condensate
falls out quickly forming the sharp showers we call cells, but considerable amounts
of condensate remain aloft as cloud or small precipitation particles which fall slowly
and may be spread by divergence over a larger area. If several updrafts or cells
form close to each other either simultaneously or in a sequence, the condensate
which they leave aloft would accumulate to create a small mesoscale precipitation
area which would last as long as cells continue to develop within it but would rain out
and disappear shortly after the cessation of convective activity. This hypothesis is
supported by the results of Melvin (1968) who, using quantitative radar displays,
ex-amined six thunderstorm complexes for their entire lifetimes and also a developing
squall line. He found that the precipitation areas appeared to develop around the
cells and lasted only as long as cells continued to form. He also computed the
up-draft velocities which would be required to produce the condensate for the observed
precipitation and for various assumed values of the efficiency of precipitation; the
- 31
-Qualitatively, this hypothesis appears plausible for small mesoscale
areas in cyclonic storms also. If cells are embedded in more widespread
precipita-tion, any condensate which is not deposited in the resulting shower would be added
to the general rain forming a small mesoscale area around a group of showers. At
least one cell was observed in every SMSA; but in some of them, the percentage of
rain in the cells is extremely small compared with that in the small mesoscale areas,
and some other mechanism may be involved.
Enhanced precipitation in mesoscale areas could reflect variations on
the mesoscale of any one of several other quantities such as vertical velocity,
humi-dity, temperature, or condensation nuclei.
There does not appear to be much basis to expect that mesoscale
cipitation areas are associated with systems of lifting on the same scale. The
pre-sence of cumulus activity in mesoscale precipitation areas indicates that these regions
are probably characterized to some extent by conditional instability. Bjerknes (1938)
showed that conditional instability is more likely to be released in cumulus
convec-tion than any larger-scale mode of overturning. Moreoever, spectral analyses of
wind data such as those of Van der Hoven (1957) and Oort and Taylor (1969) suggest
a dearth of atmospheric motion systems between cumulus and synoptic scales. Their
data, however, are probably more representative of average atmospheric conditions
than of unstable flow in particular.
Another factor which might influence the mesoscale distribution of
pre-cipitation is the natural inhomogeneity in the humidity field. Austin's and Houze's
- 32
-area is about twice that in the region outside the mesoscale -area. If a 2 - 3 km
layer of air in an otherwise saturated air mass is too dry to become saturated
ex-cept in certain mesoscale areas, it is possible that the rainfall rate resulting from
a given amount of vertical motion in a broad area will be twice as great in the
meso-scale moist regions than in the rest of the area outside the mesomeso-scale regions. To
investigate this possibility, 168 soundings taken at hourly intervals at Bedford, Mass.,
were used to construct a time cross section of the relative humidity field. (These
data are published by Court and Salmela, 1961.) The period of observation included
four rainy and cloudy spells alternating with relatively dry periods. One moist and
one dry period are shown in Figure 9. During all of the wet periods, the depth of
the moist layer varied by 1 to 3 km in a regular pattern with maximum depths appear
-ing at intervals of approximately 3 hr. This suggests that some areas of mesoscale
dimension were becoming saturated more quickly than others during the rainy periods.
Whether this is due to moisture inhomogeneity is not clear; however, one reason to
suspect that it is not is that during the dry periods similar regular fluctuations in
humidity were not observed.
The horizontal variation of temperature is not important in
determin-ing mesoscale precipitation patterns. It can easily be verified that doubldetermin-ing the
rainfall rate in an atmosphere with a moist adiabatic lapse rate and a parabolic
ver-tical velocity profile between 0 and 10 km requires an increase in the 1000 mb
tem-perature of about 100 C. Thus, to account for the factor of two differences between
- 33
-require horizontal temperature variations of 100 C on this scale. Synoptic
experi-ence clearly denies the existexperi-ence of variations of this sort.
It might be suggested that horizontal variations in the concentration
of natural ice nuclei lead to variations in the areal distribution of precipitation
inten-sity. However, some computations by Houghton (1968) suggest that this is highly
unlikely. He indicates that while spatial variations in nuclei concentration may affect
the time of onset of precipitation, they are not likely to affect the instantaneous
rain-fall rate within an established stratiform rain situation. The concentration of ice
nuclei which are activated tends to increase exponentially with decreasing
tempera-ture; as a result, the effect of variations in the nucleus concentration at a particular
height is to raise' or lower, by not more than about + 1 km, the level at which
suf-ficient precipitation particles are formed in order to initiate the precipitation process.
The concentration of ice crystals formed is usually sufficient to remove all the
con-densate in the form of liquid water; therefore, within a well-established storm
sys-tem the horizontal distribution of natural ice nuclei should not be reflected in the
in-stantaneous precipitation patterns. Since many mesoscale precipitation areas are
observed well within the interior of established synoptic-scale precipitation areas, it
seems that the horizontal variation of ice nuclei concentration is probably not the
factor determining their existence.
Of the considerations concerning the origin of mesoscale precipitation,
the one offered by Austin and Houze (1972) is the only one which requires the
pre-sence of cumulus cells within mesoscale areas. All of the others suggest a means for
enhancing the rainfall rate in a mesoscale region that would work just as well without
- 34
-cells present. Yet mesoscale areas always contain some degree of cumulus
ac-tivity, and it is hard to believe that this is a coincidence. Therefore, the postulate
of a cellular origin for at least part of the mesoscale precipitation, namely that in
the small mesoscale areas, seems most attractive. The plausibility of this
hypothe-sis makes it an important consideration in the calculations of cumulus transports as
described in the following chapters of this thesis. In these calculations, the total
amount of water condensed within cumulus updrafts is estimated from measured
pre-cipitation amounts. According to the hypothesis of Austin and Houze, a fraction of
the total mesoscale precipitation should be considered part of the cellular
condensa-tion. As a consequence, it becomes necessary to measure both the cellular and mesoscale components of the total precipitation deposited by a storm if the processes within it are to be modelled realistically. However, since Austin's and Houze's
hy-pothesis has not been proved conclusively, and since it probably does not apply to
the large mesoscale areas, an uncertainty concerning the amount of total mesoscale
precipitation which can be considered of cellular origin is taken into account in the
calculation of cumulus transports of physical quantities in the following chapters.
A better understanding of the origin of mesoscale precipitation might
be obtained if the dynamics of atmospheric disturbances associated with the
meso-scale precipitation areas were understood. The possible role of "conditional
insta-bility of the second kind (CISK)" (Charney and Eliassen, 1964) in the development of
mesoscale areas was investigated. This study was inconclusive; however, it is described in Appendix D.
--- 35
-D. Outcome of descriptive studies; empirical basis for modelling
From the extensive study of precipitation patterns, it has been
de-termined that certain characteristics occur consistently in all types of storms while
others vary considerably from storm to storm. In the horizontal, it has been found
that four distinct scales of precipitation areas occur; synoptic areas which are larger
than 104 m2 and have a lifetime of one or several days; large mesoscale areas which
range from 103 to 104 km2 and last several hours; small mesoscale areas which
cover 100 - 400 km2 and last about an hour; and cells which are roughly 10 km2 and
often last only a few minutes, rarely as long as half an hour. In the cases which
were analyzed not every storm contained areas of all of these scales; however, when
an area of any particular scale occurred, it contained areas of each of the smaller
scales, one within the other. The vertical location and depth of the layer containing
cumulus cells varied greatly from one storm to another, but remained about the
same within any particular storm.
The consistent occurrence of precipitation patterns with similar
char-acteristics and behavior in a variety of storms makes it possible to describe any
storm in a parameterized manner which retains the storm's basic features while
eliminating much cumbersome detail. Moreover, as discussed in the next chapter,
the parameters used to describe the storm may be chosen so that other physical
properties of the storm may be computed from them. In this way small-scale
phe-nomena within a storm may be investigated without having to observe temperature,
- 36
-The model storm described in the next chapter is designed specifically
to calculate vertical transports of physical quantities by cumulus updrafts given
cer-tain observed parameters of the storm. A crucial aspect of this particular modelling
is that an estimate of the total condensation within cumulus updrafts can be obtained
from measurements of surface precipitation. With an approximate knowledge of the
storm's vertical structure and the general synoptic-scale distribution of other
vari-ables, an estimate can be made of the mass of air that had to rise through various
levels in cells to produce the total cellular condensation. The important observed
parameter would appear to be the cellular precipitation. However, the consistent
occurrence of cells within mesoscale areas and the plausibility that part of the
meso-scale precipitation is of cellular origin make it necessary to consider both the
cellu-lar and mesoscale precipitation in estimating cellucellu-lar condensation.
A realistic storm model could also be useful for studying the
precipi-tatioin mechanisms in areas of the various scales. A model for this purpose, however,
would be more complex and detailed than the one developed in the next chapter for
computing cumulus transports. It is hoped that experience with the present model
CHAPTER III
MODEL STORM
A model storm designed to calculate the vertical transports of physi-cal qlantities by cumulus cells is described in this chapter. The model is based
both on the observational experience related in Chapter II and on current dynamical
and empirical knowledge of cumulus convection. For input it requires detailed
mea-surements of precipitation but only the general synoptic-scale distributions of other
variables. The application of this model in a climatological study of the vertical
transports of sensible heat and angular momentum by cumulus convection is discussed
in Chapter IV.
A. General description of model
The model storm is conceived of as a region of precipitation composed
of cumulus cells, mesoscale areas, and synoptic areas, one within the other.
Des-criptive studies show that precipitation patterns are typically composed of areas of
these various scales regardless of the season, synoptic situation, or geographical
area. The vertical distribution of properties and processes within each of the basic
areas are also represented in an idealized manner for the model storm. In
particu-lar, transport processes associated with cumulus-scale convection within a storm
are simulated. It is noted that the condensation which precedes the fallout of a
cer-tain amount of precipitation in a storm necessarily is accompanied by the transport
of air upward through various levels of the atmosphere. Any part of the rising air
that is contained within cumulus updrafts has temperatures and horizontal velocities
-- 38
-which are systematically different from those in the larger-scale environment at
each level. Depending on the signs of these differences, then, either more or less
sensible heat and angular momentum is transported upward by the ascending air at
each level in the storm than if there were no cells and all of the air rose with the
tem-perature and horizontal momentum of the larger-scale atmosphere.
Equations for computing the excess transports of sensible heat and
angular momentum due to air rising in cumulus updrafts within the model storm are
developed in subsequent sections of this chapter. Quantities assumed to be given in
these equations are obtained by observing certain properties of the atmosphere
dur-ing an actual rainfall situation. The primary measured quantity is precipitation.
Measurement of rainfall in an actual storm could be made either with areal detail at
given instants, as with a radar, or for a period of time at a point with a
high-resolu-tion rain gauge. The latter method is used in this investigahigh-resolu-tion and the term storm
as used throughout this chapter refers to a continuous period of rainfall at a -station.
The model can be envisioned in terms of a time-vertical cross section as shown in
Figure 10. The quantities in the figure that are inferred from atmospheric
observa-tions as input for more detailed model calculaobserva-tions are:
Rc = amount of cellular precipitation
Rm= amount of mesoscale precipitation
Rs = amount of synoptic precipitation
Tc
=
temperature in cells- 39
-qo = water vapor mixing ratio outside storm u' = westerly wind speed outside cells
zT = height of cell tops
zB = height of cell base
zy = depth of layer of lighter rain in mesoscale and synoptic areas surrounding cells.
The exact methods by which the above quantities are derived from the data are dis-cussed more precisely in section H of this chapter, however, some general comments about each are made here.
Of the measured quantities, only the precipitation amounts, Rc, Rm, and Rs, are derived from observations which must be available continuously during the passage of the actual storm being modelled. The rain gauge must also have suf-ficient resolution to detect showers associated with cumulus-scale cells. Criteria to determine when cells, mesoscale areas, and synoptic areas are over the gauge are based on typical relative magnitudes of rainfall rates in the areas of different scales and their typical durations over the gauge. The criteria used are consistent with the observational experience described in Chapter II. No distinction is made in
the present model between large and small mesoscale areas. Experience in analyz-ing precipitation patterns has shown that this differentiation can be made in a parti-cular storm only by detailed study of a sequence of two-dimensional horizontal pre-cipitation patterns, such as given by a radar PPI. However, such detailed analysis would preclude treatment of a sufficient number of storms for a climatological study,
- 40
-Also recorded with the precipitation amounts are the total times
t
tc, A tm, and A ts that cells, mesoscale areas, and synoptic areas are overthe rain gauge. These time periods do not play a major role in the computations of
transports; they are involved only in minor and indirect roles. The basic
precipita-tion parameters for the model calculaprecipita-tions are amounts, not rates.
Of particular interest for the modelling is how much of the total
pre-cipitation is condensed within cumulus updrafts. Austin and Houze (1972) point out
that part of the mesoscale precipitation may in fact originate within the cumulus-scale
cells. This possibility is taken into account in the model by introducing the parameter
o( which is shown in Figure 10 and is the fraction of mesoscale precipitation assumed
to have been condensed in cells. In the model computations, o( is assigned values
ranging from zero to one since the question of how much mesoscale rain comes from
the cells is not yet resolved. Although all the possible values of <o are considered,
values close to unity are probably unrealistically large in most cases since the
hypo-thesis of a cellular origin for mesoscale rainfall refers only to the small mesoscale
areas, while the precipitation to which o( is applied is the total, small plus large,
mesoscale amount.
The quantities Tc, qc' qo, and u' which are functions of height are
in-ferred from rawinsonde observations made at standard 12 hr intervals in and around
the actual storm being modelled. The temperature Tc in the cells is assumed to
follow a moist adiabat which approximates the vertical distribution of temperature
shown by soundings of the real storm. The measured temperatures of the large-scale
41.
-cells since -cells and environment never differ by more than about 20 C and the
quan-tity which is sought for the calculation of transports is an estimate of the difference
between the temperature of the cells and that of their immediate environment. The
temperature of the latter is represented by the symbol T' in Figure 10 and is
compu-ted as a deviation from Tc by means of equations expressing the dynamics,
conden-sation processes, and entrainment in the cumulus updrafts. Since the quantity needed
for the heat transport calculations is the difference Tc - T', it is immaterial which
of Tc and T' is considered given and which computed in the model calculations. The
equations were found to be slightly easier to program with Tc being given; hence T'
is the computed quantity in this investigation..
In any region of the model where precipitation occurs, the air is
as-sumed to be saturated. Thus in the cells, qc is the saturation mixing ratio
corres-ponding to the moist-adiabatic temperature distribution T . In the mesoscale areas
and synoptic areas q' is the saturation mixing ratio corresponding to the temperature
distribution T'. The mixing ratio qgo of water vapor outside the storm, is
approxima-ted by multiplying the relative humidity function indicaapproxima-ted in Figure 10 times the
saturation mixing ratio q'. The two-layer relative humidity distribution shown in
the figure is an approximation to the distribution of humidity shown by the soundings
taken immediately outside the real storm. The symbol Hi represents the mean
rela-tive humidity in lower layers while H2 is the mean relative humidity aloft. The level
separating the regions to which H1 and H2 refer is allowed to vary from storm to
storm as are the magnitudes of H1 and H2 . In Figure 10, the mixing ratio in the