HAL Id: insu-00877516
https://hal-insu.archives-ouvertes.fr/insu-00877516
Submitted on 28 Oct 2013
HAL is a multi-disciplinary open access archive for the deposit and dissemination of sci-entific research documents, whether they are pub-lished or not. The documents may come from teaching and research institutions in France or abroad, or from public or private research centers.
L’archive ouverte pluridisciplinaire HAL, est destinée au dépôt et à la diffusion de documents scientifiques de niveau recherche, publiés ou non, émanant des établissements d’enseignement et de recherche français ou étrangers, des laboratoires publics ou privés.
Thermodynamic properties of interfacial water from its
infrared signatures
Isabelle Bergonzi, Lionel Mercury, Frédéric Jamme
To cite this version:
Isabelle Bergonzi, Lionel Mercury, Frédéric Jamme. Thermodynamic properties of interfacial water from its infrared signatures. 16th International Conference on the Properties of Water and Steam, Sep 2013, Londres, United Kingdom. 8 p. �insu-00877516�
1
Thermodynamic properties of interfacial
water from its infrared signatures
I.Bergonzi1, L. Mercury1, F. Jamme2, 3
1 Institut des sciences de la Terre d’Orléans, UMR 7327 Université d’Orléans/ CNRS/ BRGM, 1A rue de la Férollerie, 45071 Orléans, France
2 Synchrotron SOLEIL, L’Orme des Merisiers, Saint-Aubin, BP 489 1192 Gif-sur-Yvette, France
3 INRA, U1008 CEPIA, Rue de la Géraudière, F-44316 Nantes, France
ABSTRACT
Water liquid trapped in quartz micro-cavities is probed by infrared micro-spectroscopy to explore the influence of the solid/liquid and liquid/air interfaces on water thermodynamics. The sample is infraredly mapped with a 3x3 µm micro-beam allowed by the brilliance of synchrotron radiation source (SOLEIL, SMIS beamline) at 2.5 µm xy interval. It appears that the intramolecular OH-stretching band is changing as a function of its proximity to the interfaces. To refine these variations, the band is decomposed into Gaussian components, evidencing that water is interface-printed even at micrometric distance to the wall and/or to the bubble with the closest layer to the interface marked by a dangling-OH effect. Then, these vibrational changes are converted into Gibbs free energy, which range from 35 J.mol-1 4.5 µm away from the interface, to 1 kJ.mol-1 at about 1 µm.
1 INTRODUCTION
Water-rock interactions take place at the very contact between the two (or more) phases in action. It is usually admitted that the thickness over which liquid and solid enter the interfacial domain, wherein neither are completely bulk, is around 10-15 nm [e.g., 1]. This justifies the intensity of researches about high resolution measurements of solids surfaces at nanometric scale. Using water-silica simple system, we performed infrared measurements of the OH-stretching band (water fingerprint) as a function of the distance to the solid-liquid and liquid-air interfaces, using the micro-beam (3x3 µm) in dual confocal mode available at synchrotron SOLEIL (SMIS beamline). By means of a modified partition function [2, 3], the recorded water spectra were transformed into Gibbs free energies averaged over the experimental thickness. This transformation allows us to discuss the IR measurements in terms of mean field effects at macroscopic scale.
2 MATERIALS AND METHOD
The Synthetic Fluid Inclusions (SFIs) are micro-cavities in solid (here, quartz) hosting an occluded liquid (here, pure water) coexisting in general with a bubble of saturated
2
vapor. They are hand-made by hydrothermal synthesis in internally-heated pressure vessels (for more details on the making of SFI [4, 5]). The selected inclusion (Fig. 1) is about 100 µm x 10µm in size.
Figure 1 Photograph of the sampled SFI (left), and locations of the measurements: the red points represents the location of each recorded spectrum, and the red cross indicates the width-line
treated in in this paper.
The IR experiments were performed at SOLEIL Synchrotron (Gif sur Yvette, France) at the SMIS beamline. It is equipped with a Continuum microscope coupled to a Nicolet 5700 FT-IR spectrometer (Thermo Fisher Scientific, USA). The microscope comprises a liquid nitrogen cooled mercury cadmium telluride (MCT-A) detector (50 mm) with a 32X infinity corrected Schwarzschild objective (NA = 0.65) and a matching 32X condenser. We use a double path single masking aperture size of 3x3 µm which allows us to work in dual confocal mode [6].
The inclusion is infraredly mapped with a step size of 2.5 µm. Each spectrum is recorded in the 2500-4500cm-1 spectral region, with a resolution of 8 cm-1 with 200 scans per spectrum and no mathematical correction. Here, the infrared coefficient absorption is defined by , where I0 is the transmitted intensity of the quartz
and I the transmitted intensity of quartz and its liquid-filled inclusion.
3 RESULTS AND DISCUSSION
3.1 The OH stretching Band
The OH stretching band is a sensitive probe of the hydrogen bonds (H-bonds) between water molecules, despite it corresponds to intra-molecular motions in the water molecules crossed by the IR beam, because the absorption depends on the inter-molecular connections of the probed molecules. Actually the band wavenumber increases with the distance between the oxygen atoms of two water molecules linked by one H-bond. So, this is a molecular signal averaged over a macroscopic amount of matter. The width of the band features the energetic distribution of H-bonds along the beam pathway and then it depends on the molecular arrangement statistically present in the probed liquid. One arrangement expresses an average number of close neighbors (coordination number) associated with a mean H-bonds strength.
3
Figure 2: IR map of the sampled inclusion. The colour relates to the absorbance scale, taken (left) at the main peak of the OH-stretching band: 3400 cm-1 [7]; (right) at the dangling-OH band: 3680
cm-1 [10].
Here, we present some preliminary IR results obtained in a SFI. A first approach of the global signal can be made by mapping the maximum absorbance of the OH stretching band in the sample at 3400 cm-1([7]; Fig. 2). The resultant map demonstrates that the OH stretching band is strongly modified as a function of the beam location in the inclusion as previously reported in [5]. Indeed, water located at the centre of the inclusion appears bulk-like whereas the bands taken at the interfaces are notably enriched in low frequencies. The solid-liquid and liquid-air interfaces display (Fig. 2) the same enrichment, meaning that the mean molecular arrangement along them is quite similar. The quality of the confocal mode and the thinness of the micro-beam are also clearly evidenced looking at the sides of the bubble, where the absorbance drastically decreases, in agreement to what can be expected for a bubble in direct contact with the wall.
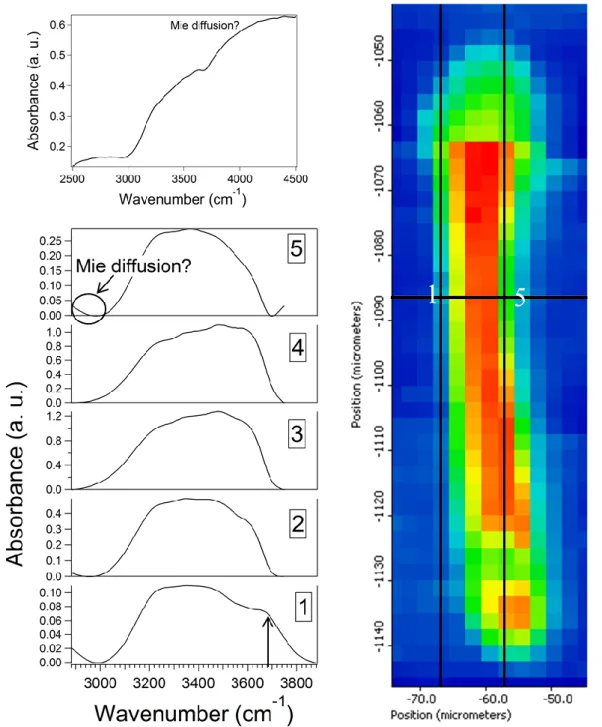
The geography of the spectral differences can be more precisely illustrated by reporting the spectra taken along a width-line (Fig. 3). The displayed spectra are smoothed with Omnic software (Thermo Fisher Scientific, USA) and their baselines corrected with Matlab software through an asymmetric truncated quadratic cost function with a polynomial order of one. As a whole, the OH stretching band is strongly modified by the distance to the interfaces in terms of shape, absorbance, and main peak location (Fig. 3). Actually, the general shape and the baseline correction of the spectrum 5 recorded close to the right interface is more complex than for the other spectra, due to a large undulation of the baseline (Fig. 3, upper left). We attribute this perturbation to a Mie diffusion effect, most probably due to the size and the shape of the interface: it should be more or less spherical and in the same magnitude than the probed wavelengths.
Position
(µm) Absorbance
4
Figure 3: Lower left: Baseline-corrected spectra of water (see text). The numbers relate to the location of each spectrum on the map (Right), along the width highlighted in white, numbered from left to right between the two black lines. Upper left: Shape of the raw spectrum taken at the rightest
location, showing the (probable) influence of Mie diffusion.
Indeed, the absorbance decreases with the distance to the interface while the main peak is shifted toward the lower frequencies. This red-shift is also observed in the case of confined water [8, 9] and indicates a better coordination and stronger H-bonds in the liquid on average. The OH stretching band recorded close to the interface (spectrum 1) presents a full width at half maximum about 10% larger than the other. Moreover, this band exhibits a strong shoulder at 3648 cm-1 looking like the SFG spectra taken on water-fused quartz interface at high pH [10]. This shape is classically interpreted as the mark of polar-oriented molecular layers due to the negative charge of quartz surface at high pH. Nevertheless, this effect requires a pH close to 12 or 13, not consistent with our quartz-pure water SFI, and is supposed to propagate no more than 3-5 molecular
5
layers, that makes its recording by transmission spectroscopy with 3 µm beam hardly convincing. It is why we interpret this shoulder as a convolution in the OH-stretching band of the classic water band with one band originating for dangling OH (3680 cm-1; [10]) of the OH silanols that develop on quartz surface at near-neutral pH (the most reasonable assumption for our SFI). The dangling OH bonds are generally assumed to be eliminated by hydrophilic interaction between water and fused quartz at the interface [10]. Our proposition is that the crystalline quartz, especially after having put at hydrothermal conditions during the inclusions fabrication process (6 kbar, 450°C, 6 weeks), has a more hydrophobic surface than any fused silica that is non-crystalline material. That means the quartz surface be composed of siloxane and silanol groups in such mutual densities that a sufficient hydrophobicity arises to prevent the dangling OH contribution from disappearing. In this point of view, it is important to note that the dangling-OH mode is considered to originate from both water and silanol groups as a pure surface contribution and should be discarded before processing the macroscopic thermodynamics calculations of liquid water.
On another point of view, this reasoning helps to understand why the solid-liquid and liquid-air interfaces display a similar trend. It is largely documented (e.g. [10,12] that the liquid surface is hydrophobic with a surface layer of dangling OH that makes recording the 3700 cm-1 band quite expectable though unusual with transmission spectroscopy.
To go further in the analysis, the OH stretching band is decomposed into Gaussian components, each embodying a statistical average over the probed liquid of a mean configuration (coordination number, band strength). Actually, the vibrational mode causing the stretching motion of the intra-molecular OH-bond is sensitive to the strength of H-bonding between molecules. The oscillator strength of the water molecule decrease when its local coordination number increases and the corresponding OH frequency is downshifted. Hence, each Gaussian component is supposed to describe water molecule with a given coordination number. The low frequency Gaussian is associated to the fully coordinated water molecules, called Network Water (NW) also known as ice-like water since the Gaussian peak is close to the ice’s (3250 cm-1). The high-frequency Gaussian is ascribed to the molecules with a low coordination number, called Multimer water (MW) and close to the IR characteristics of vapor molecules. The Gaussian lying in-between has a coordination number close to three, is called Intermediate water. The experimental bands were free fitted with the software Igor 6.2 and its Multipeak fitting 2.0 package. Molecular fraction of a population is given by the ratio between the area of the Gaussian associated to the water population and the total area of the three Gaussians. For the spectrum 5, a fourth Gaussian component was added attributed to surface dangling OH, free-fittedas the others, that results in a main peak located at 3681 cm-1 in good agreement with literature data, that range from 3680 cm-1 [10] to 3697 cm-1 [11] or 3700 cm-1 [12]. But this last sub-band is assumed to include both silanol- and water OH and so is considered as a pure surface contribution, present or absent but constant.
Clearly, the three components are red-shifted toward the interface (Fig. 4, inset), meaning that their mean vibrational energy decreases when coming closer to the interface, and that the interface reinforces the average strength of the H-bonds. Drawing the molecular fraction of the different populations with (Fig. 4) surprisingly shows that the liquid does not behave as a bulk whatever the location, at odds with expectations and first look to the map (Fig. 2). At each location, IW is the dominant population while the bulk is usually dominated by NW (Fig. 4). NW increases with the distance to the
6
interface, while IW decreases (anti-correlation) and MW does not changes much. In term of metrics, the effect of the interface is significant everywhere in the inclusion, despite it is pretty large (10-12 µm), more or less compatible in size with of the porous space in aquifers or soils. If we take the dangling-marked band to localize the solid-liquid boundary, it appears (Fig. 3) that a sort of layering develops: the first layer is dangling signed and the following ones are “only” enriched (as a function of the distance, again) in the 3600 cm-1 component.
Figure 4 Fraction of each water populations in function of the location on the map. The dotted line displays the bulk liquid values taken at the same temperature [3]. The inset shows the position of
each Gaussian component as a function of the location in the map.
The visual observations of the OH stretching and its decomposition evidence that the two solid/liquid interfaces here analyzed influences strongly the vibrational energy of trapped water under a distance larger than the expected distance of interfacial effect (some nm). To account for such long range effect, it seems reasonable to argue from two recent propositions that should complementary act in micro-cavities. First, the presence of an excess proton has been shown to create a characteristic morphology in the hydrogen bond network architecture of more than 100 surrounding water molecules [11]. And, very recently, density functional theory calculations argued that the angular correlation function (ACF) of liquid water exhibits long-range oscillatory decay extending up to tens of molecular diameters [13]. These two studies give interesting insights to long range effects in water, even if the distance here put in evidence is still larger. Another contribution could be due to dissolved silica, forcibly present in our inclusions due to the hydrothermal synthesis conditions: according to experiments [15], our SiO2° content may be roughly estimated at about 0.1 mol/kgw. And the key point is
that dissolved silica is well-known to polymerize in solution and is a good candidate to induce cooperative properties in liquid water (see the polywater saga, [14]).
3.2 Thermodynamic conversion
The IR spectra were converted into Gibbs free energy by means of a vibrational partition function originally developed by Griffith and Scheraga [2] and modified by Bergonzi and Mercury [3]. This partition function was calibrated with the well-known
7
bulk water data/properties as a function of temperature and takes into account the frequencies of both the intermolecular modes (connectivity and libration bands) and intramolecular modes (stretching and bending bands). In this study, only the stretching band is available with the present setup and so all the other bands are (roughly, of course) assumed to be constant and equal to the bulk’s whatever the location in the inclusion. As a result, our calculation cannot pretend to give the exact value of
∆GINTERFACIAL WATER and should be considered as underestimated values. The Gibbs free
energy (Fig. 5) increases with the proximity of the interface, in a non-symmetric pathway along the width-line due to the very high resolution of the IR beam: depending on its exact location with rapport to the cavity wall, the spectrum involves more or less the enrichment in the 3600 cm-1 component related with the “dangling layer”. As outlined, the IR spectra used for thermodynamic calculations were not considering the dangling-OH band when existing: only the three water bands were processed in the partition function.
Figure 5: Gibbs free energy as a function of the location in the map (same location than in Fig. 3). The dotted line displays the bulk value [16].
In thermodynamic terms, and in agreement with the initial look at the interface, bulk values are almost retrieved at the center of the inclusion: water at #3 is only 35 J.mol-1 away from the bulk, despite its molecular fractions of NW and IW are still far away the bulk’s. The scope over which the interface imprints the liquid is then around 5 µm (approximate distance of #3 with respect to the two interfaces). It is quite noticeable that thermodynamic variation ranges from 300 J.mol-1 (#2, about 1.8 µm to the interface) to 1 kJ.mol-1 (#5, about 0.8 µm to the interface), that features a pretty strong interfacial effect.
4 CONCLUSION
The first evidence obtained through this study is that water occluded in a micrometric cavity in quartz is not bulk water in the sense of its intermolecular arrangement, but also in terms of macroscopic thermodynamics. Actually, this study confirms prior
8
observations [5], and introduces the idea that the water-solid wetting properties are key to manage the intensity and the scope of interfacial effects. It also appears that the liquid-air interface is identically marked making the distinction between the two quite impossible at first sight, despite reverse prior conclusions with SFI [5]. Beyond this, we are able to evaluate the extent of the interfacial effect at about 5 µm, meaning some long range effect(s) is(are) able to propagate the interfacial features very far away from the wall, over much larger distance than commonly admitted and measured up to now. The main interfacial signature, for both water-solid and liquid-air interfaces, is the OH-dangling band well-marked close to the interface and disrupting the bulk arrangement by propagation (ACF), certainly involving as well dissolved intermediates as protons or silicic acid.
Acknowledgements
This work has received financial support from the French Agency for Research (Agence Nationale de la Recherche), grant CONGE-BLAN10-61001, and from Region centre, grant 201100070577 SIRE. It also benefited from the beamtime allocation n°20130094 from SOLEIL synchrotron. The authors thanks K. Shmulovich (Institute of Experimental Mineralogy, Russia) who synthetized the sample used throughout this study.
REFERENCE LIST
[1] Hellmann R., Penisson J.-M., Hervig R.L., Thomassin J.-H., and Abrioux M.-F. Phys. Chem. Minerals. 2003, 30, 192–197.
[2] Griffith J.H. and Scheraga H.A. J. Mol. Struct. (Theochem), 2004, 682, 93-113. [3] Bergonzi I. and Mercury L. Phys. Chem. Chem. Phys., submitted.
[4] Shmulovich K.I., Mercury L., Thiéry R., Ramboz C., and El Mekki M. Geochim. Cosmochim. Acta. 2009, 73, 2457-2470.
[5]Mercury L., Jamme F., and P. Dumas. Phys. Chem. Chem. Phys. 2012, 14, 2864-2874.
[6] Jamme F., Lagarde B., Giuliani A., Garcia G.A., and L. Mercury. J. Phys.: Conf. Ser. 2013, 425, 142002.
[7] Maréchal Y. The hydrogen bond and the water molecule, Elsevier, 2007.
[8] Richard T., Mercury L., Poulet F. and d’Hendecourt L. J Colloid Interf. Sci. 2006, 304, 125-136.
[9] Le Caër S., Pin S., Esnouf S., Raffy Q., Renault J.P., Brubach J.B., Greff G. and Roy P. Phys. Chem. Chem. Phys. 2011, 13, 17658-17666.
[10] Miranda P.B. and Shen Y.R. J. Phys. Chem. B 1999, 103, 3292-3307.
[11] Mizuse K., Fujii A., and Mikami N. J.Chem. Phys. 2007, 126, 231101, 4 pages. [12] Benjamin I. Phys. Rev. Letters 1994, 73(15), 2083-2086.
[13] Liu Y. and Wu J. J. Chem. Phys. 2013, 139, 041103, 4 pages. [14] Franks F. Polywater, MIT press, 1981.
[15] Shmulovich K.I., Yardley B.W.D., and Graham C.M. (2006) Geofluids 6, 154-167. [16] Wagner W. and Pruss A. J. Phys. Chem. Ref. Data 2002, 31(2), 387–535.

![Figure 2: IR map of the sampled inclusion. The colour relates to the absorbance scale, taken (left) at the main peak of the OH-stretching band: 3400 cm -1 [7]; (right) at the dangling-OH band: 3680](https://thumb-eu.123doks.com/thumbv2/123doknet/14744335.577642/4.892.110.771.92.447/figure-sampled-inclusion-colour-relates-absorbance-stretching-dangling.webp)
![Figure 4 Fraction of each water populations in function of the location on the map. The dotted line displays the bulk liquid values taken at the same temperature [3]](https://thumb-eu.123doks.com/thumbv2/123doknet/14744335.577642/7.892.130.739.243.596/figure-fraction-populations-function-location-dotted-displays-temperature.webp)

