HAL Id: jpa-00246663
https://hal.archives-ouvertes.fr/jpa-00246663
Submitted on 1 Jan 1992
HAL is a multi-disciplinary open access
archive for the deposit and dissemination of
sci-entific research documents, whether they are
pub-lished or not. The documents may come from
teaching and research institutions in France or
abroad, or from public or private research centers.
L’archive ouverte pluridisciplinaire HAL, est
destinée au dépôt et à la diffusion de documents
scientifiques de niveau recherche, publiés ou non,
émanant des établissements d’enseignement et de
recherche français ou étrangers, des laboratoires
publics ou privés.
The electronic and magnetic properties of Fe3N
Samir F. Matar, Bruno Siberchicot, M. Pénicaud, Gérard Demazeau
To cite this version:
Samir F. Matar, Bruno Siberchicot, M. Pénicaud, Gérard Demazeau.
The electronic and
mag-netic properties of Fe3N. Journal de Physique I, EDP Sciences, 1992, 2 (9), pp.1819-1831.
�10.1051/jp1:1992248�. �jpa-00246663�
Classification
Physics Abstracts 71.20
The
electronic
and
magnetic
properties
of
Fe~N
S. Matar
(~.~. *),
B. Siberchicot(2),
M. P6nicaud(2)
and G. Demazeau(3)
(1) Technische Hochschule Darmstadt, Fachbereich
Physik,
FBS, D-6l00Darmstadt,Germany
(2) C-E-A- Centre d'Etudes de Limeil-Valenton, 94195 Villeneuve
St-Georges
Cedex, France (3) L-C-S--C-N-R-S-, Universit6 Bordeaux 1, 33405 Talence Cedex, France(Received 7 February 1992, accepted in
final
form
4 May 1992)R4sumk. Les
propri£tds
61ectroniques
etmagn6tiques
du nitrureferromagndtique
Fe3N ont 6t66tud16es par la mdthode de l'onde
sphdrique
augment6e
ASW. Les calculs ont 6t6 effectu6s dansdeux structures cristallines diff6rentes: les structures hexagonale
(exp6rimentale)
et Cu3Au(hypothdtique)
afin d'dtablir des corr61ations entre la structuremagndtique
deFe3N
et celle deses
homologues
Fe~X
(X = non-m6tal). Les r6sultats sont discut£s en connection avec desr6sultats
exp6rimentaux
(mesures d'aimantation, r6sonance Mbssbauer).Ind6pendamment
de la structure, des densit6s d'6tats dues h la liaison fer-azote sont introduites au niveau de Fermi etdevraient
jouer
un r61e dans lemagn6tisme
du nitrure.Abstract. The electronic and
magnetic
properties
of theferromagnetic
nitride Fe~N wereinvestigated
by
use of the ASW method. The calculations were done in two differentcrystal
structures : the
experimental-hexagonal
one and ahypothetical
Cu3Au-type
one- in order tocorrelate the
magnetic
structure ofFe~N
with that of itshomologues
Fe~X
(X = non-metal).Results were assessed in connection with
existing
experimental
data(magnetic
measurements,Msssbauer resonance).
Independently
of the structure, densities of states due to theiron-nitrogen
bond are introduced at Fermi level and shouldplay
a role in themagnetism
of the nitride.1. Introduction.
The
iron-nitrogen
system
has beenlargely
investigated
since thebeginning
of the century[1,
2aj.
Within this system, e-iron nitride is ahexagonal
phase
extending
over awide,
temperature
dependent
domain of existence[2b]
(Tab. Ii.
Thisphase
isgenerally
represented
by
theFe~N
stoichiometriccomposition
wherenitrogen
occupies
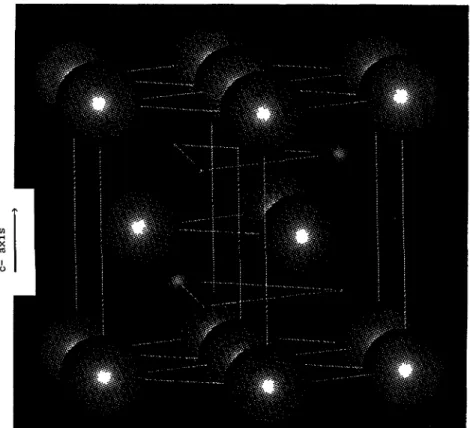
altemate octahedralinterstices in an ordered manner
(Fig.
I).
This is one reasonwhy
thisferromagnetic
nitridehas the
highest
Curiepoint
(Tc
m 567 K[3])
within theE-phase
[4].
Themagnetic
properties
of
nitrogen-excess
e-iron nitride wereinvestigated
by
neutron diffraction as well asby
bulkmagnetic
measurements[5] (Tab. I,
row6).
A lowmagnetic
moment per Fe of 1.33 ~B wasmeasured and confirmed
by
neutron diffraction results(1.5 ~B).
Discussing
the character ofthe Fe.. N
bond,
it wasargued
[5]
thatnitrogen
does not act as an electron acceptor in thematerial as it would be
expected
for an ionicpicture
of a nitride. Elsewhere[6]
M6ssbauerspectroscopy
andmagnetic
measurements ofnitrogen
deficient e-iron nitride wereinterpreted
on the
assumption
ofnitrogen
acting
as an electron donor to Fe. That wouldexplain
theregular
increase of the isomer shift and the decrease of internal field withincreasing
amountof N within the
e-phase
as statedby
Foct[4].
In an extension of Stoner-Mott-Friedel
approach
relating
alloy
magnetization
to solutevalence,
Malozemoff et al.[7]
explain
themagnetic
properties
of concentrated Fealloys
offormulation
Fe~X
(X
=
non-metal)
onthe basis of band- gap
theory for
strongferromagnetism.
Strong
ferromagnetism
refers here to systems where Fermi level(E~)
falls in a gap or lowdensity
of states(DOS)
of eithermajority
spins (spin
up :ii
orminority spins (spin
down :ii
bands. The
deeper
the gap or the lower theDOS,
the stronger theferromagnetism.
Bandstructure calculations were done in the
Cu~Au-type
structure forFe3X
except forFe~N
independently
of their real structure.In view of the
experimental
and theoreticalstudies,
itappeared
relevant to us toinvestigate
Fe3N
by
calculating
its electronic andmagnetic
properties
in its realhexagonal
structure andin the
Cu~Au-type
hypothetical
structure. For reasons of programcapacity
and structurecomplexity
only
the stoichiometricphase
3 :1 will be considered.2.
Crystal
structures.2.I HEXAGONAL
Fe~N.
Fe3N
crystallizes
in thehexagonal
system with two formula unitsper unit cell I.e.
Fe~N2.
In the earliest determinations of thecrystal
structure[I],
theP6~22
space group was
proposed
with Feoccupying
anearly h-c-p-
arrangement. In asubsequent
study
[2b],
a lesssymmetrical
space group I-e- P312 wasadopted
and used later to refineneutron diffraction spectra
[5].
Within this space group which we use in ourcalculations,
atoms are
arranged
as follows :6 iron atoms at the 61
general
positions
2
nitrogen
atoms at id and lespecial
positions
and4
unoccupied
interstitial sites at 16,lf,
la and lcspecial
positions.
It is at such sites thatexcess
nitrogen
enters uponapproaching
thehigher
limit of theE-phase
(cf.
Tab.Ii.
Hence
along
the c axis the structure can be considered as a succession of A-B-A-B I-e-Fe-(N)-Fe-(N)
layers
as shown infigure
I,
with Nacting
as a spacer in the Fe lattice. Vacant sitesaltemate with N in the B
layers. They
are filled in a random manner whennitrogen
contentincreases until half of them are
occupied.
At such acomposition
figure
I shows that 2nitrogen
atoms
along
c would be at a distance of c/2, too short to allow for thehexagonal
arrangementof the atoms to be
preserved.
Consequently,
a transformation to an orthorhombic symmetryoccurs for a
composition
corresponding
toFe~N.
A related but different structure is the
Ni~sn-type
whereFe(Ni)
andN(Sn)
would bein the same
layer
with the sequence A-B-A-Boccurring
as(Fe,
N)-(Fe,
N),
etc.It can be noted that the
hexagonal
arrangement
of atoms and interstices in thee-phase
canbe constructed from an f-c-c- lattice
using
the cubediagonal
as thehexagonal
c-axis. Thisestablishes a
relationship
between they'
phase
(derived
from the insertion ofnitrogen
withinf-c-c- Fe, with
Fe4N
general
formula)
and theE-phase
; at least fornitrogen
deficientcompositions
(ex.
Tab. I, row I and2).
2.2
Cu~Au-TYPE
STRUCTURE FORFe~N.
In the cubic cell of orderedCu~Au
adopted
forFe~N,
Fe(Cu)
is at the face-centers(
, ,
0,
etc.. whileN(Au)
occupies
cube comers at0,
Table I.
-Range
of
the e-iron nitridephase Fe~N~.
Row Value of x fb wt. N a'
= a
,fi
ala'V/f.u.
[Ref.]
(a.u.)
(a.u.)3
0.67 5.34 8.676 0.942 266.38 4 2 0.72 5.69 8.709 0.943 269.72 2b 3 0.74 5.88 8.732 0.941 271.28 2b 4 1.00 7.71 8.825 0.934 278.ll 5 1.12 8.57 8.916 0.932 286.04 2b 6 1-1? 8.90 8.949 0.929 288.29 5 7 1.24 9.38 8.978 0.928 290.79 2b 8 1.27 9.59 8.997 0.926 292.01 2b 9 1.35 10.14 9.011 0.926 293.38 2b 10 1.48 10.99 9.049 0.923 296.14 2b0,
0. Due to the differentspecies
involved,
thesimple
cubic lattice(Pm3m)
has an octahedralvoid at the cube center I-e- at
~,
~,
2 2 2
3. Method of calculation.
The electronic and
magnetic
structures ofFe~N
were calculatedusing
theaugmented
spherical
wave(ASW)
method which is a firstprinciples
method for selfconsistently
calculating
the band structure of solids[8].
The calculations are based on the localspin density
functional
theory
in whichexchange
and correlation effects are treated within the scheme ofvon Barth and Hedin
[9]
and Janak[10].
The Brillouin-zoneintegration
was carried out for asufficiently
large
number of kpoints
in the irreduciblewedge
in order to obtain reliable valuesI.e. until no further variation occurs of
magnetic
moments and total energy of thesystem. The matrix elements were constructed
using partial
waves up toi~~
+I(i~~
= 2 forFe and
i~~~
=
I for
N).
TheI
+ I terms are used for the intemal summations in thethree-center terms of the matrix elements.
Spin-polarized
calculations I.e. formagnetic
order were done in the two structures one additionalnon-spin-polarized
calculation was done in theCu~Au-type
structure. The ASW method uses the atomicsphere
approximation
(ASA)
where each atom is surrounded
by
asphere
within which thepotential
and thecharge density
are assumed to be
spherically
symmetric.
The space outside thespheres
is not accounted forbut the sum of the volumes of all the
spheres
isequal
to the volume of the unit cell.In
hexagonal Fe~N
as well as inCu3Au-type
structure the presence ofunoccupied
sites ledus to introduce empty
spheres
(ES)
I.e.pseudo-atoms
with Z =0 within the ASA. These
empty
spheres
prevent a tooimportant
overlap
of the atomicspheres
and allow for a smooth~
j
U
Fig.
I.Hexagonal
structure of Fe3Nshowing
the succession of Fe-N-Fe-N layers alongc-direction-With
decreasing
size, thespheres
correspond
to Fe, N and vacanciesrespectively.
Empty spheres
areintroduced at vacant sites.
variation of the
potential
in the interatomicregion.
They
also contain the « tails » of thespherical
wave functions and would account forpossible
covalency
effects[I11.
4. ASW calculations of
hexagonal
Fe~N.
Using
the latticeparameters
f~rstly
determined for stoichiometricFe~N
by X-ray
diffraction(Tab. I,
row4)
and those determinedby
neutron diffraction for anitrogen-excess
nitride(Tab.
I,
row6)
we have achieved two sets ofspin-polarized
calculations. The Brillouin-zoneintegration
was carried out for 80independent
k-points
on a uniform mesh in the irreduciblewedge.
The selfconsistency
cycle
was run until energy convergence better than ImRyd
wasachieved
(I
Ryd
= 13.6eV).
The obtained
partial
charges
andmagnetic
moments aregiven
in table IIa and brespectively.
4.I ELECTRON DISTRmUTION. In both sets of
calculations,
there ishardly
anycharge
transfer between
nitrogen
and iron.Nitrogen
however loses electrons toneighboring
ES.Excess
charge
on iron ariseslikely
from ahybridization
of its states with those of N and ES asit will be shown in the discussion of the densities of states
(DOS).
From table IIa and b the sand p
partial
charges
of Fe do notchange
with volume and their sum formajority spins
isTable II. -Local
partial
charges
for
spin-up
(I)
andspin-down
(I)
directionsfor Fe3N.
a)
Lattice parametersjkom
reference
[ii
: a = 8.82565 a.u. ; cla = 0.93429 ;V
= 556.225
(a.u.)3,
r(Fe)
= 2.61916 a.u. ;r(N)
=r(ES)
=
1.60882 a.u.
nsi nsi
npi
npi
ndi ndi nfi nfiM~~
Q,oi
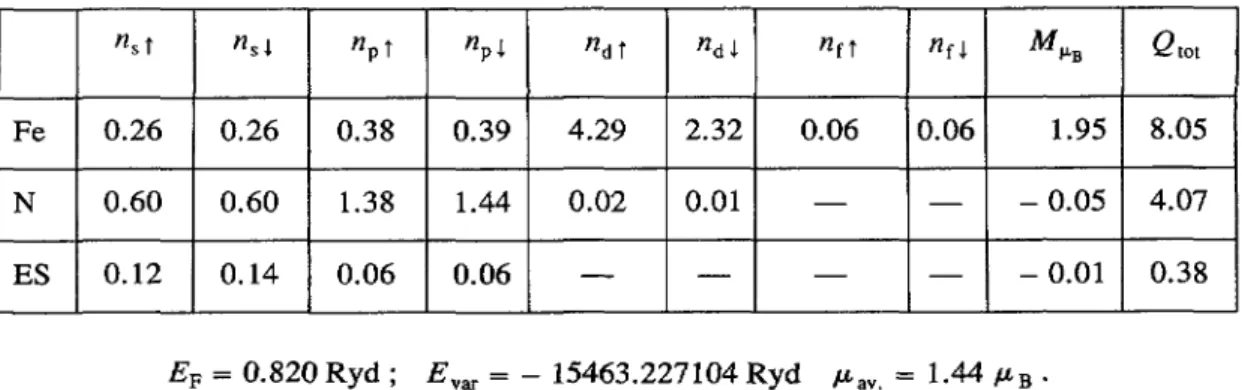
Fe 0.26 0.26 0.38 0.39 4.29 2.32 0.06 1.95 8.05
N 0.60 0.60 1.38 1.44 0.02 0.01 0.05 4.07
ES 0.12 0.14 0.06 0.06 0.01 0.38
EF
=
0.820
Ryd
E~~
= 15463.227104Ryd
p~~, = 1.44 pBb)
Lattice parametersjkom
reference
[5]
: a =8.94896 a.u. ; cla = 0.92860 ; V = 576.337
(a.u.)3,
r(Fe)
= 2.65035 a-u- ;r(N)
=r(ES)
= 1.62798 a.u.n~i n~j
n~i
n~j
ndi ndi nfi nfiM~B
Qioi
Fe 0.26 0.27 0.38 0.39 4.35 2.26 0.06 0.06 2.07 8.04
N 0.61 0.61 1.39 1.45 0.02 0.01 0.05 4.10
ES 0.12 0.14 0.06 0.06 0.01 0.38
E~
= 0.784
Ryd
;E~~
= 15463.298554Ryd
p~~, =1.54 pB
leading
to thedevelopment
of themagnetic
moment and to itschange
with volume. There is aslight
unbalance inpolarization
of the2p
states ofnitrogen
betweenmajority
(I)
andminority
(I)
spins
in favor of the latters whence thenegative
value of the moment.4.2 MAGNETIC MOMENTS. As it is
known,
themagnetic
moment arises from an unbalanceof
charge
distribution betweenI
andI
spins.
From table II it ismainly
the 3d intra-bandpolarization
whichprovides
the moment for Fe. N and EShardly
bear any moment. Thecalculated
magnetic
moments of Fe I.e. 1.95(Tab. IIa)
and 2.07~LB
(Tab.
IIb)
are close to thevalue
recently
computed
in a work we came acrossduring
thepreparation
of this paper, I.e.1.94 ~B
l12].
The value of themagnetization
averaged
over the unit cell are 1.44 and 1.54 ~L~.The difference between our two calculated moments is due to the lattice
expansion
for thelatter
calculation,
in agreement with[12].
This feature was addressedby
one of us in recentcalculations of iron rich nitride
FesN
[13].
Both values of the averagemagnetization
arehigher
than theexperimental
one of 1.33 ~B15].
Although
the latter was measured for anexpanded
lattice,
it needs to be stressed thatexperimentally
the latticeexpansion
is inducedby
excessnitrogen
whereas our calculationsmerely
simulate stoichiometricFe~N
atexperimental
lattice constant as well as in anexpanded
lattice. On another hand for the mostmeasurements
yielded
a value of 2.3 ~B for Fe moment.Consequently
twophenomena
withopposite
effects occur :ii
aslight
latticeexpansion
of an Fe lattice should lead to a moment increase[13]
but
simultaneously,
iii
increasing
amount ofnitrogen
leads to a decrease of the moment bomeby
Fe[4].
The decrease of the
magnetic
moment of Fe in the nitride islikely
to occurthroughout
amechanism of
spin
pairing
betweenN(2p)
states and Fe(3d)
ones in a similar way as withinthe cubic nitride
y'-Fe4N
[14,
and therein citedreferences].
Thispoint
will be furtheraddressed in the
analysis
of the DOS.Relationship
with othermagnetic
systems. Thenearly
constant value ofsp(I
in the twosets of calculations I.e.
n~~ +
n~,
= 0.64and 0.65
respectively
and itsproximity
to 0.6 : a valuecharacteristic of several
alloy
systems
led us toenvisage
apossible
relationship
between theaverage
magnetic
moment and the electron count forFe~N
throughout
theSlater-Pauling-Friedel
(SPF)
curve[15]
plotted
forferromagnets.
Such a curve is theplot
of p~~_ =Z~
+ 0.6where p~~_ is the average
magnetization
per atom in the unit cell andZ~
is themagnetic
valence defined as :
Z~
=2
N~
t-Z~~i_(N~t
: number of d electrons formajority
spins
I.e. 5for elements with filled
majority-spin
half-bandFe,
Co and Ni and 0 for N ;Z~~.
number of valence electrons I.e. 8 for Fe and 3 forN).
HenceZ~(Fe)
=2,
Z~(N)
= 3 and
Z~(Fe~N
)lat.
=0.75 can be
computed.
Taking
the averagemagnetization
per atom from table IIa I.e. 1.44 ~~ and theexperimental
averagemagnetization
of 1.33 ~B the(Z~,
p~~_)
points
corresponding
toFe~N
lie between Co and Ni strongferromagnets
together
with otheralloy
systems on theright
hand side of the SPF asgiven
in reference[15,
Fig.
62].
Consequently
Fe~N
can beassigned
a strongferromagnet
behavior within this framework.4.3 FIXED SPIN MOMENT CALCULATIONS. In order to check that the calculated
magnetic
moment
actually
corresponds
to a minimum of total energy,fixed
spin
moment calculationswere undertaken. Such calculations constrain total
magnetization
to a fixed value. Forsuccessive values of the
magnetization,
calculations areself-consistently
converged
yielding
the total energy for each one of them
[16].
Such calculations(done
with the lattice parametersgiven
in Tab.I,
row 6 and used for Tab.IIb),
yielded
one energy minimum for a totalmagnetization
of12.30 ~~ ; i.e. per two formula units ofFe~N
and aresulting
moment of2.07 ~L~ per Fe atom. This is in agreement with the value of the moment of Fe in table IIb.
Hence the variation of energy with
magnetization
points
to the existence of onemagnetic
state for
Fe3N
whereash-c-p--Fe
at asphere
radius of 2.66 a-u-(atomic
units,
I a.u.
= 0.529
hi
I.e. close to the value of the Fesphere
radius in our calculations(cf.
Tab.
IIb),
was shown to exhibit anon-magnetic
ground
state at low energy and amagnetic
state at a
higher
energy[17,
Fig.
2].
4.4 INTERNAL FIELDS. The contribution of the Fermi contact terms to the intemal fields
H;
are calculated from the unbalance ofspin-densities
of the s-electrons at the nucleusfollowing
therelationship
:HFC
= «TN(41(0)~
WI
(0)~)
where yN is the nuclear
gyromagnetic
ratio and@t
(0)~
and j(0)~
thecharge
densities of thes-electrons at the nucleus for the two
spin
directions. The Fermi-contact terms at Fe site are200 and 212 koe
respectively
for the calculationsgiven
in tables Ha and IIb. A measuredVELOCITY (mm/sl -i -s -5 -, -3 -z -t o t z 3 , 5 s i o ~ ~i tIm1 ~ doubiet 31 ~ a) loo.o ~ BE ~' 94.0
I
Z)
0l Cf
88.0 , _ ~ b)-9.o -3.o 3.o 9.o
Uelocit~
(mm/s)
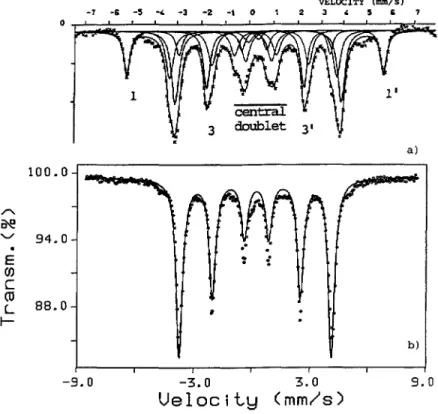
Fig.
2. Msssbauerabsorption
spectra of y'-Fe4N (al and e-Fe3N (hi.M6ssbauer measurements of the
e-phase
at anitrogen
deficientcomposition
calledE-Fe4N
[4]
allowed to determine for the twocrystallographic
sites two different intemal fields :H~
=298. I koe and
Hn
= 221.8 koe.
These two values are close to those found for
y'-Fe4N
forsimilarly
labeled sites[18]
and can be understood in view of the structuralrelationship
mentioned inparagraph2.1.
Figure2
shows the M6ssbauerspectra
ofy'-Fe4N
(al
ande-Fe3N (b,
[19]).
The spectrum of the former was deconvoluted[5]
into twosets of lines called sextets : « I & I'» and « 3 & 3'» attributed to the two Fe sites I and II
respectively
and one central doubletassigned
to very finesuperparamagnetic
particles
present
into thepowder
sample.
Thespectrum
ofFe~N (2b)
showscomparatively
only
a sextet oftype II as well as a central doublet whereas the type « I » sextets are absent
[4].
The presenceof one Fe sublattice in
Fe~N
is hence confirmed. It needs to be said that thepresent
analysis
ofthe M6ssbauer spectra is
only
qualitative
since,
forinstance,
no electric fieldgradient
effectsare accounted for ; those will be
extensively
addressed elsewhere[19].
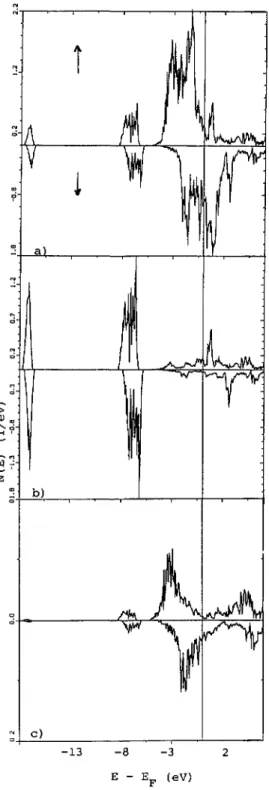
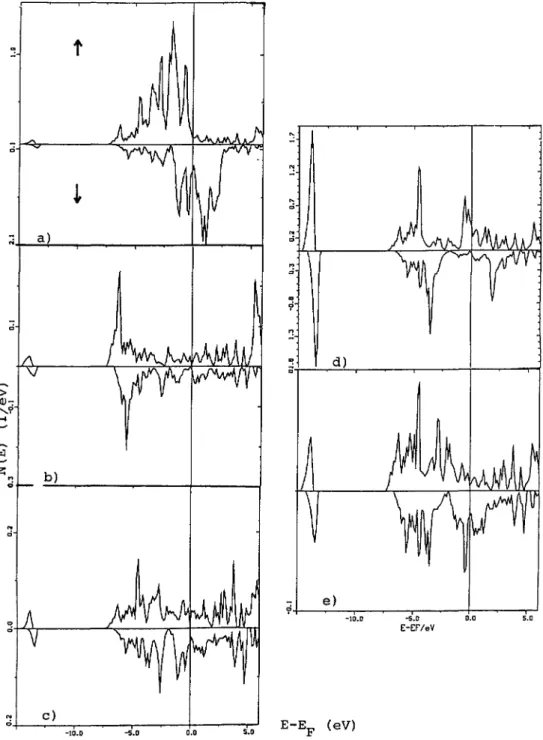
4.5 DENSITIES OF STATES
(DOS).
-The site- andspin-projected
DOS are shown infigure
3a(Fe),
b(N)
and c(ES).
They
arerepresentative
of the two sets of calculations oftable II which
yield
in similar DOS.Energies
are counted with respect toE~
at m I I eV.From left to
right
the DOS present thefollowing
features :* 2s states below 13 eV
*
2p
states in the range8,
5 eV and* 3d states in the range
5,
0 eV I.e. crossedby
E~.
1
pm
I
-13 -8 -3 2
E E~ (eV)
Fig.
3. Densities of states of Fe~Nprojected
along the twospin
directions over the 3 different sites ofthe
hexagonal
Fe~N
lattice: al Fe, b) N and cl ES.Energies
are counted with respect towith their metallic type behavior
[13,
14]
so thatthey
can be considered as itinerantferromagnets.
In the
following
we shallanalyse
the DOS at each lattice site and suggest correlationsbetween them.
The Fe DOS
(Fig.
3a)
aremainly
dominatedby
the 3d states. The shift betweenmajority
spins
andminority
spins
I.e. intra-bandpolarization,
provides
themagnetic
moment.They
present
similarities withfcc-type
d-DOS aspreviously
observed fory'-Fe4N
for iron at facecenters
[14].
Themajority spin
states constitute anearly
half-filled d-band asthey
lie belowE~
with a low DOS atE~.
This feature suggests a strongferromagnet
behavior in accordancewith the assessments of
paragraph
4.2.I. There is a strongmixing
between the states ofnitrogen
and those of Fe due to similarities between2p
and 3d DOS as what one wouldexpect
for acovalently
bondedcompound.
This interactiongives
rise to wand ar bonds(notice
the well
separated
two-fold families ofpeaks
between 7 and 8eV)
with theirantibonding
counterparts
above(isolated
two-foldpeak) E~
and atE~
(notice
the three-foldpeak
forI
spin
DOS)
respectively.
The presence of the latterpeak
structure due tonitrogen
allowed tosuggest a weak itinerant
ferromagnet
behavior forNiFe~N
[20].
The 2s and
2p
states ofnitrogen (Fig. 3b)
show a certain amount of structure due to anon-regular
environment made of Fe and ES. The formers can be considered as semi-core statesand
they play
a small role in thebonding
whereas2p
statesplay
a role in thebonding
with Feas stated above.
A « bond occurs between an iron orbital and one
N-2p
half filled orbital. The formation ofsuch a bond reduces the number of d-electrons that can
develop
amagnetic
moment at Feby
spin
pairing.
This situation is similar toy'-Fe4N
where themagnetic
moments differby
I ~Bbetween the two Fe sublattices due to one
preferential
Fe... N bond[14].
The
shape
of the ES-DOS(Fig.
3c)
gives
amajor
contribution to amixing
with the d-Festates hence
transferring
charge
into them(Tab.
II).
The
general
shape
of the DOS ofhexagonal
Fe~N
is different from those of theFe3X
compounds
calculatedby
Malozemoff et al.[7],
especially
atE~
where no gap could beobserved upon
plotting
theI-projected
DOS for Fe in eitherspin
direction. Thispoint
will befurther discussed in next section.
5. ASW calculations of
Fe~N
in theCu~Au
structure.In order to enable for
comparisons
with theFe~X
homologues
[7],
two sets of calculationswere achieved :
spin-polarized
and nonspin-polarized
calculations. The lattice constant of thecubic unit cell was derived from the volume of the
hexagonal
cell of stoichiometricFe3N
(Tab. I,
row4)
I.e. 6.52741 a.u. The two sets of calculations were doneusing equal
sphere
radii for the
respective
species
in the two calculations. The Brillouin-zoneintegration
wascarried out for 35
independent
k-points.
The results of the calculations aregiven
in table III.From table IIIa it can be seen that the intra-band
polarization
of the 3d states of Fe ishigher
I.e. more
filling
of themajority-spin
band than in thehexagonal
structure with a netresult of a
higher
moment. Hence thetendency
to a strongferromagnet
behavior could besuggested.
There is very littlecharge
transfer between Fe andN,
lower than in thehexagonal
structure
(Tabs.
IIa andb).
The sum of s and ppartial charges
of Fe(I
)
I.e. 0.65 does notchange
with respect to their total value in the former calculation in thehexagonal
structure.This seems to be a structure
independent
feature due to Fe... N interaction. The volumeeffect induced
by
the increase of thesphere
radius of Fe in the cubic cellcompared
to its valuein the
hexagonal
onesolely
affects the d states. The averagemagnetization
per atom isequal
to 2.25 ~B I.e. much
larger
than either theexperimental
orformerly
calculatedvalues,
moreover it does not fit on the SPF curve as above. For
Fe~X
(X
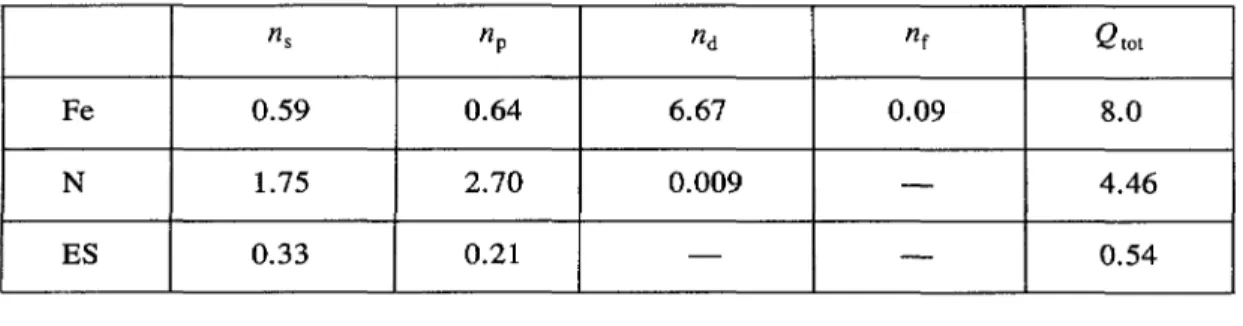
=Table III. ASW results
for
Cu3Au-type
Fe3N
(a
= 6.52741
a.u.).
al
Localpartial
charges
for
spin-up
(ii
andspin-down
(Ii
directions.~sl ~sl
~pl
~pl
~dl ~dl ~fl ~flM~~
Qiot
Fe 0.31 0.30 0.34 0.32 4.68 1.94 0.06 0.04 2.79 7.98 N 0.87 0.82 1.48 1.34 0.005 0.004 0.18 4.53 ES 0.16 0.17 0.12 0.07 0.03 0.53EF
= 0.827Ryd
;E~~
= 7731.18488Ryd
b)
Localpartial
charges for
totalspin.
~s flp fld ~f
Qtot
Fe 0.59 0.64 6.67 0.09 8.0
N 1.75 2.70 0.009 4.46
ES 0.33 0.21 0.54
E~
= 0.798
Ryd
E~~
= 7731.10653Ryd
the same
crystal
structure themagnitude
of the moment of the non metal varies from0.23 for X
= B to
0.10 for X
= Sn
[7].
This ismarkedly
opposed
tothe behavior of N
whose
large
magnetic
moment has apositive
sign.
The site and
spin-projected
DOS aregiven
infigure
4 for thespin-polarized
calculation,moreover the
I-projected
DOS at Fe are shown as well. Thegeneral shape
of the Fe-DOS isvery similar to the DOS of
Fe~B
[7].
The difference in energy between theN-2p
and Fe-3dstates is not sufficient to cause their
separation
contrary
to what it can observed between the samepartial
DOS infigure
3.Comparing
figures
3 and 4 theN-2p
and 2s DOS lie lower inenergy in
figure
3. This couldpoint
to a different ionic behaviorwhereby
Fe3N
would be« more ionic » in its real structure
(see
thelarger
charge
transfer between Fe and N inTab.
II).
On another hand themixing
between Fe and N states in theCu~Au
structure leadsto a
large
polarization
of the N states with alarge
magnetic
moment of N(0.18
~B Tab].III)
contrary to the lower moment of N in thehexagonal
structure(
0.05 ~L~. Tab.II).
Observation of the
I-projected
(Fig. 4b)
I
= 0 and
(Fig.
4c)
:I
=
I)
DOS for Feclearly
shows a gap at
E~
for themajority
spins.
The feature of the minimum DOS atE~
fors(Fe)
andp(Fe)
states was seen as well forparamagnetic
calculations ofFe~N.
Theimportant
requirement
of the «band gaptheory»
ofstrong
ferromagnetism
is thathybridization
of
the sp states with the d states results in adepression
near the Fermi levelof
thedensity of
sp states, thatis,
states thatmight
respond
to the stronger metalloid sppotential (sic
[7]J.
This condition seems to be met forFe3N
calculated in this structure.e
f
£
~ b) e) c-crlev ~~ ->o.o ~~F
~~~~Fig.
4. Densities of states (DOS) ofFejN
projected along
the twospin
dkections and along over the 3different sites of
Cu3Au-type Fe3N
lattice :al Fe, d) N ande)
ES.I-projected
DOS for Fe are shown in b)I
= 0 and cl
I
bonding
andantibonding
behavior in the same way as in thehexagonal
phase.
Within thisframework,
a noticeable feature is observed infigure
4d whereantibonding
states(ii
arising
from N sit on
E~
(mostly
ar*,
notice the three-foldpeak
structure in relation withFig.
3b).
Itneeds to be stressed that the
position
of thispeak
did notchange
with other calculations doneat
larger
lattice constants. Amajor
role seems to beplayed
by
nitrogen
by
introducing
DOS atE~
as in thehexagonal
structure.The features of the
troughs,
I.e.minima,
found atE~
forI-projected
DOS of Fe couldassimilate
Fe~N
to itsFe~X
homologues.
However further calculations ofpartial
DOS of Xthe
Fe~X
would be needed to check whether X introduces DOS atE~
in a similar way as N.Considering
the total variationalenergies
in table IIIa andb,
hypothetical
Cu3Au-type
Fe~N
would be stabilized in aspin-polwized
state. However(cf.
Tabs. II andIII)
there is anet energy stabilization for the
hexagonal
formby
0.4287 eV per formula unit withrespect
to
Cu~Au-type
one. Hence it is notlikely
to stabilizeFe~N
in such a cubic structure.6. Conclusions.
In this work the electronic and
magnetic
properties
ofFe~N
were studiedby
the ASW methodin two
crystal
structures, thehexagonal
experimental
one and ahypothetical
cubic one.Whereas lattice
expansion
should lead to a moment increase when N is introduced in h.c-p-Fe, this effect is hindered
by
thespin pairing
betweennitrogen
and iron statesleading
to areduced moment. That allows to asses the differences observed between
experimental
resultsand our calculations for the
magnetic
moment.In connection with the
relationship
between averagemagnetization
and electron count,Fe~N
wasassigned
a strongferromagnet
behavior.The calculations have shown that
independtly
of the structure :the N-Fe interaction
keeps
the s and p electron count of Fe constant for themajority
states
and,
nitrogen
islikely
toplay
a role in themagnetic
behavior of the nitrideby
introducing
states at
E~.
Acknowledgments.
One of us S.M. thanks the Alexander von Humboldt foundation for a
grant
in the Fed.Rep.
ofGermany.
Fruitful discussions with Dr. J. Sticht of the TechnicalUniversity
of Darmstadt(Germany)
areacknowledged.
References
[Ii HENDRICKS B. and KOSTING R., Z.
Krystallogr.
74(1930)
5 II.[2] al JACK K. H., Proc. Roy. Sac. A 208
(1951)
200-216b) JACK K. H., Acta Cryst. 5 (1951) 401.
[3] BRIDELLE J., Ann. Chim. 10 (1955) 824.
[4] FocT J., Thbse de Doctorat d'Etat, Universit6 Nancy I, France (1973).
[5] ROBBINS M. and WHITE J. G., J.
Phys.
Chem. Solids 25 (1964) 717.[6] EICKEL K. H. and PITSCH W.,
Phys.
Status Solidis 39(1970)
121.[7] MALOzEMOFF A. P., WILLIAMS A. R. and MORUzzI V. L.,
Phys.
Rev. B 29 (1984) 1620.[8] WILLIAMS A. R., KUBLER J. and GELATT Jr. C. D.,
Phys.
Rev. B19 (1979) 6094. [9] voN BARTH U, and HEDIN L., J.Phys.
Colloq.
France 33(1972)
C 5-1629.[10] JANAK J. F., Solid State Commun. 25
(1978)
53.[12] SAKUMA A., J.
Magn.
Magn.
Mat. 102(1991)
127. [13] MATAR S., Z.Physik
B, Cond. Matt. 87(1992)
91.[14] MATAR S., MOHN P., DEMAzEAU G, and SIBERCHICOT B., J.
Phys.
France 49 (1988) 1761. [15] KOBLER J. and EYERT V., «Electronic structure calculations» in Materials Science andTechnology,
Haasen, Kramer Eds., Electronic andMagnetic
properties
of Metals andCeramics, Buschow Ed., VCH,
Verlaggesellschaft,
Weinheim,Germany.
[16] MORUzzI V. L., MARCUS P. M., SCHWARz K. and MOHN P.,
Phys.
Rev. B 34 (1986) 1784. [17] KUBLER J., Solid State Commun. 72(1989)
631.[18] ANDRIAMANDROSO D., FEFILATIEV L., DEMAzEAU G., FOURNES L, and POUCHARD M., Mat. Res. Bull. 19 (1984) l187.
[19] POSINGER A., STEINER W, and MATAR S.,