HAL Id: hal-01657239
https://hal.archives-ouvertes.fr/hal-01657239
Submitted on 22 Jan 2018
HAL is a multi-disciplinary open access
archive for the deposit and dissemination of sci-entific research documents, whether they are pub-lished or not. The documents may come from teaching and research institutions in France or abroad, or from public or private research centers.
L’archive ouverte pluridisciplinaire HAL, est destinée au dépôt et à la diffusion de documents scientifiques de niveau recherche, publiés ou non, émanant des établissements d’enseignement et de recherche français ou étrangers, des laboratoires publics ou privés.
Sugars in atmospheric aerosols over the Eastern
Mediterranean
C. Theodosi, Christos Panagiotopoulos, A. Nouara, P. Zarmpas, P. Nicolaou,
K. Violaki, M. Kanakidou, Richard Sempere, N. Mihalopoulos
To cite this version:
C. Theodosi, Christos Panagiotopoulos, A. Nouara, P. Zarmpas, P. Nicolaou, et al.. Sugars in atmo-spheric aerosols over the Eastern Mediterranean. Progress in Oceanography, Elsevier, 2018, MERMEX special issue, 163, pp.70-81. �10.1016/j.pocean.2017.09.001�. �hal-01657239�
Sugars in atmospheric aerosols over the Eastern Mediterranean
12 3
C. Theodosi 1, 2, C. Panagiotopoulos 3, *, A. Nouara 3, P. Zarmpas 1, P. Nicolaou 1, K. 4
Violaki 1, M. Kanakidou 1, R. Sempéré 3 and N. Mihalopoulos 1, 2,* 5
6
1
Environmental Chemistry Processes Laboratory, Department of Chemistry, University of
7
Crete, P.O. Box 2208, 70013 Heraklion, Greece
8
2
Institute for Environmental Research and Sustainable Development, National Observatory of
9
Athens, 15236 Athens, Greece
10
3
Aix-Marseille Université, Mediterranean Institute of Oceanography (M I O) UMR 7294,
11
Université de Toulon, CNRS, IRD, France
12 13
*
correspondence to: [email protected], [email protected]
14 15 16
Abstract
17Aerosol samples (PM10) were collected at Finokalia monitoring station in a remote
18
area of Crete in the Eastern Mediterranean over a two-year period. They were analyzed 19
for total organic carbon (OC), water-soluble organic carbon (WSOC) and the molecular 20
distributions of sugars. WSOC comprised 45% of OC while the contribution of sugars 21
to the OC and WSOC content in the PM10 particles averaged 3±2% (n=218) and
22
11±6% (n=132), respectively. The total concentration of sugars ranged between 6 and 23
334 ng m-3 with the two most abundant sugars over the two-year period being glucose 24
and levoglucosan, contributing about 25% each to the total carbohydrate pool. Primary 25
saccharides (glucose, fructose, and sucrose) peaked at the beginning of spring (21, 17 26
and 15 ng m-3 respectively), indicating significant contributions of bioaerosols to the 27
total organic aerosol mass. On the other hand, higher concentrations of anhydrosugars 28
(biomass burning tracers levoglucosan, mannosan, galactosan) were recorded in winter 29
(19, 1.4 and 0.2 ng m-3 respectively) than in summer (9.1, 1.1 and 0.5 ng m-3 30
respectively). Levoglucosan was the dominant monosaccharide in winter (37% of total 31
sugars) while the low concentration measured in summer (19% of total sugars) was 32
probably due to the enhanced photochemical oxidation by hydroxyl (·OH) radicals 33
which impact anhydrosugars. Based on levoglucosan observations, biomass burning 34
was estimated to contribute up to 13% to the annual average OC measured at Finokalia. 35
Annual OC, WSOC and carbohydrate dry deposition fluxes for the two-year sampling 36
period were estimated at 414, 175 and 9 mg C m-2 y-1 respectively. Glucose and 37
levoglucosan accounted for 34% and 2% of the total sugar fluxes. According to our 38
estimations, atmospheric OC and WSOC inputs account for 0.70% and 0.71%, 39
respectively of the carbon in the annual primary production in the Cretan Sea. 40
Considering the entire Mediterranean, dry deposition of OC can provide at least 3 times 41
more C than riverine inputs of Rhone. Carbohydrate dry deposition flux represents up 42
to 0.04% of the C used for the primary production in the Cretan Sea, while <0.01% for 43
the entire Mediterranean. OC and WSOC contributions in the order of 0.33% and 44
0.14% for the whole basin further underline a minor contribution of the atmosphere in 45
the carbon cycle of the Mediterranean Sea. 46
47
Key words: Atmospheric aerosol; sugars; anhydrosugars; biomass burning; Eastern
48 Mediterranean Sea 49 50 51
1. Introduction
52Atmospheric aerosols consist of inorganic and organic substances including gases, 53
dust, spores and bacteria (Putaud et al., 2004; Bauer et al., 2008; Koçak et al., 2012). 54
They affect air quality, interact with light and atmospheric water, and impact on 55
visibility and climate (Tragou and Lascaratos, 2003; Vrekoussis et al., 2005; Pitari et 56
al., 2015). Identified organic compounds are generally present in fine particles (< 2.5 57
µm) and account for about 2 to 11 % of the organic carbon (OC) in the atmosphere, 58
implying that most of the organic content is uncharacterized (Fu et al. 2013). 59
Interestingly enough, a similar mass percentage was reported for seawater 60
(Panagiotopoulos and Sempéré, 2005). 61
Previous investigations identified the main organic components of aerosols 62
originating from land as being lipids of higher plant waxes, primary saccharides and 63
biomass burning tracers such as levoglucosan, mannosan, and galactosan (Simoneit et 64
al., 2004; Bauer et al., 2008). In some cases these organics account for more than half 65
of the organic carbon in both particulate matter, PM10 and PM2.5 in winter (Simoneit
66
and Elias, 2000; Simoneit, 2002; Caseiro et al., 2009; Yttri et al., 2009). Lipid 67
biomarkers have previously been employed to determine the sources of organic matter 68
in atmospheric particles and, more recently, to evaluate the degradation processes 69
(biotic/abiotic) occurring during the transit of these biomarkers from continental land 70
masses into the oceans and the water column (Kawamura, 2003; Sempéré and 71
Kawamura, 2003; Rontani et al., 2011). However, Marchand and Rontani (2001) 72
showed that lipid biomarkers are not always source-specific. In order to assess the 73
sources of these compounds, additional information from compound-specific isotopic 74
measurements (use of stable isotopes 13C) is required. 75
Unlike lipids-indicators, anhydrosugars (levoglucosan, mannosan, and galactosan) 76
are source specific indicators. In particular levoglucosan is the single most abundant 77
compound generated during thermal breakdown of cellulose (Simoneit et al. 1999; 78
Simoneit and Elias 2000). Anhydrosugars are produced in large quantities by 79
anthropogenic activities such as agricultural waste and residential wood combustion 80
(Fine et al. 2002; Kostenidou et al. 2013) and also by forest fires (Alves et al. 2011) and 81
have been detected in atmospheric aerosols in the remotest of areas (Fu et al. 2013). In 82
addition, the relative abundance of anhydrosugars may characterize the wood burning 83
sources, particularly hardwood versus softwood combustion (Schmidl et al., 2008a; 84
Caseiro et al., 2009; Sang et al., 2013) or residential versus natural fireplace 85
combustion (Fine et al., 2004). Other sugar compounds reported in atmospheric 86
aerosols include primary saccharides (e.g. fructose, sucrose, and glucose) and sugar 87
alcohols (e.g. mannitol, sorbitol, and xylitol) originating from various sources including 88
plants, spores and bacteria (Jaenicke, 2005; Bauer et al., 2008; Deguillaume et al., 89
2008). 90
The Mediterranean basin hosts < 1% of the world’s population. It is subject to 91
various anthropogenic impacts such as pollution related to urbanization and industrial 92
activities. Moreover, extensive forest fires and dust plumes occurring in Southern 93
Europe significantly impact aerosol levels in the Mediterranean environment and 94
modify the carbohydrate content of aerosols (Sciare et al., 2008; Kanakidou et al., 95
2011; Reche et al., 2012). Atmospheric inputs are a potential source of organic matter 96
and micronutrients in seawater (Theodosi et al., 2010a; The MerMex Group, 2011; 97
Theodosi et al., 2013a, b; Guieu et al., 2014; Violaki et al., 2015). Dissolved organic 98
carbon (DOC) plays a key role in carbon export from the surface down to the meso and 99
bathypelagic layers (Sohrin and Sempéré, 2005; Santinelli et al., 2010; Santinelli et al., 100
2013). Organic carbon deposition by wet and dry deposition into the Mediterranean Sea 101
ranges from 10 to 20 x 1010 mol C year-1 (Copin-Montégut, 1993). 102
Despite their mass abundance in aerosols few measurements of OC, WSOC and 103
other organic compounds including sugars have been reported for the Mediterranean 104
atmosphere. This study aims to provide, for the first time, data on the carbohydrate 105
content of atmospheric aerosols at a remote site in the Eastern Mediterranean (Finokalia 106
sampling station of the University of Crete). Carbohydrate data and their seasonal 107
variations along with other parameters such as OC, elemental carbon (EC), WSOC and 108
ions are presented. Emphasis is given to the annual variability of levoglucosan which 109
enables the quantification of the relative contribution of biomass burning emissions to 110
the OC in the Eastern Mediterranean. 111 112 113
2 Experimental
114 1152.1 Sampling site & procedure
116
Aerosol samples were collected at approximately 3m above the ground at Finokalia 117
monitoring station (35°24′N, 25°60′E; http://finokalia.chemistry.uoc.gr), a remote 118
location in the northern coast of Crete, Greece (Figure 1). The site is not impacted by 119
local human activities but is influenced by long-range transport of continental air 120
masses and is considered as representative of the Eastern Mediterranean atmosphere 121
(Mihalopoulos et al., 1997; Kouvarakis et al., 2000; Gerasopoulos et al., 2005; Sciare et 122
al., 2008; Theodosi et al., 2011). Thus it is a particularly well-suited site for the study of 123
“aged” aerosols from Central and Eastern Europe. PM10 samples were collected on
pre-124
combusted Quartz fiber filters (Whatman and Pall, 47 mm; 550 °C overnight) during 125
two campaigns lasting at least a full year from April 2009 to March 2010 and from 126
October 2012 to December 2013. Overall 143 filters were collected on a 48h basis 127
during the first campaign thus covering 80% of the year and 75 samples were collected 128
on a 24h basis during the second campaign covering 20% of the year and resulting in a 129
total of 218 samples. For both campaigns the sampling was uniformly distributed by 130
season with a total of 57 samples in spring, 49 in summer, 62 in autumn and 50 in 131 winter. 132 133 2.2 Analytical techniques 134 2.2.1. Ion chromatography 135
A portion of the quartz filters (1.5 to 2.5 cm2) was extracted in 5 to 7.5 ml of Milli-136
Q water in an ultrasonic bath for 45 min. The solutions obtained after the extraction 137
were filtered using syringe filters (0.45 μm pore size) to remove any insoluble species 138
and were then analyzed by ion chromatography for the main anions (Cl-, NO3-, SO42-,
139
HPO42- and C2O42-) and cations (Na+, NH4+, K+, Mg2+ and Ca2+) using the technique
140
described by Paraskevopoulou et al. (2014). 141
142
2.2.2. OC, EC, and WSOC analysis
143
All quartz filters were analyzed for OC and EC according to the Thermal Optical 144
Transmission (TOT) technique of Birch and Cary (1996), using a Sunset Laboratory 145
OC/EC Analyzer with small modifications in the temperature program (Theodosi et al. 146
2010b; Paraskevopoulou et al., 2014). For this the EUSAAR- 2 (European Supersites 147
for Atmospheric Aerosol Research) protocol was applied (Cavalli et al., 2010). During 148
the first (OC) phase the sample (1 or 1.5 cm2) was kept in a helium atmosphere and 149
heated in four steps at 200, 300, 450 and 650 °C. In the second phase the sample was 150
heated to 500, 550, 700 and 850 °C in He/O2 atmosphere. The detection limit of the
151
analysis was 0.26 and 0.05 µg C cm−2 for OC and EC respectively. For WSOC analysis 152
a part of the filter (3 cm2) was extracted with 15 ml of Milli-Q water in ultrasonic bath 153
for 45 min. The sample extract was filtered and analyzed for WSOC using a TOC-154
VCSH Shimadzu organic carbon analyzer (Theodosi et al., 2010b). Only filters from 155
the first campaign April 2009 to March 2010 were analyzed for WSOC. The reported 156
results for OC, EC and WSOC were blank corrected. 157
158
2.2.3. Particulate carbohydrates determination
159
2.2.3.a. Sample preparation
160
A portion of each quartz fiber filter (4 to 9 cm2) was extracted in 6 ml of Milli-Q 161
water by ultrasonic bath agitation for 60 min. The liquid samples extracted were 162
immediately filtered through pre-combusted quartz wool (450 °C for 6h) packed into a 163
pre-combusted Pasteur pipette to remove any insoluble particles including particles of 164
the quartz filter before injection to the chromatograph on the same day. Procedural 165
blanks collected in the field were treated and analyzed in the same manner as the 166
samples. The results showed no contamination for any target compound. Therefore the 167
data reported hereafter were neither corrected for the field blanks nor for the extraction 168
recoveries. 169
170
2.2.3.b. Reagents and standards - calibration
171
Standard stock solutions at a concentration of 1 mM were prepared for each of the 172
twelve carbohydrates namely: xylitol, levoglucosan, sorbitol, mannitol, mannosan, 173
galactosan, arabinose, galactose, glucose, mannose, fructose and sucrose (Sigma-174
Aldrich). Calibrations were performed on serial dilutions from the above stock solution 175
by dissolving the twelve individual carbohydrates in Milli-Q water. All individual and 176
composite standard solutions were stored at 4 °C in the dark. For quantitative 177
determination, two calibration curves were established with standard concentrations 178
ranging from 50 to 1000 nM and from 1 to 7.5 μM. The correlation coefficients were 179
always higher than 0.99 (R2 > 0.99) for all carbohydrates in both calibration curves. 180
181
2.2.3.c. HPAEC – PAD analysis
182
The liquid extracts were analyzed using an improved high-performance anion-183
exchange chromatography (HPAEC) with pulsed amperometric detection (PAD) 184
method to quantify the twelve sugar compounds in atmospheric aerosols. Sugars were 185
separated in an anion exchange column (Carbopac PA-1; 250 mm×4 mm) and detected 186
by an electrochemical detector (ED40-Dionex) set in the pulsed amperometric mode 187
(standard quadruple-pontential). The detector and column compartments were 188
maintained at 20 oC and 17 oC, respectively. Data acquisition and processing were 189
performed using the Chromeleon software. Further details of the HPAEC–PAD system 190
can be found in Panagiotopoulos et al. (2001; 2012). 191
For the separation and cleaning, three eluents were used for the HPAEC mobile 192
phase: 20mM NaOH (eluent A), Milli-Q water (eluent B) and 1.0 M NaOH (eluent C). 193
Low-carbonate sodium hydroxide solutions (NaOH) were used for the HPAEC mobile 194
phase. All solutions were sparged with helium for at least 30 min before use to remove 195
dissolved gases and were kept continuously under pure helium pressure. The complete 196
run time was approximately 53 min using a flow rate of 0.7 mL min-1. The elution 197
profile included an isocratic elution for 15 min at 1 mM NaOH to detect anhydrosugars 198
and sugar alcohols followed by gradient at 19 mM NaOH for 38 min to elute the 199
primary sugars (Caseiro et al., 2009). Then, the column was flushed with 1 M NaOH 200
for 30 min and re-equilibrated with 1 mM NaOH for 19 min before the injection of the 201
next sample. 202
In order to evaluate the precision of the method, both in terms of retention time and 203
the peak area of each carbohydrate detected, the coefficient of variation (CV), defined 204
as the ratio of the standard deviation to the mean value, was determined. The results 205
showed that repeated injections (n = 6) of a standard solution of 50 nM of each sugar 206
resulted in a CV range of 0.05-0.81% (mean 0.27%) for the retention time and 2.46-207
11.2% (mean 6.54%) for the peak area. The detection limit of the method for the 208
various carbohydrates was estimated at 25 nM. The recovery of the whole analytical 209
procedure was evaluated by extracting and analyzing five times pre-combusted quartz 210
blank filters spiked with mixtures of the sugar standards at four different concentrations 211
(100, 250, 500 and 1000 nM). The recoveries for all sugar concentrations were in the 212
range of 101–119% (mean 111%) for the 60 min extraction time. 213
214
3. Results
2153.1 OC, EC, WSOC and Ions
The concentrations of OC, WSOC and EC measured in the PM10 samples ranged
217
from 0.27 to 10.3 μg m-3 (mean 1.93 μg m-3) for OC; 0.09 to 4.37 μg m-3 (mean 0.86 μg 218
m-3) for WSOC, and 0.02 to 3.26 μg m-3 (mean of 0.34 μg m-3)for EC (Table 1). The 219
results indicated that OC and EC concentrations did not exhibit a seasonal variation, 220
remained almost constant throughout the year. Lower concentrations were observed 221
from September till January due to wash out by rain. Similarly, WSOC concentrations 222
did not show a clear seasonal cycle. Nevertheless, slightly higher values were measured 223
in the summer, possibly linked with enhanced photochemistry which renders the 224
organic fraction more water-soluble (Bougiatioti et al., 2013). WSOC comprised 6.22% 225
to 82.0% of OC with a mean of 45.1% and no distinct differences between summer 226
(51.1%) and winter (47.2%). This contribution is lower than the 67±7% reported for 227
PM2.5 at the same site (Bougatioti et al. 2011), but in the same range as the contribution
228
of 50% for PM10 samples collected at an urban site in Norway (Ytrri et al., 2007).
229
In our samples, ions were characterized by an abundance of non-sea salt potassium 230
nss-K+ with a range of 38.2 to 885 ng m-3 (mean 198 ng m-3). Non-sea salt potassium is 231
a typical tracer of biomass burning (Cachier et al., 1991). The levels of oxalates were 232
also high, in the range of 7.32 to 913 ng m-3 (mean 277 ng m-3) (Kawamura et al., 1996; 233
Kawamura and Ikushima, 1993; Laongsri and Harrison, 2013). This was especially so 234
in the winter/early spring and summer period. These observed nss-K+ levels indicate 235
that Finokalia is influenced by biomass burning emissions, which corroborates well 236
with previous investigations at the same site (Sciare et al., 2008). Our results also 237
showed that SO42−, NH4+, and NO3− concentrations exhibited peaks during winter (3.16,
238
0.39 and 1.45 μg m-3 respectively) and in spring/summer (5.01, 0.97 and 1.32 μg m-3 239
respectively). The winter peak is most likely associated with anthropogenic activities 240
such as domestic heating and long range transport. The summer peak can be attributed 241
to the absence of precipitation in conjunction with the induced photochemical reactions 242
during that season which lead to secondary aerosol formation in the area (Mihalopoulos 243
et al., 1997). 244
245
3.2 Distribution of carbohydrates in PM10 particles
246
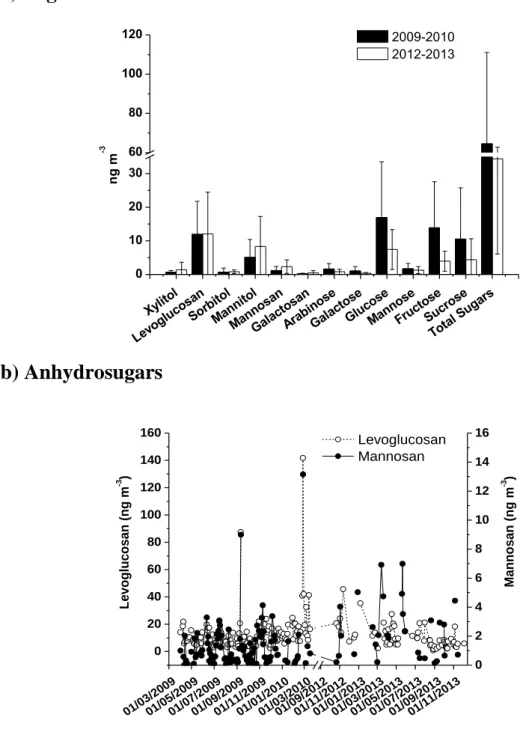
In 2009-2010 total sugars concentration in PM10 samples ranged from 11.1 to 334
247
ng m-3 (mean 63.0 ng m-3) and were higher than measurements in 2012-2013 (6.41 to 248
92.5 ng m-3; mean 31.5 ng m-3) (Figure 2). The mean total sugars concentration for both 249
periods was 57.7 ng m-3 (median 41.8 ng m-3) and was comparable to observations at a 250
rural site in Portugal (Pio et al., 2008), but lower compared to urban sites (71-77 ng m -251
3
) across the Mediterranean (Tel Aviv, Graham et al., 2004; Rehovot, Burshtein et al., 252
2011; and Barcelona, Reche et al., 2012) (Table 2). The contribution of sugars to the 253
OC and WSOC content in the PM10 particles varied from 0.18 to 22.9% with a mean of
254
3.30% and a median of 2.72% for OC and 1.4 to 66.6% with a mean of 10.6% and 255
median of 7.3% for WSOC. The contribution of sugars to the OC in our samples falls in 256
the range of values reported previously for Barcelona which ranged from 1.4 to 2.2 % 257
with a mean of mean 2.0% (Reche et al. 2012). Similar values of 1.1 to 2.4% with a 258
mean of 1.4% were reported for Tel Aviv (Graham et al., 2004) and for both rural (0.1 259
to 3.1%, mean 0.8%) and an urban (0.2 to 3.8%, mean 1%) background sites in Norway 260
(Yttri et al., 2007). 261
Anhydrosugars in particular accounted for 0 to 0.43% (mean 0.06%) of the PM10
262
mass, 0.04-9.05% (mean 0.9%) of the OC, and 0.29-14.1% (mean 2%) of the WSOC. 263
The highest mean contribution of anhydrosugars to the OC (1.4%) and WSOC (2.9%) 264
was observed in winter, highlighting the strong influence of biomass burning on winter 265
aerosols and enhanced chemical stability of levoglucosan in the atmosphere during the 266
winter period compared to summer (see below). The above observation has also been 267
reported for Barcelona by Reche et al. (2012) who found a significant correlation 268
between levoglucosan, OC and K+ in PM2.5, especially at night, suggesting the transport
269
of biomass burning emissions from the regional scale towards the city. 270
Among the sugars identified, levoglucosan and glucose exhibited the highest 271
concentrations, ranging from 0.89 to 142 ng m-3 (mean 12.6 ng m-3) and from 0.48 to 272
110 ng m-3 (mean 13.5 ng m-3) respectively. On average these two accounted for about 273
25% each to the total sugars concentration as shown in Table 2 and Figure 2. Fructose 274
and sucrose concentrations ranged from below the detection limit to 102 ng m-3 and 275
were the next most abundant accounting for 18% and 15% respectively of total sugars. 276
Mannitol accounted for 10% of total carbohydrates, whereas arabinose, galactose, and 277
mannose represented < 4% of total sugars and their concentrations ranged from below 278
the detection limit to 13.5 ng m-3 (Table 2; Figure 2). Our results also showed higher 279
levels of glucose, fructose, and sucrose in the 2009-2010 campaign (accounting for 280
61% of total sugars) relative to the 2012-2013 campaign (48% of total sugars). This 281
further indicates significant inter-annual variation for these compounds from their 282
sources (Figure 2). Levoglucosan, mannitol, mannosan, glucose and sucrose 283
concentrations measured at the Finokalia remote coastal station were 2 to 8 times lower 284
than those recorded in urban areas across the Mediterranean Sea (Graham et al., 2004; 285
Burshtein et al., 2011; Reche et al., 2012) as also shown in Table 2 and Figure 2. 286
Concentrations of mannitol and glucose in our study were similar to those recorded in 287
European cities (Yttri et al., 2007; Pio et al., 2008). However, levoglucosan and 288
mannosan concentrations at Finokalia are much lower (16 and 34 times respectively) 289
than those at a background site in Norway (Yttri et al., 2007). 290
291
3.3 Seasonal variation of sugars at the Finokalia site
292
Total sugars concentration in PM10 samples showed a seasonal variation with higher
293
values in spring (20.8-266 ng m-3, mean 77 ng m-3) and lower values in autumn (7.41-294
311 ng m-3, mean 39.3 ng m-3) (Figure 3). 295
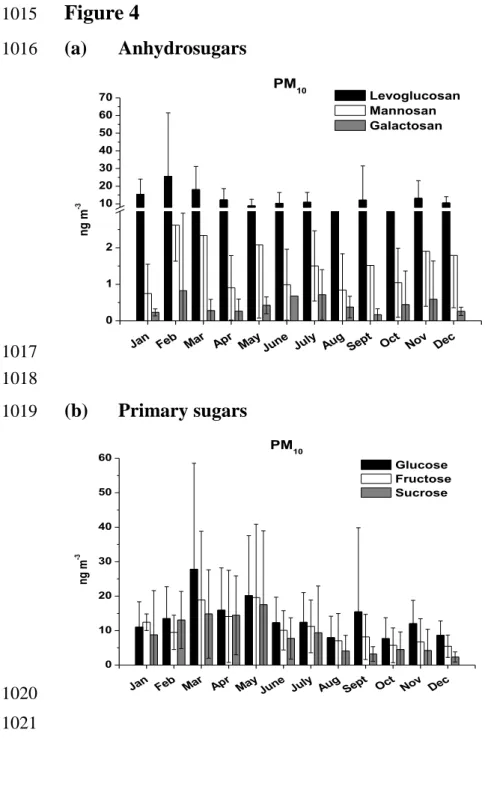
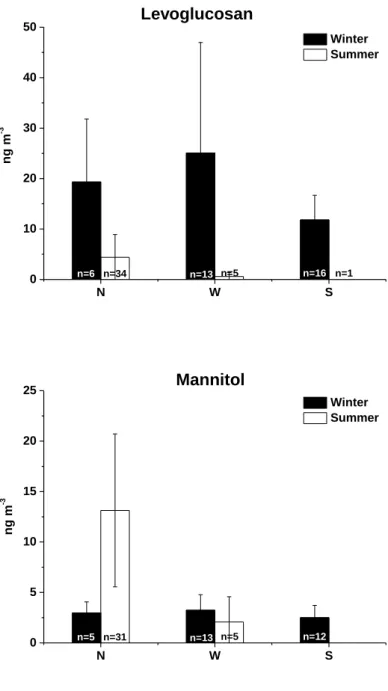
The observed concentrations of anhydrosugars (Figure 3; Figure 4a) were higher in 296
winter (mean for levoglucosan and mannosan of 18.6 and 1.96 ng m-3 respectively) than 297
in summer (9.08 and 1.10 ng m-3). This is in agreement with previous investigations in 298
other European sites for the three anhydrosugar isomers (Ytrri et al., 2007; Burshtein et 299
al., 2011; Reche et al., 2012). Xylitol and sorbitol closely followed anhydrosugar 300
patterns and were higher in winter than in summer. In contrast, mannitol concentrations 301
showed a maximum in late summer to early autumn, decreased in winter and peaked 302
again in late spring. A similar seasonal pattern has been reported by Burshtein et al. 303
(2011) for Israel in the Eastern Mediterranean. 304
Our results also showed that glucose, fructose and sucrose exhibited their highest 305
concentrations during spring and then decreased as the growing season progressed 306
(Figure 4b). These results reflect the biosynthesis of these compounds during spring 307
and are consistent with previous investigations (Medeiros et al., 2006; Pio et al., 2008). 308
A similar pattern was observed for arabinose, galactose, and mannose. 309 310
4. Discussion
311 4.1 Climatology 312To better understand the seasonal variability of sugars in our site as well as the 313
factors controlling their variability a short overview of air masses and aerosol sources 314
prevailing in the area is presented. 315
Five-day back-trajectories were computed using the Hysplit Dispersion Model 316
(Hybrid Single-Particle Lagrangian Integrated Trajectory) and used to determine the 317
source region of air masses arriving at the site during the studied period. Over the 318
course of a year, the northern sector is the most important with almost half of the air 319
masses arriving at Finokalia originating from Central and Eastern Europe as well as 320
part of western Turkey. During the warm periods when the photochemical activity is at 321
its highest the contribution of this sector reaches up to 75%. During the cold season the 322
prevalence of the N/NW sector is less pronounced and important transport from the 323
southern sector is responsible for Sahara dust transport (S/SW winds; occurrence up to 324
20%). The latter, takes place during the transition periods (spring/autumn) 325
(Mihalopoulos et al., 1997). Previous works have also indicated that due to strong 326
winds prevailing in the area contribution from local sources is very limited and that the 327
site is mainly influenced by “aged” aerosols transported to Finokalia from Central and 328
Eastern Europe (North/Northwestern winds) as well as from Sahara Desert (S/SW 329
winds) (Mihalopoulos et al, 1997). 330
The site is also strongly influenced by long-range transport of biomass burning 331
emissions during spring and summer, as it has been reported by Sciare et al. (2008). 332
Fires from countries from Central and Eastern Europe as well as countries bordering the 333
Black Sea (Bulgaria, Romania, Moldavia, Ukraine, and Russia) are expected to have a 334
significant impact over the E. Mediterranean since they are located in the northern wind 335
sector of Crete Island, reaching its highest contribution during the warm periods. These 336
fires are most likely to correspond to agricultural waste burning practices (post-337
harvesting for the summer months) (Sciare et al., 2008). In addition forest fires from the 338
Mediterranean can also influence the site (Bougiatioti et al., 2014). 339
340
4.2 Seasonal variability of total and individual sugars in the Eastern
341
Mediterranean
342
The total sugars concentration in atmospheric aerosols (PM10) exhibited two
343
seasonal maxima. The first one in the spring growing season and the second one in 344
winter when leaf senescence and microbial degradation of primary saccharides occurs 345
(Figure 3). During the dry season (spring, summer), the prevailing meteorological 346
conditions (e.g. no rain) along with the enhanced emission from primary sources (e.g. 347
vascular plants) may be responsible for the high concentrations (Figure 4b). In winter 348
the high sugar concentrations are most likely related to the high anhydrosugar content 349
of the samples (Figures 3 and 4a). 350
Levoglucosan in particular was by far the most dominant sugar in winter time 351
(mean 37% of the total sugar composition; Figure 2). This suggests that biomass 352
burning processes contribute significantly to the PM10 sugar content, further
353
highlighting the importance of these processes in the Eastern Mediterranean (Sciare et 354
al., 2008). In addition, the low photooxidative decay of levoglucosan in the atmosphere 355
during winter time can also enhance its levels. 356
Indeed recent data from laboratory and field studies have provided compelling 357
evidence that levoglucosan is not inert in the atmosphere and that one of the potentially 358
strongest degradation pathways is the photochemical oxidation by ·OH radicals 359
(Hennigan et al., 2010; Hoffmann et al., 2010; Mochida et al., 2010). Previous 360
investigations indicated that the 24-hour mean ·OH concentrations at the Finokalia 361
station in the Eastern Mediterranean during summertime (August) are of the order of 362
4.5 ± 1.1 × 106 cm−3 (Berresheim et al., 2003). Such high ·OH values imply a lifetime 363
for levoglucosan of 6 to 7h (3h if only daytime is considered) which results in the 364
significant degradation of levoglucosan during long-range transport in summer. This 365
explains the low summer levels of levoglucosan (Figure 4a). 366
Mannitol concentrations increased throughout the growing season, peaking in 367
summer and early autumn, indicating an input from primary biogenic sources such as 368
airborne fungal spores, algae and/or various vascular plants (Pashynska et al. 2002; 369
Bauer et al., 2008; Cheng et al., 2009). Glucose, fructose and sucrose concentrations 370
followed the mannitol pattern and were higher in spring (Figure 4b). This seasonality is 371
consistent with sucrose being an important sugar in developing flower buds (Bieleski et 372
al., 1995), while sucrose and glucose are the most abundant storage and photosynthetic 373
carbohydrates in plants (e.g. pollen, plant walls, fruit and their fragments; Pacini et al., 374
2006). 375
Figure 5 presents the variability of the three main sugars levoglucosan, mannitol 376
and glucose, representing the three main sources: biomass burning, primary biogenic 377
sources and fungal spores as a function of air masses origin for summer and winter. Air 378
masses origin can impact sugar and anhydrosugar levels mainly during summer time, 379
with the highest levels observed under northern air masses influence (Russia, Ukraine, 380
Bulgaria and Turkey) and the lowest under the southern one (Sahara desert). It worth 381
noting that the lower levoglucosan levels observed during summer time are most 382
probably due to the enhanced photoxidation of this compound (see discussion below). 383
384
4.3 Carbohydrate origins at the Finokalia station
385
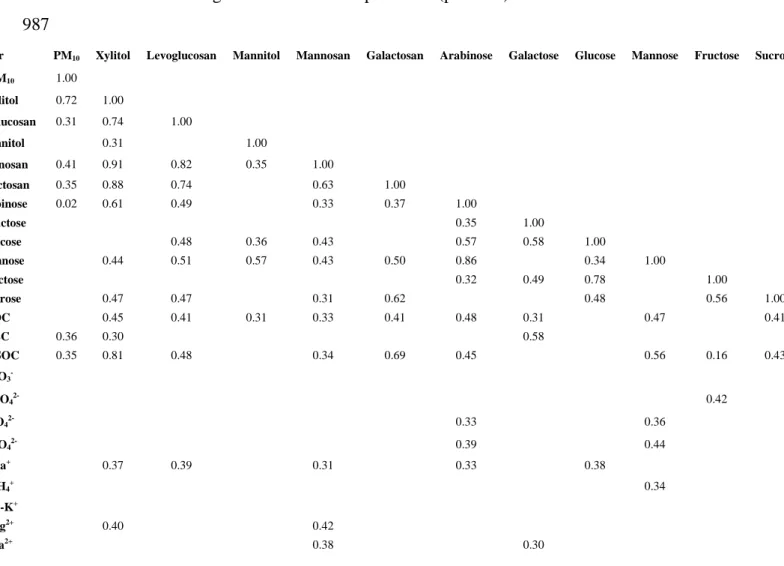
4.3.1 Correlations between carbohydrates, ions, OC, EC and WSOC
386
During the period studied anhydrosugar concentrations were strongly correlated 387
(levoglucosan vs mannosan, r=0.82; levoglucosan vs galactosan, r=0.74; mannosan vs 388
galactosan, r=0.63; n=218). This is presented in Table 3 and implies a common origin 389
for these compounds. Investigating these correlations on a seasonal basis (not shown) 390
the highest correlations were found to be in winter (r=0.93-0.95; n=50) reflecting their 391
common sources such as residential wood, coal, and agricultural waste burning 392
(Simoneit et al.,1999; Simoneit at al.,2004). These results are further supported by a 393
positive correlation of nss-K+ (typical biomass tracer) with anhydrosugars during 394
winter (r=0.61, 0.54 and 0.71 for nss-K+ vs levoglucosan, mannosan and galactosan, 395
respectively; n=50). 396
Anhydrosugars also correlated significantly with OC (r=0.33-0.41; n=205) and 397
WSOC (r=0.34-0.69; n=132) during the entire sampling period (Table 3). Notably, 398
significant relations of all three anhydrosugars were obtained with OC during winter 399
(r=0.67, 0.74 and 0.68 for levoglucosan, mannosan and galactosan respectively; n=50) 400
and summer (r=0.58 and 0.48 for levoglucosan and mannosan; n=49). A similar pattern 401
was also observed for WSOC during winter (r=0.85-0.90; n=50). The above results 402
clearly indicate that biomass-burning emissions from regional sources in wintertime are 403
important contributors of OC and WSOC in PM10.
404
Sugars in general and anhydrosugars in particular did not exhibit any significant 405
correlation with ions throughout the sampling period (Table 3). The exception was 406
levoglucosan during the winter which exhibited linear correlations with major ions such 407
as nss-K+ that are, as mentioned above, possibly associated with biomass burning 408
processes. 409
Our results also showed linear correlations (r=0.48-0.78; Table 3; n=218) among 410
the main primary sugars (i.e. fructose, glucose, and sucrose). These have been proposed 411
as markers for fugitive dust from biologically active surface soils (Simoneit et al., 2004; 412
Bauer et al., 2008). Primary sugars were strongly correlated to each other during 413
summer (r=0.79-0.89; n=49, p<0.001), inferring to their common biological origin 414
during that period. Significant correlations were also observed in summer between the 415
primary sugars, glucose and fructose versus arabinose and galactose (glucose vs 416
arabinose, r=0.66; glucose vs galactose, r=0.61; fructose vs galactose, r=0.78; n=49) 417
again indicating a common continental source. 418
419
4.3.2 Levoglucosan to mannosan ratio: biomass burning tracers
420
The relative ratio of levoglucosan to mannosan (L/M) has been used for source 421
reconstruction of combustion-derived by products in atmospheric aerosols (Schmidl et 422
al., 2008a; Caseiro et al., 2009; Fabbri et al., 2009; Sang et al., 2013). Throughout the 423
sampling period for our two campaigns the L/M ratio ranged from 2.28 to 88.2 in PM10
424
samples (15.5±14.8; median 9.97). Despite such a wide range in the ratios we observed 425
only a small seasonal variation of the averaged seasonal L/M ratio (spring=15.9±8.9, 426
median=11.2; summer=15.5±13.5, median=10.2; autumn=13.0±11.4, median=8.6; 427
winter=17.1±13.4, median=10.9). 428
As indicated above, levoglucosan is subject to intense photochemical oxidation 429
reactions by ·OH radicals especially in summer (lifetime of about 3h during daytime). 430
Our results indicated that the L/M ratio shows no significant seasonal variation which 431
further suggests that photochemistry has little or no impact on the L/M values. This 432
suggests that mannosan, which is an epimer of levoglucosan (an isomer that differs in 433
the position 2 of the ·OH function, i.e axial vs equatorial) may be subject to the same 434
photochemical reactions with perhaps slightly different kinetics. 435
The most common hardwoods in Crete are olive trees, while beech and pine trees 436
are classified as softwoods. The reported L/M ratios are: for softwood=3-10, 437
hardwood=15-25, herbaceous tissues=25-50, crop residues>40 (Schmidl et al., 2008a, 438
b; Engling et al., 2009, 2014; Mkoma et al., 2013). The range of L/M values observed 439
throughout the sampling period (2.3 to 88.2; median 10), with relatively small seasonal 440
variation (between 13 and 17), could suggest the existence of a common source of 441
biomass burning in the region during the whole year which cannot be clearly 442
characterized in terms of the type of wood being burnt only on the basis of the L/M 443
ratio. Indeed, as it has been previously reported by Sciare et al. (2008). Finokalia 444
station is mainly affected by biomass burning emissions from agricultural wastes (post-445
harvest wheat residual) from Central and Eastern Europe and countries surrounding the 446
Black Sea with contribution from forest fires (especially during summer). 447
448
4.4 Non photooxidized levoglucosan concentrations
449
The annual variations of levoglucosan and nss-K+ concentrations are depicted in 450
Figure 6a. A bimodal pattern is clearly observed for nss-K+ with early spring and mid-451
summer maxima while levoglucosan exhibits only a single maximum in winter. nss-K+ 452
may originate from several sources such as dust and biomass burning (Mihalopoulos et 453
al., 1997). Therefore, in order to eliminate the influence of dust transport from N. 454
Africa on nss-K+ levels, samples under prevailing southerly and south-westerly winds 455
were excluded and the same bimodal pattern was observed (not shown). Assuming i) 456
that low photoxidation occurs in winter, and ii) considering identical emission sources 457
for both levoglucosan and nss-K+ throughout the year (supported by the existence of a 458
main common source of biomass burning in the region during the whole year, Sciare et 459
al., 2008), we can estimate the concentration of levoglucosan before photooxidation 460
reduces its levels using the constant L/nss-K+ slope of their linear regression equal to 461
0.117, r=0.63 (0.126±0.08; median=0.117; n=42 in winter). Figure 6b depicts the daily 462
concentrations of levoglucosan and nssK+ in PM10 aerosols at Finokalia indicatively
463
during the first winter campaign (2009-2010). Figure 6c reflects the annual variability 464
of the estimated levoglucosan concentrations which exhibit two maxima in winter/early 465
spring and in summer, in accordance with Sciare et al. (2008) and Reche et al. (2012). 466
These studies suggested that the Eastern Mediterranean is under the influence of 467
biomass burning aerosols during winter/early spring and summer. It must be kept in 468
mind that during summer levoglucosan levels were decreased by 54% due to the 469
enhanced photooxidative decay, when both measured and estimated levoglucosan 470
concentrations are considered (9.40 and 20.1 ng m-3, respectively). 471
472
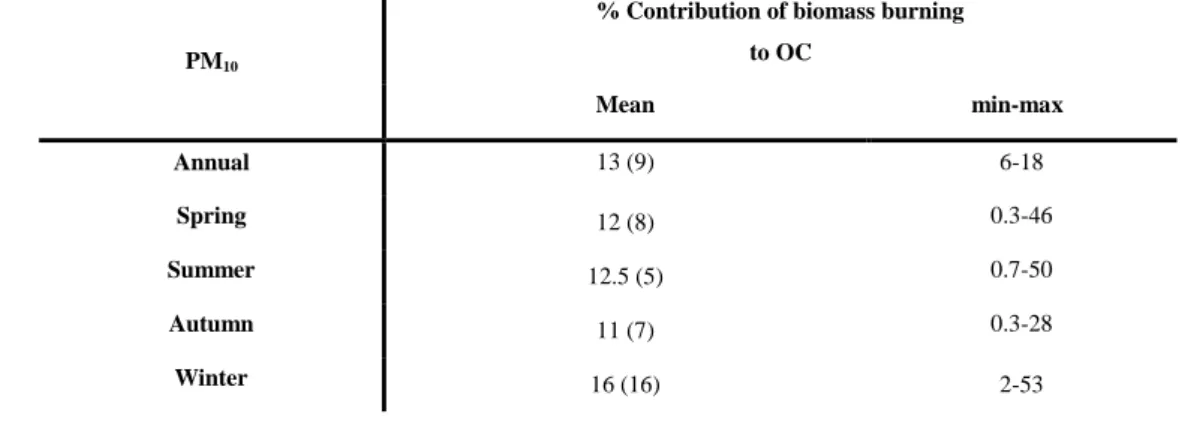
4.5 Relative contribution of biomass burning to OC
473
The L/OC ratio has been previously used to estimate the contributions of biomass 474
burning sources in aerosols (Andreae and Merlet, 2001). Calculated L/OC ratios show 475
small variation, typically ranging from 8.0 to 8.2% for the various sources of biomass 476
burning emissions such as savanna, grassland, tropical and extratropical forests, biofuel 477
and agricultural residues (Andreae and Merlet, 2001). In this study, we used the value 478
of 8.1% to estimate the percentage contribution of biomass and biofuel burning 479
activities to the OC in each of the PM10 aerosol samples (Table 4). The estimated
480
levoglucosan levels were used in our calculations as discussed in the previous section. 481
On this basis we estimated that biomass burning in the East Mediterranean 482
contributed annually 13% to the OC in PM10 aerosols at Finokalia station (Table 4).
483
The highest mean contributions from biomass burning were found, as expected, during 484
winter 16.0%±10.9% (median 13%). The estimated annual contribution of 13% is in 485
good agreement with the 14% value reported by Sciare et al. (2008) for the 486
Mediterranean Basin. These annual mean values are also comparable to those reported 487
for various sites affected by biomass burnings (12% Portugal, Puxbaum et al., 2007; 488
19-21% Barcelona, Reche et al., 2012). 489
490
4.6 Dry Deposition fluxes of carbohydrates in the Mediterranean Sea
491
4.6.1 Fluxes and carbohydrate speciation
492
In order to investigate the atmospheric input of carbon in the form of carbohydrates 493
in the Cretan Sea we calculated the bulk deposition fluxes (Fx) of the individual sugar
494
concentrations (Cx) using their specific settling velocities (Vd) and the following
495 equation: 496 d x x C V F (1) 497
In the past, a number of approaches have been applied to calculate dry atmospheric 498
deposition flux, including mass-size distributions in the aerosol population, usually 499
evaluated from virtual impactors (Bergametti, 1987), from theoretical models (Dulac et 500
al., 1989), the deployment of surrogate collectors (Dolske and Gatz, 1985; Baeyens et 501
al., 1990) or the difference between total deposition and wet deposition measurements 502
(Migon et al., 1997). 503
Unpublished data from the Finokalia station indicated that anhydrosugars are 504
mainly associated with the fine fraction particles (PM1) whereas primary sugars with
505
the coarse fraction, which is in agreement with previous investigations (Schkolnik et 506
al., 2005; Fuzzi et al., 2007; Bauer et al., 2008; Deguillaume et al., 2008). For this 507
reason, we assumed different deposition velocities for coarse and fine particles of 2 cm 508
s-1 and0.1 cm s-1 respectively (Theodosi et al., 2010a). It is well known that there is no 509
widely accepted values for deposition velocities and uncertainty in the used values can 510
be as high as 100%. However, works performed at Finokalia for nutrients and trace 511
metals with size segregated aerosol sampling and by comparing their fluxes with other 512
methods (Kouvarakis et al., 2001; Theodosi et al., 2010) found that deposition 513
velocities values of 2 cm s-1 and 0.1 cm s-1 for coarse and fine particles respectively can 514
be considered as best guess for flux estimates for the area. Our calculation give rise to 515
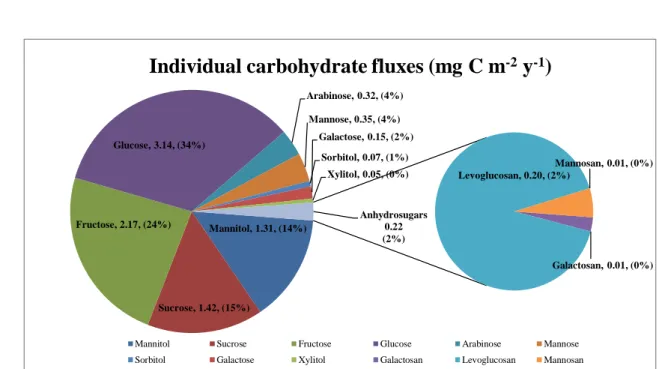
an annual total sugar fluxes of 9.19 mg C m-2 y-1. Primary sugars (7.55 mg C m-2 y-1) 516
and sugar alcohols (1.43 mg C m-2 y-1 of which 1.31 mg C m-2 y-1 was mannitol) 517
exhibited higher deposition fluxes than anhydrosugars (0.22 mg C m-2 y-1) (Figure 7). 518
Among the primary sugars, glucose was the dominant monosaccharide in PM10
519
particles (approximately 27% of the total carbohydrates concentration) with the highest 520
deposition flux (3.14 mg C m-2 y-1)accounting for 34% of the total carbohydrates flux 521
(Figures 2, 7). A similar glucose flux percentage (approximately 33% of the 522
carbohydrates) was reported for dissolved and particulate carbon delivered by the 523
Rhone River in the western Mediterranean Sea (Panagiotopoulos et al., 2012). 524
Although marine dissolved carbohydrate measurements are not available for the 525
Mediterranean Sea, literature data from the Pacific and Arctic Ocean suggest that 526
glucose is also the dominant sugar in marine surface waters accounting for 25 to 50% 527
of total carbohydrates (Skoog and Benner, 1997; Sempéré et al., 2008; Panagiotopoulos 528
et al., 2014). These results may therefore indicate that external carbohydrate inputs 529
from the atmosphere and rivers may potentially contribute to sustaining the level of 530
glucose in dissolved organic matter (DOM). 531
The above derived dry deposition fluxes of carbohydrates can be extrapolated to the 532
entire Mediterranean Sea with surface area of 2.5 x 10⁶ km2 (1.67 x 10⁶ km2 for the 533
Eastern Mediterranean and 0.86 x 10⁶ km2 for the Western Mediterranean; Candela et 534
al., 1989). Although such extrapolation is prone to a high uncertainty (factor of 2 at 535
least), an order of magnitude estimation is always useful especially when a comparison 536
to other sources is required. On this basis dry deposition carbohydrate fluxes are equal 537
to 2.30 x 10¹⁰ g C y-1 (0.19 x 10¹⁰ moles C y-1) and glucose flux equal to 0.79 x 10¹⁰ g C 538
y-1 (0.07 x 10¹⁰ moles C y-1). Our results indicate that atmospheric inputs from dry 539
deposition alone could contribute almost twice the total carbohydrate input of the 540
Rhone River into the Mediterranean Sea (0.11 x 10¹⁰ moles C y-1, (Panagiotopoulos et 541
al., 2012). 542
543
4.6.2 Significance of carbohydrates deposition on the seawater productivity
544
The annual carbohydrates fluxes calculated for the two-year sampling period are 545
equal to 9.19 mg C m-2 y-1 (13.5 mg C m-2 y-1 during April 2009 to March 2010 and 546
4.95 mg C m-2 y-1 during October 2012 to December 2013). Given that OC and WSOC 547
are distributed mainly in the fine mode with a fine to coarse ratio of 70/30 (Koulouri et 548
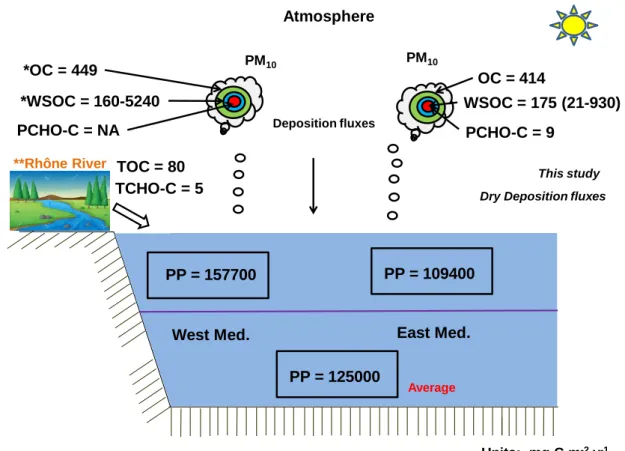
al., 2008, Bougiatioti et al., 2013) the annual dry deposition fluxes of OC and WSOC 549
are 414 mg C m-2 y-1 (n= 205) and 175 mg C m-2 y-1 (n=132) respectively (Figure 8). 550
Total carbohydrates thus account for 2% and 5% of these fluxes respectively. Assuming 551
that these values are valid for the entire Mediterranean basin, dry deposition OC and 552
WSOC input to the sea of 1 and 0.42 x 10¹² g C y−1 can be estimated, respectively. 553
Direct measurements of total OC (TOC) in rainwater at Crete in the Eastern 554
Mediterranean indicate that wet deposition can account for 1.5 x 10¹² g C y−1 555
(Economou and Mihalopoulos, 2002). Similar values of 0.4 to 13.1 x 10¹² g C y−1 were 556
obtained for total (wet plus dry) atmospheric fluxes at Cap Ferrat (Pulido-Villena et al., 557
2008). Sempéré et al. (2000) estimated the total (dissolved plus particulate) OC fluxes 558
of the Rhone River to the Mediterranean Sea to be 2.7 x 10¹⁰ moles C y−1 (0.3 x 10¹² g 559
C y−1). This suggests that the total TOC input from atmospheric deposition could be up 560
to 9 times higher than the Rhone river inputs. 561
Considering an annual primary production (PP) of 24.8 g C m-2 y-1 for the South 562
Aegean Sea (upper 50 m at four stations; Ignatiades, 1988), atmospheric carbohydrate 563
dry deposition accounts for about to 0.37‰ of this PP, and OC and WSOC about 0.70 564
and 0.71% respectively. Taking an average annual PP of 125 g C m-2 y-1 for the entire 565
Mediterranean (Antoine et al., 1995; The MerMex Group, 2011; Figure 8) our results 566
indicate that OC, WSOC and carbohydrate contributions to PP are of the order of 567
0.33%, 0.14% and <0.01%, respectively. 568
569
5. Summary and concluding remarks
570The role of biomass combustion and primary bio-particles in atmospheric PM10
571
aerosol in the Eastern Mediterranean over a two-year period was estimated by studying 572
sugar tracers. Sugars concentration ranged from 6 to 334 ng m-3 and their average 573
contributions to the OC and WSOC pools were 3 and 11% respectively. Averaging over 574
the two-year study period, glucose and levoglucosan were the two most abundant 575
sugars and contributed equally about 25% of the total sugar concentration in PM10
576
aerosols. Fructose, sucrose and mannitol represented 18%, 15% and 10% of total 577
carbohydrates concentrations, respectively, while the contribution of the remaining 578
sugars was less than 4%. 579
The concentration of primary saccharides (sum of glucose, fructose and sucrose) 580
peaked at 53 ng m-3 during spring and then decreased as the growing season progressed 581
(22 ng m-3), reflecting the biosynthesis of these compounds by terrestrial vascular 582
plants. On the other hand, the highest concentrations of anhydrosugars (sum of 583
levoglucosan, galactosan, and mannosan) were recorded in winter (20 ng m-3) rather 584
than in summer (11 ng m-3) due to enhanced photochemical oxidation by ·OH radicals. 585
Levoglucosan, which is associated with biomass combustion, was the dominant 586
monosaccharide in winter (37% of total sugars) with lower concentrations in the 587
summer (19% of total sugars). We estimate that atmospheric oxidation by ·OH 588
decreases levoglucosan levels by 54% during summer. The levoglucosan 589
concentrations estimated assuming no photooxidation of levoglucosan in summer 590
exhibit a bimodal cycle with two maxima (winter/early spring and summer). These 591
results clearly highlight the importance of such processes in the Eastern Mediterranean 592
Sea. 593
The annual mean contribution of biomass burning to OC in the Eastern 594
Mediterranean was equal to 13% in PM10. Levoglucosan to mannosan ratios varied
595
between 13 and 17 for different seasons, indicating possibly a a common source of 596
biomass burning in the region during the whole year. Annual deposition fluxes of total 597
carbohydrates in PM10 particles were estimated to be 9.19 mg C m-2 y-1. Glucose and
598
levoglucosan accounted for 34% and 2%, respectively of the total fluxes indicating 599
different deposition fluxes of primary sugars and anhydrosugars in the Cretan Sea. 600
By considering the annual PP in the Cretan Sea our results indicate OC, WSOC and 601
sugar contributions of the order of 0.70%, 0.71 and 0.04% respectively. While, for the 602
entire Mediterranean their dry deposition represents up to 0.33%, 0.14% and <0.01% of 603
the C used for the PP respectively. 604
Finally TOC input from total atmospheric deposition could be up to 9 times higher 605
than the Rhone river inputs highlighting the important role of the atmosphere on the 606
Mediterranean Sea carbon cycle. 607
608
Acknowledgements
609This work was funded by the project PANOPLY (Pollution Alters Natural aerosol 610
composition: implications for Ocean Productivity, cLimate and air qualitY). C. 611
Theodosi acknowledges financial support from the State Scholarship Foundation (ΠΕ2-612
SHORT TERMS-19904) within the framework for action “State Scholarships 613
Foundation’s mobility grants program for the short term training in recognized 614
scientific/research centers abroad for doctoral candidates or postdoctoral researchers in 615
Greek universities or research centers”. This study was carried out as a part of the OT-616
MED-Labex (AIOLOS project) within WP4 MERMEX/MISTRALS and contributes to 617
the international SOLAS project. We are grateful to Elvira Pulido, co-leader of WP4-618
MERMEX for suggestions on the manuscript. 619
620
References
621Αlves, C.A., Vicente, A., Monteiro, C., Gonçalves, C., Evtyugina, M., Pio, C., 2011. 622
Emission of Trace Gases and Organic Components in Smoke Particles from a 623
Wildfire in a Mixed-Evergreen Forest in Portugal. The Science of the Total 624
Environment 409 (8): 1466–75. 625
Andreae, M. O., and Merlet, P., 2001. Emission of trace gases and aerosols from 626
biomass burning. Global Biogeochemical Cycles 15, 955–966. 627
Antoine, D., A. Morel, Andre ́, J. M., 1995. Algal pigment distribution and primary 628
production in the eastern Mediterranean as derived from Coastal Zone Color 629
Scanner observations. Journal of Geophysical Research 100, 16,193–16, 209. 630
Baeyens, W., Dehairs, F., Dedeurwaerder, H., 1990. Wet and dry deposition fluxes 631
above the North Sea. Atmospheric Environment 24A, 1693–1703. 632
Bauer, H., Claeys, M., Vermeylen, R., Schueller, E., Weinke, G., Berger, A., Puxbaum, 633
H., 2008. Arabitol and mannitol as tracers for the quantification of airborne fungal 634
spores. Atmospheric Environment 42, 588-593. 635
Bergametti, G., 1987. Apports de matiere par voie atmosphtrique a la Mediterranee 636
Occidentale. Ph.D. thesis, Universite de Paris 7, 296 pp. 637
Berresheim, H., Plass-Dulmer, C., Elste, T., Mihalopoulos, N., Rohrer, F., 2003. OH in 638
the coastal boundary layer of Crete during MINOS: measurements and relationship 639
with ozone photolysis. Atmospheric Chemistry and Physics 3, 639–649. 640
Birch, M.E., Cary, R.A., 1996. Elemental carbon-based method for monitoring 641
occupational exposures to particulate diesel exhaust. Aerosol Science and 642
Technology 25: 221–41. 643
Bieleski, R. L., 1995. Onset of phloem export from senescent petals of daylily. Plant 644
Physiology, 109 (2), 557–565. 645
Bougiatioti, A., Zarmpas, P., Koulouri, E., Antoniou, M., Theodosi, C., Kouvarakis, G., 646
Saarikoski, S., Makela, T., Hillamo, R., and Mihalopoulos, N., 2013. Organic, 647
elemental and water-soluble organic carbon in size segregated aerosols, in the 648
marine boundary layer of the Eastern Mediterranean. Atmospheric Environment 64, 649
251–262. 650
Bougiatioti, A., Stavroulas, I., Kostenidou, E., Zarmpas, P., Theodosi, C., Kouvarakis, 651
G., Canonaco, F., Prévôt, A. S. H., Nenes, A., Pandis, S. N., and Mihalopoulos, N., 652
2014. Processing of biomass burning aerosol in the Eastern Mediterranean during 653
summertime. Atmospheric Chemistry and Physics 14, 4793-4807. 654
Burshtein, N., Lang-Yona, N. Rudich, Y., 2011. Ergosterol, arabitol and mannitol as 655
tracers for biogenic aerosols in the eastern Mediterranean. Atmospheric Chemistry 656
and Physics 11, 829–839. 657
Cachier, H., Ducret, J., Brémond, M. P., Gaudichet, A., Lacaux, J. P., Yoboué, V., 658
Baudet, J., 1991. Biomass burning in a savanna region of the Ivory Coast, in: 659
Global Biomass Burning: Atmospheric, Climatic and Biospheric Implications, 660
edited by: Levine, J. S., MIT Press, Cambridge, Mass., 174–180. 661
Candela, J., Winant, C. D., Bryden, H. L., 1989. Meteorologically Forced subinertial 662
flows through the Strait of Gibraltar. Journal of Geophysical Research 94, 12667-663
12679. 664
Caseiro A., Bauer H., Schmidl C., Pio C.A, Puxbaum H., 2009. Wood burning impact 665
on PM10 in three Austrian regions. Atmospheric Environment 43, 2186–2195.
666
Cavalli, F., Viana, M., Yttri, K. E., Genberg, J., and Putaud, J. P., 2010. Toward a 667
standardised thermal-optical protocol for measuring atmospheric organic and 668
elemental carbon: the EUSAAR protocol. Atmospheric Measurement Techniques 3, 669
79–89. 670
Cheng, F. Y., Zamski, E., Guo, W. W., Pharr, D. M., and Williamson, J. D., 2009. 671
Salicylic acid stimulates secretion of the normally symplastic enzyme mannitol 672
dehydrogenase: a possible defense against mannitol-secreting fungal pathogens. 673
Planta, 6(230), 1093–1103. 674
Copin-Montégut, C., 1993. Alkalinity and carbon budgets in the Mediterranean Sea. 675
Global Biogeochemical Cycles 7, 915–925. 676
Deguillaume, L., Leriche, M., Amato, P., Ariya, P.A., Delort, A.-M., Pöschl, U., 677
Chaumerliac, N., Bauer, H., Flossmann, A.I., Morris, C.E., 2008. Microbiology and 678
atmospheric processes: chemical interactions of primary biological aerosols. 679
Biogeosciences 5, 1073 - 1084. 680
Dolske, D.A., Gatz, D.F., 1985. A field intercomparison of methods for the 681
measurement of particle and gas dry deposition. Journal of Geophysical Research 682
90, 2076–2084 683
Dulac, F., Buat-Menard, P., Ezat, U., Melki, S., Bergametti, G., 1989. Atmospheric 684
input of trace metals to the western Mediterranean: uncertainties in modeling dry 685
deposition from cascade impactor data. Tellus 41B, 362–378. 686
Economou C., and Mihalopoulos, N., 2002. Formaldehyde in the rainwater in the 687
Eastern Mediterranean: Concentration, deposition and contribution to organic 688
carbon budget. Atmospheric Environment 36, 1337-1347. 689
Engling, G., Lee, J. J., Tsai, Y. W., Lung, S. C. C., Chou, C. C. K., Chan, C. Y., 2009. 690
Size-resolved anhydrosugar composition in smoke aerosol from controlled field 691
burning of rice straw. Aerosol Science and Technology 43, 662–672. 692
Engling, G., He, J., Betha, R., and Balasubramanian, R., 2014. Assessing the regional 693
impact of indonesian biomass burning emissions based on organic molecular tracers 694
and chemical mass balance modeling. Atmospheric Chemistry and Physics 14, 695
8043–8054. 696
Fabbri, D., Torri, C., Simoneit, B. R. T., Marynowski, L., Rushdi, A. I., Fabiańska, M. 697
J., 2009. Levoglucosan and other cellulose and lignin markers in emissions from 698
burning of Miocene lignites. Atmospheric Environment 43, 2286–2295. 699
Fine, P. M., Cass, G. R., Simoneit, B. R.T., 2002. Organic Compounds in Biomass 700
Smoke from Residential Wood Combustion: Emissions Characterization at a 701
Continental Scale. Journal of Geophysical Research 107 (D21): 1–91. 702
Fine, P. M., Cass, G. R., Simoneit, B. R.T., 2004. Chemical Characterization of Fine 703
Particle Emissions from the Wood Stove Combustion of Prevalent United States 704
Tree Species. Environmental Engineering Science 21 (6): 705–21. 705
Fu, P.Q., Kawamura, K., Chen, J., Charrière, B., Sempéré, R., 2013. Organic Molecular 706
Composition of Marine Aerosols over the Arctic Ocean in Summer: Contributions 707
of Primary Emission and Secondary Aerosol Formation. Biogeosciences 10 (2): 708
653–67. 709
Fuzzi, S., Decesari, S., Facchini, M.C., Cavalli, F., Emblico, L., Mircea, M., Andreae, 710
M.O., Trebs, I., Hoffer, A., Guyon, P., Artaxo, P., Rizzo, L.V., Lara, L.L., 711
Pauliquevis, T., Maenhaut, W., Raes, N., Chi, X.G., Mayol-Bracero, O.L., Soto-712
Garcia, L.L., Claeys, M., Kourtchev, I., Rissler, J., Swietlicki, E., Tagliavini, E., 713
Schkolnik, G., Falkovich, A.H., Rudich, Y., Fisch, G., Gatti, L.V., 2007. Overview 714
of the inorganic and organic composition of size-segregated aerosol in Rondonia, 715
Brazil, from the biomass-burning period to the onset of the wet season. Journal of 716
Geophysical Research Atmospheres 112 (D01201). 717
Graham, B., Falkovich, A. H., Rudich, Y., Maenhaut, W., Guyon, P., Andreae, M.O., 718
2004. Local and regional contributions to the atmospheric aerosol over Tel Aviv, 719
Israel: a case study using elemental, ionic and organic tracers. Atmospheric 720
Environment 38, 1593-1604. 721
Guieu, C., Ridame, C., Pulido-Villena, E., Bressac, M., Desboeufs, K., Dulac, F., 2014. 722
Impact of dust deposition on carbon budget: a tentative assessment from a 723
mesocosm approach. Biogeosciences 11, 5621-5635. 724
Hennigan, C.J., Sullivan, A.P., Collett, J.L., Robinson, A.L., 2010. Levoglucosan 725
stability in biomass burning particles exposed to hydroxyl radicals. Geophysical 726
Research Letters 37, L09806. 727
Hoffmann, D., Tilgner, A., Iinuma, Y., Hermann, H., 2010. Atmospheric stability of 728
levoglucosan: a detailed laboratory and modeling study. Environmental Science & 729
Technology 44, 694-699. 730
Ignatiades, L., 1998. The productive and optical status of the oligotrophic waters of the 731
southern Aegean Sea (Cretan Sea), eastern Mediterranean. Journal of Plankton 732
Research 20, 985–995. 733
Jaenicke, R., 2005. Abundance of cellular material and proteins in the atmosphere. 734
Science 308, 73. 735
Kanakidou, M., Mihalopoulos, N., Kindap,, T., Im, U., Vrekoussis, M., Gerasopoulos, 736
E., Dermitzaki, E., Unal, A., Kocak, M., Markakis, K., Melas, D., Kouvarakis, G., 737
Youssef, A.F., Richter, A., Hatzianastassiou, N., Hilboll, A., Ebojie, F., Wittrock, F, 738
Von Savigny, C., Burrows, J.P., 2011. Megacities as hot spots of air pollution in the 739
East Mediterranean. Atmospheric Environment 45, 1223-1235. 740
Kawamura, K., Ikushima, K., 1993. Seasonal changes in the distribution of 741
dicarboxylic acids in the urban atmosphere. Environmental Science & Technology 742
27, 2227–2235. 743
Kawamura, K., Kasukabe, H., Barrie, L.A., 1996. Source and reaction pathways of 744
dicarboxylic acids, ke-toacids and dicarbonyls in arctic aerosols: One year of 745
observations. Atmospheric Environment 30, 1709–1722. 746
Kawamura, K. 2003. Four Years’ Observations of Terrestrial Lipid Class Compounds 747
in Marine Aerosols from the Western North Pacific. Global Biogeochemical Cycles 748
17 (1): 1–19. 749
Koçak, M., Theodosi, C., Zarmpas, P., Séguret, M. J. M., Herut, B., Kallos, G., 750
Mihalopoulos, N., Kubilay, N., Nimmo, M., 2012. Influence of Mineral Dust 751
Transport on the Chemical Composition and Physical Properties of the Eastern 752
Mediterranean Aerosol. Atmospheric Environment 57, 266–277. 753
Kostenidou, E., Kaltsonoudis, C., Tsiflikiotou, M., Louvaris, E., Russell, L. M., Pandis, 754
S. N., 2013. Burning of Olive Tree Branches: A Major Organic Aerosol Source in 755
the Mediterranean. Atmospheric Chemistry and Physics 13 (17): 8797–8811. 756
Koulouri, E., Saarikoski, S., Theodosi, C., Markaki, Z., Gerasopoulos, E., Kouvarakis, 757
G., Mäkelä, T., Hillamo, R., Mihalopoulos, N., 2008. Chemical Composition and 758
Sources of Fine and Coarse Aerosol Particles in the Eastern Mediterranean. 759
Atmospheric Environment 42, 6542–6550. 760
Laongsri, B., Harrison, R.M., 2013. Atmospheric behaviour of particulate oxalate at 761
UK urban back-ground and rural sites. Atmospheric Environment 71, 319–326. 762
Marchand, D., and Rontani, J-F., 2001. Characterisation of Photo-Oxidation and 763
Autoxidation Products of Phytoplanktonic Monounsaturated Fatty Acids in Marine 764
Particulate Matter and Recent Sediments. Organic Geochemistry 32 (2): 287–304. 765
Medeiros, P.M., Conte, M.H., Weber, J.C., Simoneit, B.R.T., 2006. Sugars as source 766
indicators of biogenic organic carbon in aerosols collected above the Howland 767
Experimental Forest, Maine. Atmospheric Environment 40, 1694-1705. 768
Migon, C., Journal, B., Nicolas, E., 1997. Measurement of trace metal wet, dry and 769
total atmospheric fluxes over the Ligurian Sea. Atmospheric Environment 6, 889– 770
896. 771
Mihalopoulos, N., Stephanou, E., Pilitsidis, S., Kanakidou, M., Bousquet, P., 1997. 772
Atmospheric aerosol composition above the Eastern Mediterranean region. Tellus 773
49B, 314-326. 774
Mkoma, S. L., Kawamura, K., Fu, P. Q., 2013. Contributions of biomass/biofuel 775
burning to organic aerosols and particulate matter in Tanzania, East Africa, based 776
on analyses of ionic species, organic and elemental carbon, levoglucosan and 777
mannosan. Atmospheric Chemistry and Physics 13, 10325–10338. 778
Mochida, M., Kawamura, K., Fu, P., Takemura, T., 2010. Seasonal variation of 779
levoglucosan in aerosols over the western North Pacific and its assessment as a 780
biomass-burning tracer. Atmospheric Environment 44, 3511–3518. 781
Pacini, E., Guarnieri, M., Nepi, M., 2006. Pollen carbohydrates and water content 782
during development, presentation, and dispersal: A short review. Protoplasma, 228 783
(1-3), 73–77. 784
Pashynska, V., Vermeylen, R., Vas, G., Maenhaut, W., Claeys, M., 2002. Development 785
of a gas chromatographic/ion trap mass spectrometric method for the determination 786
of levoglucosan and saccharidic compounds in atmospheric aerosols. Application to 787
urban aerosols. Journal of Mass Spectrometry 37, 1249–1257. 788
Panagiotopoulos, C., Sempéré, R., Lafont, R., Kerhervé, P., 2001. Sub-ambient 789
temperature effects on separation of monosaccharides by HPAEC-PAD. 790
Application to marine chemistry. Journal of Chromatography A. 920:13-22. 791
Panagiotopoulos, C., and Sempéré, R., 2005. Analytical Methods for the Determination 792
of Sugars in Marine Samples: A Historical Perspective and Future Directions. 793
Limnology Oceanography: Methods 3, 419–54. 794
Panagiotopoulos, C., Sempéré, R., Para, J., Raimbault, P., Rabouille, C., Charriere, B., 795
2012. The composition and flux of particulate and dissolved carbohydrates from the 796
Rhone River into the Mediterranean Sea. Biogeosciences 9 (5), 1827-1844. 797
Panagiotopoulos, C., Sempéré, R., Jacq, V., Charrière, B., 2014. Composition and 798
distribution of dissolved carbohydrates in the Beaufort Sea Mackenzie margin 799
(Arctic Ocean). Marine Chemistry 166, 92–102. 800
Paraskevopoulou, D., Liakakou, E., Gerasopoulos, E., Theodosi, C., Mihalopoulos, N., 801
2014. Long-term characterization of organic and elemental carbon in the PM2.5
802
fraction: the case of Athens Greece. Atmospheric Chemistry and Physics 14, 13313-803
13325. 804
Pey, J., Pérez, N., Castillo, S., Viana, M., Moreno, T., Pandolfi, M., López-Sebastián, 805
J.M., Alastuey, A., Querol, X., 2009. Geochemistry of regional background 806
aerosols in the Western Mediterranean. Atmospheric Research 94, 422–435. 807
Pio, C., Legrand, M., Alves, C.A., Oliveira, T., Afonso, J., Caseiro, A., Puxbaum, H., 808
Sánchez-Ochoa, A., Gelencsér, A., 2008. Chemical composition of atmospheric 809
aerosols during the 2003 summer intense forest fire period. Atmospheric 810
Environment 42, 7530-7543. 811
Pitari, G., Genova, G.D., Coppari, E., De Luca, N., Di Carlo, P., Iarlori, M., Rizi, V., 812
2015. Desert dust transported over Europe: Lidar observations and model 813
evaluation of the radiative impact. Journal of Geophysical Research: Atmospheres 814
2881–98. 815
Pulido-Villena, E., Wagener, T., Guieu, C., 2008. Bacterial response to dust pulses in 816
the western Mediterranean: implications for carbon cycling in the oligotrophic 817
ocean. Global Biogeochemical Cycles 22, GB1020. 818
Putaud, J-P, Raes, F., Van Dingenen, R., Brüggemann, E., M.-C., Facchini, Decesari, 819
S., S. Fuzzi, Gehrig, R., Hugli, C., Laj, P., Lorbeer, G., Menhaut, W., 820
Mihalopoulos, N., Muller, K., Querol, X., Rodriguez, S., Schneider, J., Sprindler, 821
G., Brink, H., Torseth, K., Wiedensohler, A., 2004. A European Aerosol 822
phenomenology-2: Chemical Characteristics of Particulate Matter at Kerbside, 823
Urban, Rural and Background Sites in Europe. Atmospheric Environment 38, 824
2579–95. 825