HAL Id: hal-00316882
https://hal.archives-ouvertes.fr/hal-00316882
Submitted on 1 Jan 2001
HAL is a multi-disciplinary open access
archive for the deposit and dissemination of
sci-entific research documents, whether they are
pub-lished or not. The documents may come from
teaching and research institutions in France or
abroad, or from public or private research centers.
L’archive ouverte pluridisciplinaire HAL, est
destinée au dépôt et à la diffusion de documents
scientifiques de niveau recherche, publiés ou non,
émanant des établissements d’enseignement et de
recherche français ou étrangers, des laboratoires
publics ou privés.
tropical cirrus
Y. Bhavani Kumar, V. S. Siva Kumar, A. R. Jain, P. B. Rao
To cite this version:
Y. Bhavani Kumar, V. S. Siva Kumar, A. R. Jain, P. B. Rao. MST radar and polarization lidar
observations of tropical cirrus. Annales Geophysicae, European Geosciences Union, 2001, 19 (8),
pp.873-882. �hal-00316882�
Annales Geophysicae (2001) 19: 873–882 c European Geophysical Society 2001
Annales
Geophysicae
MST radar and polarization lindar observations of tropical cirrus
Y. Bhavani Kumar, V. Siva Kumar, A. R. Jain, and P. B. Rao
National MST Radar Facility, Gadanki 517 112, India
Received: 19 July 2000 – Revised: 7 May 2001 – Accepted: 28 June 2001
Abstract. Significant gaps in our understanding of global
cirrus effects on the climate system involve the role of fre-quently occurring tropical cirrus. Much of the cirrus in the atmosphere is largely due to frequent cumulus and convec-tive activity in the tropics. In the Indian sub-tropical region, the deep convective activity is very prominent from April to December, which is a favorable period for the formation of deep cumulus clouds. The fibrous anvils of these clouds, laden with ice crystals, are one of the source mechanisms for much of the cirrus in the atmosphere. In the present study, several passages of tropical cirrus were investigated by si-multaneously operating MST radar and a co-located polar-ization lidar at the National MST Radar Facility (NMRF),
Gadanki (13.45◦N, 79.18◦E), India to understand its
struc-ture, the background wind field and the microphysics at the cloud boundaries.
The lidar system used is capable of measuring the degree of depolarization in the laser backscatter. It has identified several different cirrus structures with a peak linear depo-larization ratio (LDR) in the range of 0.1 to 0.32. Simul-taneous observations of tropical cirrus by the VHF Doppler radar indicated a clear enhancement of reflectivity detected in the vicinity of the cloud boundaries, as revealed by the li-dar and are strongly dependent on observed cloud LDR. An inter-comparison of radar reflectivity observed for vertical and oblique beams reveals that the radar-enhanced reflectiv-ity at the cloud boundaries is also accompanied by significant aspect sensitivity. These observations indicate the presence of anisotropic turbulence at the cloud boundaries. Radar ve-locity measurements show that boundaries of cirrus are as-sociated with enhanced horizontal winds, significant verti-cal shear in the horizontal winds and reduced vertiverti-cal veloc-ity. Therefore, these measurements indicate that a circulation at the cloud boundaries suggest an entrainment taking place close to these levels. The analysis of simultaneous lidar and MST Radar observations can thus yield valuable information on the structure and dynamics of the cirrus, specifically near the boundaries of such clouds.
Correspondence to: A. R. Jain ([email protected])
Key words. Atmospheric composition and structure (cloud
physics and chemistry; instruments and technique) - Meteo-rology and atmospheric dynamics (tropical meteoMeteo-rology)
1 Introduction
Tropical cirrus usually originate from water transports in deep convective cloud systems that develop a wide range of upper level cloud types, including thick cumulus clouds directly tied to the convective cells, moderately thick non-precipitating anvils, and the thinner cirrus that are a fairly
ubiquitous feature of the tropics. Precipitating cumulus
clouds associated with deep convection are common at trop-ical latitudes. One of the distinguishing features of cumu-lonimbus clouds is that its upper portion is usually composed of ice and is spread out in the shape of a smooth, fibrous anvil. A layer of ice cloud often emanates from the anvils of cumulonimbus. It takes the form of cirrus spissatus if the cloud is thinner and patchier, or the form of cirrostra-tus cumulonimbogenicirrostra-tus, if thicker and widespread. In the Indian sub-tropical region, the Mesoscale Convective Sys-tems (MCS) are commonly observed from April to Decem-ber, which is a favorable period for the generation of tropical cirrus at upper tropospheric heights.
There is a significant gap in the understanding of the role of tropical cirrus in the overall global climate system. These high-level clouds dominate the cloud radiative forcing in the tropics (Ramanathan et al., 1989; Rossow and Schiffer, 1991) and influence the global heat balance (Liou, 1986; Sassen et al., 1989) and also affect the chemical composition of the upper tropical troposphere (Roumeau et al., 2000). A variety of modeling and theoretical studies suggest that the response of these clouds to external forcing might have a controlling effect on the global climate (Betts, 1990; Ramanathan and Collins, 1991; Del Genio et al., 1996; Randall et al., 1989). A sound knowledge of the height of occurrence and ice wa-ter content are the essential cloud paramewa-ters for climate modeling (Ramaswamy and Ramanathan, 1989). Dynami-cal processes, such as vertiDynami-cal motion associated wind shear
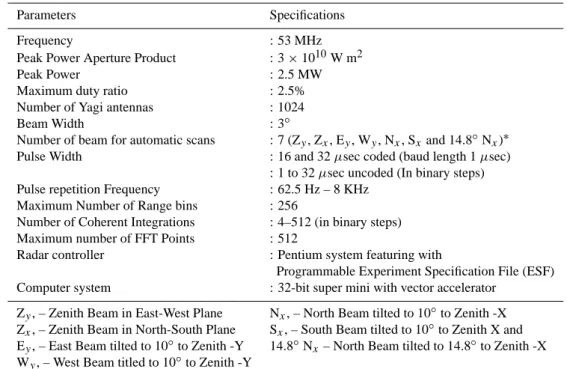
Table 1. Major specifications of the Indian MST radar system
Parameters Specifications
Frequency : 53 MHz
Peak Power Aperture Product : 3 × 10¹⁰W m2
Peak Power : 2.5 MW
Maximum duty ratio : 2.5% Number of Yagi antennas : 1024
Beam Width : 3◦
Number of beam for automatic scans : 7 (Zy, Zx, Ey, Wy, Nx, Sxand 14.8◦Nx)∗
Pulse Width : 16 and 32 µsec coded (baud length 1 µsec) : 1 to 32 µsec uncoded (In binary steps) Pulse repetition Frequency : 62.5 Hz – 8 KHz
Maximum Number of Range bins : 256
Number of Coherent Integrations : 4–512 (in binary steps) Maximum number of FFT Points : 512
Radar controller : Pentium system featuring with
Programmable Experiment Specification File (ESF) Computer system : 32-bit super mini with vector accelerator
Zy, – Zenith Beam in East-West Plane Nx, – North Beam tilted to 10◦to Zenith -X
Zx, – Zenith Beam in North-South Plane Sx, – South Beam tilted to 10◦to Zenith X and
Ey, – East Beam tilted to 10◦to Zenith -Y 14.8◦Nx– North Beam tilted to 14.8◦to Zenith -X
Wy, – West Beam titled to 10◦to Zenith -Y
and turbulence can effect the cloud formation and structure and, therefore, alter the radiation properties (Houze, 1993). There are many instrumental techniques for determining the altitude of cloud occurrence and the structure of the cirrus clouds, such as the lidars, mm wavelength radars and the satellites (height of occurrence only). Of these techniques, the lidar measurements are proven to be more precise (Platt, 1987). However, the ground lidars have a limitation in pro-viding the background wind field information.
In recent years, clear air radars such as MST radars, have been effectively used to study the background wind of the atmosphere. These radars make use of Bragg scattered sig-nals which arise from the refractive index irregularities as-sociated with gradients in temperature and humidity on the scale of half the radar’s wavelength (Gage, 1990; R¨ottger and Larsen, 1990). MST radars have been used to provide infor-mation about a wide range of atmospheric scales (Jasperson, 1982; Larsen and R¨ottger, 1982). One of the potential ap-plications of MST radars is the direct application of these systems in mesoscale meteorology. The objective of this pa-per is to present some typical observations of tropical cir-rus (non-precipitating ice cloud) using simultaneous Indian MST radar and a co-located lidar system. The Height-Time-Reflectivity maps show the excellent sensitivity of the radar system in detecting the cirrus boundaries. It is highlighted that the simultaneous radar and lidar observations give a bet-ter integrated picture of the structure, dynamics and micro-physics associated with the tropical cirrus.
2 Observations and discussion
The Indian MST Radar, which is a very sensitive coherent radar system, operating on 53 MHz with a peak power
aper-ture product of 3 × 10¹⁰ Wm2, employs a phased antenna
array consisting of two orthogonal sets of 1024 three
ele-ment Yagi (36 dB gain and 3◦half-power beam width) in a
32 × 32 grid covering an area of 130 m × 130 m. Thirty two transmitters, with peak powers ranging from 15 to 120 KW, with a total peak power of 2.5 MW, feed this array. Phase steering allows two beam-pointing directions at zenith and 4
beams in the oblique direction at 10◦off zenith in E, W, N
and S directions. A detailed system description of the Indian MST radar is given by Rao et al. (1995). The major specifi-cations of the Indian MST Radar system are given in Table 1. An experiment was conducted with six beams using 16 µsec coded pulse (with 1 µsec sub-pulse width, corresponding to a range resolution of 150 m) and 1 msec interpulse period, 128 coherent integrations and 256 FFT points. The radar Doppler spectra is subjected to standard moment analysis to obtain the zero, first and second moments. The zero moment gives the signal strength, which is related to radar reflectivity (η); the first moment gives the Doppler shift of the signal which is, in turn, used to obtain the radial velocity and the atmo-spheric wind field. The second moment gives the spectral width, which is related to the energy associated to the radar backscatterers within the observed radar range cell.
The main specifications of the Indo-Japanese Lidar (IJL) system used for the measurements are given in Table 2. This lidar system employs a transmitter consisting of a pulsed Nd: a YAG laser that operates at its second harmonic (532 nm) with a pulse repetition rate of 20 at a maximum energy of
Y. Bhavani Kumar et al: MST radar and polarization lidar observations of tropical cirrus 875
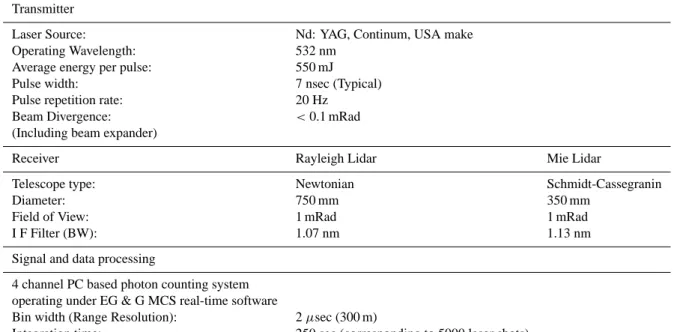
Table 2. Major specifications of the Indo-Japanese lidar system
Transmitter
Laser Source: Nd: YAG, Continum, USA make Operating Wavelength: 532 nm
Average energy per pulse: 550 mJ Pulse width: 7 nsec (Typical) Pulse repetition rate: 20 Hz
Beam Divergence: <0.1 mRad (Including beam expander)
Receiver Rayleigh Lidar Mie Lidar
Telescope type: Newtonian Schmidt-Cassegranin
Diameter: 750 mm 350 mm
Field of View: 1 mRad 1 mRad
I F Filter (BW): 1.07 nm 1.13 nm
Signal and data processing
4 channel PC based photon counting system operating under EG & G MCS real-time software
Bin width (Range Resolution): 2 µsec (300 m)
Integration time: 250 sec (corresponding to 5000 laser shots)
550 mJ per pulse. The lidar system is configured to oper-ate only in the vertical direction. It has two independent
receiving systems. One of these is a Rayleigh receiver,
which collects molecular backscatter in the height range of 30 – 80 km and the other one is a Rayleigh-Mie receiver, which operates in the height range of 4 to 40 km and col-lects backscatter from air molecules and aerosol/cloud parti-cles. The Rayleigh-Mie receiver comprises of a Cassegrain telescope with a clear aperture of 350 mm. An interference filter with a central wavelength of 532 nm and a bandwidth of 1.13 nm is used to reduce the background noise in the col-lected backscattered signal. A polarized beam splitter divides the collected laser backscatter returns into Co- and Cross-polarized signal components. Two identical low noise pho-tomultiplier tubes (HAMAMATSU R3234-01) are used as detectors for linear and orthogonal polarized backscattered signals. A PC-based photon-counting system is used as data acquisition and signal processor for the lidar signals with a range resolution of 300 m. A detailed system description is given elsewhere by Bhavani Kumar et al. (1999).
A photon-count profile corresponding to 5000-laser shot integration with a time resolution of 250 s constitutes the ba-sic lidar signal measurement. The background noise is es-timated for each measurement and subsequently subtracted from the signal for correction. The noise corrected signal is then subjected to range normalization and inversion (Fer-nald, 1984) to derive the cloud backscatter profile. Lidar
sig-nal strength is determined from the backscatter ratio (S(z)),
which is given by
S(z)=
βair(z) + βcloud(z)
βair(z)
(1)
where βair(z)and βcloud(z)are the air and cloud
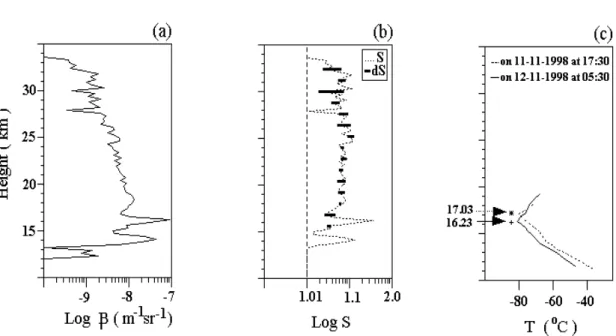
backscat-ter coefficients at altitude z. Radiosonde pressure and tem-perature data obtained from the nearest meteorological sta-tion, Chennai, southeast of the radar site approximately 125 km away, has been used for deriving the air molecular density data. Each lidar data profile was calibrated by per-forming a linear regression of the measured signal to a the-oretical molecular backscatter profile derived using the ra-diosonde data (Young, 1995). Figure 1a shows the height profile of the linear polarized attenuated backscatter co-efficient (β) obtained after integration of five basic lidar profiles of the co-polarized signal collected during the pe-riod from 00:51–01:12 hrs (IST) on 12 November 1998. The height profile of β in this panel indicates the returns from a weak cirrus presence in the height range of 14 and
16 km. The upper height cirrus appears just below the
tropical tropopause. The height structure of stratospheric aerosols, up to the height of 35 km, is also shown in this panel. There is no sharp enhancement observed at the strato-spheric heights. This confirms that during the time of present observations, the tropical upper troposphere and stratosphere over Gadanki appears free from volcanic aerosols and what we observe now is the background variable aerosols (Barnes and Hofmann, 1997). For clarify purposes, the panel (b) in Fig. 1 shows the height profile of the backscatter ratio (S) and the horizontal bars show the standard error (dS) in the measurements of (S) for a few sample heights. The lidar de-rived linear depolarization ratio LDR (z) is computed using the backscatter ratios of Co- and Cross-polarized signal com-ponents of the received backscatter. The parameter LDR (z) is defined as
LDR(z)=
S⊥(z)
Sk(z)
Fig. 1. Height profile of (a) Lidar co-polarized attenuated backscatter coefficient. (b) Attenuated backscatter ratio with error bars show two
cirrus returns one at 14 km and the other at 16 km in the vicinity of the tropopause and the above is the stratospheric aerosol. (c) Radiosonde temperature profiles obtained from the nearest meteorological station at 17:30 h IST on 11 November and 05:30 h IST on 12 November 1998. Arrows show that cold point tropopause is detected using these temperature measurements.
where the subscripts refer to perpendicular and parallel po-larized signal components. It may be noted here that higher values of LDR greater than air depolarization (0.014) indi-cate non-spherical particles, which are presumably ice
crys-tals (Bates, 1984). Panel (c) of Fig. 1 shows the height
profiles of atmospheric temperature measured by radiosonde
launched from Chennai (14.2◦N, 80.12◦E) at 17:30 (IST)
on 11 November 1998 and of 05:30 (IST) on 12 November 1998. The horizontal arrows indicate the height of the cold-point tropopause obtained from these temperature measure-ments.
2.1 Lidar observations
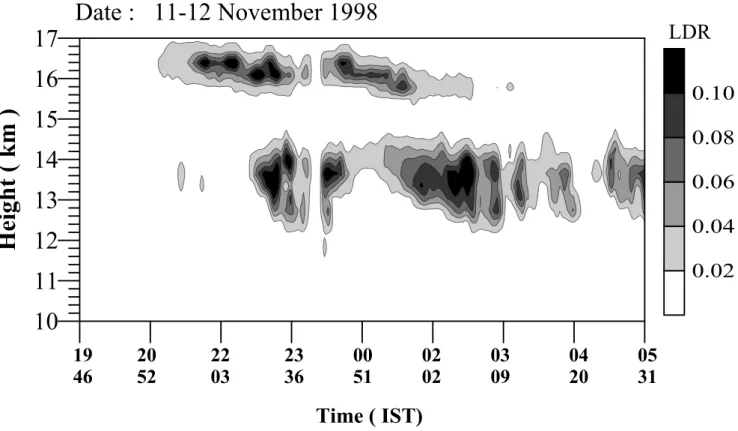
The Indo-Japanese lidar (IJL) system employs polarization diversity, a technique that enables the measurement of the de-gree of depolarization in the laser backscatter. This is a pow-erful proven technique for the study of cloud content, and is especially suited for determining the properties of high level clouds, such as cirrus. The major advantage of polarization diversity measurements lies in the ability of this technique in determining the shape of the particles, i.e. whether the par-ticles are the spherical or non-spherical type, thus making it possible to distinguish between water droplets and ice crys-tals (Sassen, 1994). A temporal mapping of LDR is the best means of tracing the ice cloud structures in the atmosphere, especially for clouds such as cirrus. The Indo-Japanese po-larization (IJL) lidar has detected several different structures of tropical cirrus in the altitude ranging from 10 to 17 km
with the derived peak linear depolarization ratio in the range of 0.1 to 0.32. The lidar investigations of two different tropi-cal cirrus structures observed on the nights of 11–12 Novem-ber and 28–29 DecemNovem-ber 1998 are taken as a case study for the discussion. The lidar observation of the cirrus system on 11–12 November 1998 is shown in Fig. 2. The figure shows two different layers of cirrus structures observed during their passage over the lidar site. A thin cirrus layer occurred in the altitude range of 16 to 16.5 km, which appeared to be very close to the tropical tropopause, and the same persisted for about 5 hrs. A maximum linear depolarization ratio of 0.22 is noted within this cirrus layer. Such layers are generally very thin, with very small optical depth. Hetero-molecular nucle-ation of aerosols at extremely cold temperatures of the equa-torial atmospheres could be the probable reason for the for-mation of such sub-visible type cloud structures, as discussed in detail by Jensen et al. (1996). These thin cirrus layers con-tribute significantly to the radiation budget and thereby to the warming of the atmosphere (Cess et al., 1990; Stephens and Greenwald, 1991).
The other cirrus layer is identified in the altitude range of 12 to 14 km, which is shown in Fig. 2 as patchy types of cirrus bands. A peak linear depolarization ratio of 0.17 is ob-served within these cirrus cloud bands. The radiosonde data obtained from the nearest meteorological station, Chennai, indicated that the mid-cloud temperatures are in the range
of −60 to −75◦C. The appearance of convective cumulus
Usu-Y. Bhavani Kumar et al: MST radar and polarization lidar observations of tropical cirrus 877
Time ( IST)
Date : 11-12 November 1998
10
11
12
13
14
15
16
17
He
ig
h
t (
km
)
0.02
0.04
0.06
0.08
0.10
19 20 22 23 00 02 03 04 05
46 52 03 36 51 02 09 20 31
LDR
Fig. 2. A Time-Height representation of the Linear Depolarization Ratio of tropical cirrus layers observed by polarization lidar on 11–12
November 1998.
ally the upper portion of the convective cumulus clouds is laden with ice that extends in the shape of a fibrous anvil, which at a later stage takes the form of cirrus. Much of the cirrus in the atmosphere, especially in the tropics, arises in this manner (Houze, 1993). These clouds are generally thick and usually appear in the form of fragmented structures with a characteristic extension of cloud base with time, as seen in the Fig. 2.
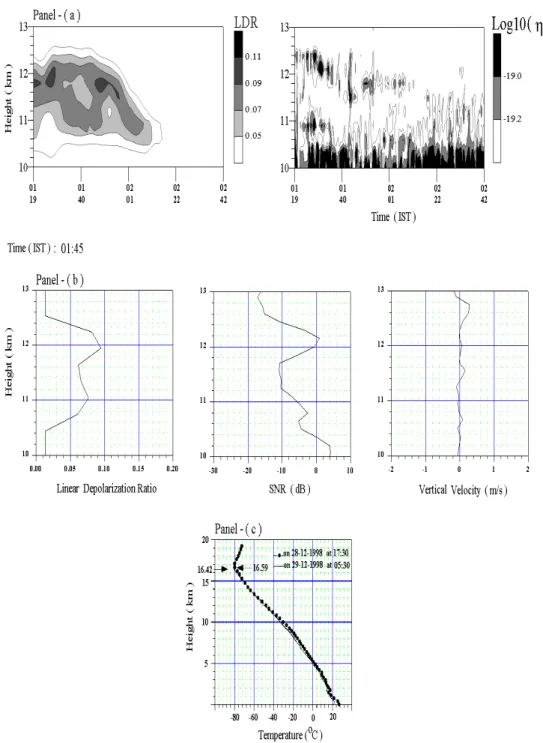
A lidar observation of cirrus on the night of 29 December is shown in Fig. 4. This figure contains three panels. Panel (a) of the figure shows the RTI maps drawn from continu-ous radar and lidar observations during the passage of cirrus. Panel (b) gives the height profile of cloud LDR, radar SNR and vertical velocity measured during the presence of cloud at 01:45 h (IST). Panel (c) of the figure provides the atmo-spheric temperature profiles and the local tropopause height obtained from radiosonde data at 17:30 h (IST) on 28 De-cember and 05:30 h (IST) on 29 DeDe-cember 1998 from the nearest meteorological station. On 29 December 1998, lidar detected a single cirrus layer in the altitude range of 10 to 13 km that moved over the site with an observed maximum linear depolarization ratio of 0.12. The layer mid-cloud
tem-peratures were noted to be about −40◦C (see panel (c) of
Fig. 4). It is also observed that the clouds occurring at lower heights (higher temperatures) have a lower volume depolar-ization than the clouds observed at higher altitudes (lower temperatures). It indicates that tropical cirrus cloud LDR is strongly dependent on the ambient temperature conditions
(Platt et al., 1998). The polarization lidar investigations at the Gadanki site reveal that low to moderate values of volume depolarization ratios are detected within the tropical cirrus clouds. These results are consistent with the earlier inves-tigations (Takahashi and Kuhura, 1993; Knollenberg et al., 1993; Heymsfield and McFarquhar, 1996) that reported trop-ical cirrus observed with low ice water content.
2.2 Radar observations
MST radar provides two independent measurements, the radar reflectivity and the wind circulation in terms of ver-tical and horizontal velocities. Enhanced radar reflectivity in the zenith direction arises either due to Fresnel reflec-tion/scattering from stable regions or due to backscattering from refractive index irregularities due to turbulence; the radar echoes observed at oblique beam, at an off zenith angle
10◦, are expected to arise primarily due to backscatter from
the turbulence induced refractive index irregularities (Tsuda et al., 1986; Hocking et al., 1990; Jain et al., 1997). En-hanced radar reflectivities observed for vertical beams gen-erally arise due to a strong gradient in the refractive index caused by a change in the atmosphere lapse rate (Larsen and R¨ottger, 1987; Gage, 1986; Gage, 1990; R¨ottger and Larsen, 1990; Hocking, 1996).
Radar observations of the passage of tropical cirrus over the site got two different events are discussed here. Radar measurements could only be taken for a limited period due
Table 3. Details of tropical cirrus passage over Gadanki site
Observation details Lidar observation Radar observation period period
Case 1.
(11/12 Nov. 1998) 19:46–05:31 02:07–03:17 h (IST) Case 2.
(28/29 Dec. 1998) 23:20–05:42 01:19–02:52 h (IST)
to certain operational constraints. The period of continuous radar measurements taken during the two events are shown in Table 3, as Cases 1 and 2. Radar observations obtained dur-ing these events are examined with reference to lidar cirrus observations, as discussed in following sections.
2.2.1 Observations of enhanced radar reflectivity
Range-Time-Intensity (RTI) contour maps are drawn using radar reflectivity (η) and the lidar depolarization ratio (LDR) for the two observational cases. The parameter η is com-puted using the observed vertical beam Signal-to-Noise ratio
(SNR)vert icalusing the equation
η = K r
2
Pt1r
(SN R)vert ical (3)
where K is the radar constant, 1r and r are the range
resolu-tion and range, and (SNR)vert ical is the SNR obtained with
the vertical beam. Substituting the value of K and taking 1r = 150 m, the equation (3) can be rewritten as (Ghosh et al., 2000; 2001)
log10(η) = −20.699 + log10r2
−log10Pt+0.1∗(SN R)dB (4)
where Pt is the peak transmitted power in watts.
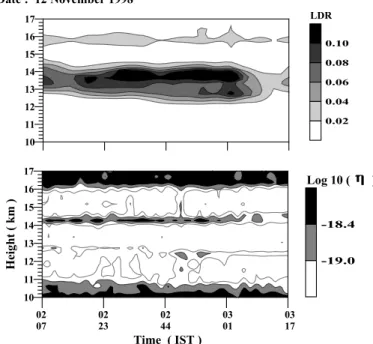
Case 1: Figure 3 presents the RTI map of a continuous radar and lidar observations, in vertical direction, taken dur-ing the time period from 02:07 h (IST) to 03:17 h (IST). During the period, the lidar cloud LDR temporal map shows two layers of cirrus, a thin cirrus layer at 16 km near the tropopause, and the other much below tropopause around 14 km. Radar data shows that both clouds occur at 14 and 16 km (Fig. 3). However, one can notice from this figure that the detection of the upper height cloud is ambiguous, because enhanced radar reflectivity due 16 km cannot be dis-tinguished clearly as it appears in the vicinity of tropopause. It should be mentioned here that radar reflectivity near the tropopause is high due to the presence of temperature inver-sion at that height. The radar observation of the 14 km cloud layer clearly shows an enhancement in the reflectivity near the locations of the cloud boundaries. The top boundary of the 14 km cloud can be seen very clearly due to enhanced radar reflectivity at these levels. The layer of radar-enhanced reflectivity is about 300 m thick and appears at the height of about 14.25 km, as seen in Fig. 3. This demonstrates the
LDR 10 11 12 13 14 15 16 17 0.02 0.04 0.06 0.08 0.10 Log 10 ( ) Date : 12 November 1998 10 11 12 13 14 15 16 17 Height ( km ) -19.0 -18.4 02 02 02 03 03 07 23 44 01 17 Time ( IST )
Fig. 3. Range-Time plot of radar reflectivity and lidar LDR during
the passage of cirrus on 12 November 1998 (Case 1). The X-axis represents the time scale in hrs, min.
ability of the radar for the detection of the cloud top. A reduction in cloud LDR is observed after 03:00 h (IST) on 12 November 1998 and the same is noticed as a decrease in the enhancement of the radar reflectivity as well. The radar identification of the cloud base was intermittent and not very clear.
Case 2: Panel (a) of Fig. 4 shows the radar and lidar inves-tigations of Case 2 obtained on 29 December 1998 during the period of simultaneous measurements from 01:19 hrs (IST) to 02:42 hrs (IST). Lidar data shows the detection of a single cirrus structure in the altitude range of 10–13 km. The cloud was observed initially for a period of 45 minutes over the site and later, no cloud was observed. The radar data shows an enhancement in the reflectivity detected in the vicinity of the cloud boundaries. In the absence of the cloud, as shown by lidar data, the radar data also indicates no enhancement in the reflectivity. During the presence of cloud, the observed enhancement in radar reflectivity (η) at the top boundary is almost continuous and the same is observed over a period of about 50 minutes from 01:19 hrs (IST) to 02:11 hrs (IST). A layer of enhanced reflectivity with a thickness of about 450 m can be clearly observed (see panel (b) of Fig. 4). The radar identification of cloud base was not very clear due to rela-tively weak reflectivity at these heights. A significant obser-vation is the radar detection of a decrease in cloud top height as seen by the lidar LDR map. Evaluation of the measure-ments carried out by the two instrumeasure-ments or the two events considered here, shows that the lidar and radar detection of the cloud top boundary is consistent.
Y. Bhavani Kumar et al: MST radar and polarization lidar observations of tropical cirrus 879
Fig. 4. Panel (a) Range-Time plot of radar reflectivity and lidar LDR during the passage of cirrus on 29 December 1998 (Case 2). The X-axis
represents the time scale in hrs, min. Panel (b) Height profiles of lidar LDR, radar SNR vertical beam and vertical velocity at 01:45 h (IST) on 29 December 1998 (Case 2) during the passage of cirrus over the site. Panel (c) Radiosonde temperature profiles obtained at 17:30 h (IST) on 28 December and 05:30 h (IST) on 29 December 1998. Arrows show that cold point tropopause is detected using these temperature measurements.
2.2.2 Aspect sensitivity of the radar reflectivity
measure-ments
Radar RTI maps do show distinct regions of enhanced reflectivity, very close to the location of cirrus cloud top,
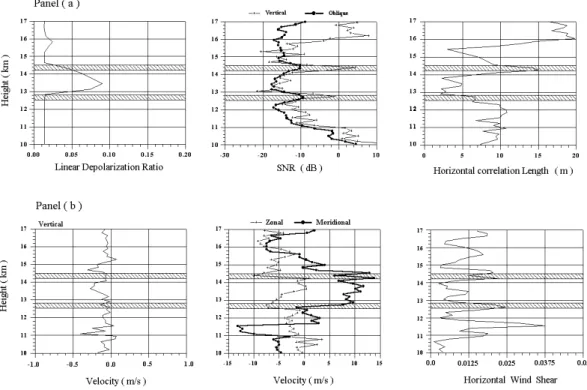
as detected by the lidar LDR. An intercomparison of radar detected SNR obtained in the vertical and oblique beam directions during the passage of cirrus for an observation time of 02:07 h (IST) on 12 November 1998 is presented in panel (a) of Fig. 5, along with the profile of the computed
Fig. 5. Panel (a) Height profiles of lidar LDR, radar vertical and oblique beam SNR and derived horizontal correlation lengths for Case 1.
The horizontal bands in this figure represent approximately the cloud boundaries as indicated by lidar LDR measurements. Panel (b) Height profiles radar vertical, zonal and meridional winds and computed vertical shear in horizontal winds for Case 1. The horizontal bands in this figure represent approximately the cloud boundaries as indicated by lidar LDR measurements.
horizontal correlation length (ζ ) obtained from the radar vertical and oblique beam reflectivity measurements using the standard method (Hocking, 1989; Hocking et al 1990; Lesicar et al 1994; Hooper and Thomas, 1995; Jain et al
1997). The parameter ζ gives an idea of the horizontal
length of scatterer and is given by
ζ = 15.2λ
θs
(5)
where λ is the radar wavelength and θs is the e−1half width
of the polar diagram of the radar backscatter expressed in
de-grees. Small values of θs mean large anisotropy and a value
close to 90 indicates purely isotropic scattering. The received signal intensity (SNR) at vertical and oblique beams is used
for the determination of θs.
The panel (a) of Fig. 5 shows measurements, taken at cloud top, which have a vertical beam SNR of about 10– 15 dB more than the oblique beam SNR, indicating signif-icant aspect sensitivity and the presence of anisotropic radar back-scatterers with a horizontal correlation length (ζ ) of 10– 15 m. This indicates that anisotropic backscattering is arising due to the presence of anisotropic refractive index structures near cloud upper boundary (Gage and Green, 1978; R¨ottger, 1980; Doviak and Zrnic, 1984; Hocking and Hamza, 1997). However, the presence of thin temperature sheets causing
partial reflection can also give rise to layers of enhanced re-flectivity, as reported by Dalaudier et al. (1994) and Luce et al. (1995) from their observations at lower stratospheric heights.
2.2.3 Radar velocity measurements
MST radar measures winds almost on a continuous basis with good height and time resolution. This allows for the measurement of winds at various scales. A comparison of radar and radiosonde measurements show an excellent match (Fukao et al., 1982; Jasperson, 1982).
Radar velocity measurements during the passage of cirrus for Case 1 are presented here. Panel (b) of Fig. 5 shows the measured velocities in vertical, zonal and meridional direc-tions during the passage of the cloud at 02:07 h (IST) on 12 November 1998, along with the profile of vertical shear in the horizontal winds, computed using radar measurements of the zonal and meridional winds. Radar velocity measurements show a reduction in vertical velocity and an enhancement in the horizontal winds, as seen during the passage of cirrus just near the cloud boundaries. Large vertical shear in the hori-zontal winds is noticed near the boundaries of the cirrus with a change in the wind speed and direction, as seen in panel (b) of Fig. 5. Therefore, these measurements show a circu-lation at the boundaries of the cloud with minimum vertical
Y. Bhavani Kumar et al: MST radar and polarization lidar observations of tropical cirrus 881 velocity (see also panel (b) of Fig. 4 in Case 2) and enhanced
horizontal winds accompanied by a significant change in the wind direction. This indicates the presence of entrainment close to the cirrus boundaries.
Shear driven entrainment can cause substantial mixing at the cloud boundaries. Convective mixing caused by entrain-ment is noticed near the stratified cloud tops with significant refractive index fluctuations (Jensen and Lenshow, 1978). As a result of entrainment, evaporation (condensation) above the cloud top (below the cloud base) can take place in an un-saturated environment by absorption (release) of latent heat. This causes the mixing of warm, dry, ambient air with cool air in the cloud. This mechanism will increase the gradient of the potential refractive index and accordingly enhance the re-flectivity either by increasing the turbulence refractive index structure constant or the partial reflection coefficient (Gos-sard and Strauch, 1983). The differential radiative heating at the cirrus boundaries due to IR can also cause local circula-tion (Liou, 1986). This also leads to an entrainment across the turbulently mixed cloud boundaries (Lilly, 1988; Houze, 1993). Nicholls and Leighton (1986) have reported that in most cases, the radiative cooling is balanced locally by the entrainment at the cloud top.
3 Conclusions
The Lidar system at the National MST Radar Facility has been used for the detection of tropical cirrus clouds in the al-titude range of 10–17 km. These cloud systems are observed with low to moderate LDR. MST radar is also used for simul-taneous observations of cirrus. Simulsimul-taneous measurements from two instruments show good agreement in the height of the cloud boundaries. The simultaneous lidar and radar ob-servations thus show that the MST radar can detect tropical cirrus boundaries, in particular, the top of the cloud. The radar is also used for the measurement of aspect sensitivity of the radar echoes from cloud boundaries. The measure-ments clearly indicate the presence of anisotropic refractive index structures near the upper boundary of cirrus.
Radar velocity measurements do show clearly that the boundaries of cirrus are associated in enhanced vertical shear of horizontal winds and the same is accompanied by a notice-able reduction in the vertical velocity. The horizontal winds are seen to be enhanced close to the cloud boundaries. Thus, a circulation is observed at cloud boundaries, indicating an entrainment is taking place at these levels. Simultaneous po-larization lidar and MST radar observations can thus yield valuable information on cirrus structure, dynamics and mi-crophysics associated with the tropical cirrus and the cloud boundaries. Simultaneous GPS- sonde/Radiosonde measure-ments would yield information on the temperature structure within the cloud and at the boundaries. This would further help in understanding the thermodynamical processes within the cloud and at the boundaries.
Acknowledgements. The National MST Radar Facility is operated
by Department of Space (DOS), Government of India with a partial
funding support from Council of Scientific and Industrial Research (CSIR). The lidar facility at NMRF is established and being oper-ated under a joint scientific collaboration programme between Min-istry of Posts and Telecommunication (MOPT)/Communications Research Laboratory (CRL), Japan and National MST radar Facil-ity. Authors would like to acknowledge the numerous contributions made by their colleagues at NMRF, Gadanki in establishment and operation of lidar facility at NMRF. One of the authors, V. Siva Kumar, is thankful to NMRF for providing visiting research fellow-ship. Authors would also like to thank Deputy Director General, Meteorology, Regional Meteorological Centre, Chennai for provid-ing the necessary radiosonde data used in this paper. Authors would also like to thank Prof. J. R¨ottger and the referees for their valuable suggestions on the original manuscript.
Topical Editor D. Murtagh thanks two referees for their help in evaluating this paper.
References
Barnes, J. E. and Hofmann, D. J., Lidar measurements of strato-spheric aerosol over Mauna Loa Observatory, Geophys. Res. Lett., 24, 1923–1926, 1997.
Bates, D. R., Rayleigh scattering by air, Planetary and Space Sci-ence, 32, 785–790, 1984.
Betts, A. K., Greenhouse warming and the tropical water budget. Bull. Amer. Meteor.Soc., 71, 1464–1465, 1990.
Bhavani Kumar, Y., Raghunath, K., Siva Kumar, V., Rao, P. B., Jain, A. R., Mizutani, K., Aoki, T., Yasui, M., and Itabe, T., NMRF-CRL Lidar system description and data processing, Proc. IRSI ‘99, Bangalore, India, 560–570, 1999.
Cess, R. D., Potter, L., Blanchet, J.-P., Boer, G. J., Del Genio, A. D., Deque, M., Dymnikov, V., Galin, V., Gates, W. L., Ghan, S. J., Kiehl, J. T., Lacis, A. A., LeTreut, H., Li, Z.-X., Liang, H.-Z., McAvaney, B. J., Meleshko, V. P., Mitchell, J. F. B., Mor-crette, J.-J., Randall, D. A., Rikus, L., Roeckner, E., Royer, J. F., Schlese, J., Sheinin, D. A., Slingo, A., Sokolov, A. P., Taylor, K. E., Washington, W. M., Wetherald, R. T., Yagai, I., and Zhang, M. H., Intercomparison and interpretation of climate feedback processes in 19 atmospheric general circulation models, J. Geo-phys. Res., 95, 16, 601–16, 615, 1990.
Dalaudier, F., Sidi, D., Croehet, M., and Vernin, J., Direct Evidence of “Sheets” in the atmospheric temperature field, J. Atmos. Sci., 51(2), 237–248, 1994.
Del Genio, A. D., Yao, M.-S., Kovari, W., and Lo, K. K.-W., A prognostic cloud water parameterization for global climate mod-els, J. Climate, 9, 270–304, 1996.
Doviak, R. J. and Zrnic, D., Reflection and scatter formula for anistropically turbulent air, Radio Sci., 19, 325–336, 1984. Fernald, F. G., Analysis of atmospheric lidar observations: some
comments, Appl. Opt., 23, 652–653, 1984.
Fukao, S., Sato, T., Yamasaki, N., Harper, R. M., and Kato, S., Winds measured by a UHF Doppler radar and rawinsondes com-parison made on twenty-six days (August–September 1977), at Arecibo, Puerto Rico, J. Appl. Meteor., 21, 1357–1363, 1982. Gage, K. S. and Green, J. L., Evidence for specular reflection from
monostatic VHF radar observations of the stratosphere, Radio Sci., 13, 991–1003, 1978.
Gage, K. S., Objective tropopause height determination of using low resolution VHF radar observations, J. Atmos. Ocean Tech., 3, 248–254, 1986.
and dynamics, Radar in Meteorology, D Atlas, Ed., Amer. Me-teor. Soc., 534–574, 1990.
Ghosh, A. K., Jain, A. R., and Siva Kumar, V., Characteristics of atmospheric winds, associated shear and turbulence: Indian MST Radar measurement during summer monsoon season, Indian. J. Radio and Space Phys., 29, 222–230, 2000.
Ghosh, A. K., Siva Kumar, V., Kishore Kumar, K., and Jain, A. R., VHF radar observation of atmospheric winds, associated shears and Cn2at a tropical location : Interdependence and seasonal pattern , Ann. Geophysicae, 19, 8, 965–973, 2001.
Gossard, E. E. and Strauch, R. G., Radar Observations of Clear Air and Clouds, Developments in Atmospheric Science, 14, Elsevier Science Publishers B. V., 1983.
Heymsfield, A. J. and McFarquahar, G. M., High albedoes of cirrus in the Tropical Pacific Warm Pool: Microphysical interpretation CEPEX and from Kwajalein, Marshall Islands, J. Atmos. Sci., 53, 2424–2541, 1996.
Houze, R. A., Jr., Cloud dynamics, International geophysics series, 53, Academic press, 1993.
Hocking, W. K., Target parameter estimation , In: S. Fucko (Ed.), Handbook for MAP, Vol 30, pp 228–268, Pub. SCOSTEP Secre-tariat, University of Illinois 61801, USA, 1989.
Hocking, W. K., Fuckao, S., Tsuda, T., Yamamota, M., Sato, T., and Kato, S., Aspect sensitivity of stratospheric VHF radar scatterers, particularly above 15 km altitude, Radio Sci., 25, 613–627, 1990. Hocking, W. K., An assessment of the capabilities and limitations of radars in measurments of upper atmosphere turbulence, Adv. Space. Res., 17, (11) 37–(11) 41, 1996.
Hocking, W. K. and Hamza, A. M., A quantitative measure of the degree of anisotropy of turbulence interms of atmospheric pa-rameters, with particular relevance to radar studies, J. Atmos. Sol. Terr. Phys., 59, 1011–1020, 1997.
Hooper, D. A. and Thomas, L., Aspect sensitivity of VHF scatterers in the troposphere and stratosphere from comparison of power in off vertical beams, J. Atmos. Solar. Terr. Phys., 57, 665–673, 1995.
Jain, A. R., Jaya Rao, Y., and Rao, P. B., Aspect sensitivity of the re-ceived radar backscatter at VHF: Preliminary observations using the Indian MST radar, Radio Sci., 32, 1249–1260, 1997. Jasperson, W. H., Mesoscale time and space wind variability, J.
Appl. Meteor., 21, 831–839, 1982.
Jenson, N. O. and Lenshow, D. H., An observational investigation of penetrative convection, J. Atmos. Sci., 35, 1924–1933, 1978. Jensen, E. J., Toon, O. B., Selkirk, H. B., Spinhirne, J. D., and
Schoeberl, M. R., On formation and persitence of subvisible cir-rus clouds near the tropical tropopause, J. Geophys. Res., 101, 21, 361–21, 375, 1996.
Knollenberg, R. G., Kelly, K., and Wilson, J. C., Measurements of high number densities of ice crystals in the tops of tropical cumulonimbus, J. Geophys. Res., 98, 8639–8664, 1993. Larsen, M. F. and J. R¨ottger, J., VHF and UHF Doppler radars as
tools for synoptic research, Bull. Amer. Meteor. Soc., 63, 996– 1008, 1982.
Larsen, M. F. and R¨ottger, J., Observations of thunderstorm reflec-tivities and Doppler velocities measured at VHF and UHF, J. At-mos. and Ocean Tech., 4, 151–159, 1987.
Lesicar, D., Hocking, W. K., and Vincent, R. A., Comparative stud-ies of scatterers observed by MF radars in the southern hemi-sphere mesohemi-sphere, J. Atmos. Terr. Phys, 56, 581–591, 1994. Liou, K.-N., Influence of cirrus clouds on weather and climate
pro-cesses, Mon. Wea. Rev., 114, 1167–1199, 1986.
Lilly, D. K., Cirrus outflow dynamics, J. Atmos. Sci., 45, 1594– 1605, 1988.
Luce, H., Croehet, M., Dalaudier, F., and Sidi, C., Interpretation of VHF radar vertical echoes from in situ temperature sheet obser-vation, Radio Sci., 30, 1003–1025, 1995.
Nicholls, S. and Leighton, J., An observational study of the struc-ture of stratiform cloud streets. Part-I: Strucstruc-ture, Q. J. R. Meteo-rol. Soc., 112, 431–460, 1986.
Platt, C. M. R., Scott, J. C., and Dilley, A. C., Remote sounding of high clouds IV: Optical properties of mid-latitude and tropical cirrus, J. Atmos. Sci., 44, 729–747, 1987.
Platt, C. M. R., Young, S. A., Manson, P. J., Peterson, G. R., Mars-den, S. C., Austin, T., and Churnside, J. H., The optical properties of equatorial cirrus from observations in the ARM pilot radiation observation experiment, J. Atmos. Sci., 55, 1977–1996, 1998. Rao, P. B., Jain, A. R., Kishore, P., Balamuralidhar, P., Damle, S. H.,
and Viswanathan, G., Indian MST Radar Part-I: System descrip-tion and sample wind vector measurements in ST mode, Radio Sci., 30, 1125–1138, 1995.
Ramanathan, V., Cess, R. D., Harrison, E. F., Minnis, P., Barkstrom, B. R., Ahmad, E., and Hartmann, C., Cloud-radiative forcing and climate: Results from the Earth Radiation Budget Experiment. Science, 243, 57–63, 1989.
Ramanathan, V. and Collins, W., Thermodynamic regulation of ocean warming by cirrus clouds deduced from the 1987 El Nino. Nature, 351, 27–32, 1991.
Randall, D. A., Harshvardhan, Dazlich, D. A., and Corsetti, T. G., Interactions Among Radiation, Convection, and Large-Scale Dy-namics in a General Circulation Model, J. Atmos Sci., 46, 1943– 1970, 1989.
Ramaswamy, V. and Ramanathan, V., Solar absorption by cirrus clouds and maintenance of the tropical upper troposphere ther-mal structure, J. Atmos Sci., 46, 2293–2310, 1989.
Rossow, W. B. and Schiffer, R. A., ISCCP cloud data products, Bull. Amer. Meteor. Soc., 72, 2–20, 1991.
Roumeau, S., Bremaud, P., Riviere, E., Baldy, S., and Baray, J. L., Tropical cirrus: A possible sink for ozone, Geophys. Res. Lett., 27, 2233–2236, 2000.
R¨ottger, J., Reflection and scattering of VHF radar signals from at-mospheric refractivity structures, Radio Sci., 15, 259–276, 1980. R¨ottger, J. and Larsen, M. F., UHF/VHF radar techniques for atmo-spheric research and wind profiler applications, Radar in Meteo-rology, edited by D. Atlas, pp. 235–281, American Meteorologi-cal Society, Boston, Mass., 1990.
Sassen, K., Griffen, M. K., and Dodd, G. C., Optical scattering and microphysical properties of subvisual cirrus clouds, and climatic implications, J. Appl. Meteor., 28, 91–98, 1989.
Sassen, K., Advances in Polarization Lidar for Cloud Remote Sens-ing, Proc. IEEE, 82, No. 12, 1907–1914, 1994.
Stephens, G. L. and Greenwald, T. J., The Earth’s radiation bud-get and its relation to atmospheric hydrology: 2. Observations of cloud effects, J. Geophys. Res., 96, 15, 325–340, 1991. Tsuda, T., Sato, T., Hirose, K., Fukao, S., and Kato, S., MU radar
observations of the aspect sensitivity of backscattered VHF echo power in the troposphere and lower stratosphere, Radio Sci., 21, 971–980, 1986.
Takahashi, T. and Kuhara, K., Precipitation Mechanism of cumu-lonimbus clouds at Pohnpei, Micronesia, J. Meteor. Soc. Japan, 71, 21–31, 1993.
Young, S. A., Analysis of lidar backscatter profiles in optical thin clouds, Appl. Opt., 34, 7019–7031, 1995.
![[PDF] Cours Word avec exemples : Insérer un tableau | Cours informatique](data:image/gif;base64,R0lGODlhAQABAIAAAP///wAAACH5BAEAAAAALAAAAAABAAEAAAICRAEAOw==)