HAL Id: hal-00297932
https://hal.archives-ouvertes.fr/hal-00297932
Submitted on 5 Nov 2007HAL is a multi-disciplinary open access
archive for the deposit and dissemination of sci-entific research documents, whether they are pub-lished or not. The documents may come from teaching and research institutions in France or abroad, or from public or private research centers.
L’archive ouverte pluridisciplinaire HAL, est destinée au dépôt et à la diffusion de documents scientifiques de niveau recherche, publiés ou non, émanant des établissements d’enseignement et de recherche français ou étrangers, des laboratoires publics ou privés.
Availability of phosphate for phytoplankton and bacteria
and of labile organic carbon for bacteria at different
pCO2 levels in a mesocosm study
T. Tanaka, T. F. Thingstad, T. Løvdal, H.-P. Grossart, A. Larsen, K. G.
Schulz, U. Riebesell
To cite this version:
T. Tanaka, T. F. Thingstad, T. Løvdal, H.-P. Grossart, A. Larsen, et al.. Availability of phosphate for phytoplankton and bacteria and of labile organic carbon for bacteria at different pCO2 levels in a mesocosm study. Biogeosciences Discussions, European Geosciences Union, 2007, 4 (6), pp.3937-3960. �hal-00297932�
BGD
4, 3937–3960, 2007Availability of phosphate and labile
organic carbon T. Tanaka et al. Title Page Abstract Introduction Conclusions References Tables Figures ◭ ◮ ◭ ◮ Back Close
Full Screen / Esc
Printer-friendly Version Interactive Discussion
EGU
Biogeosciences Discuss., 4, 3937–3960, 2007 www.biogeosciences-discuss.net/4/3937/2007/ © Author(s) 2007. This work is licensed
under a Creative Commons License.
Biogeosciences Discussions
Biogeosciences Discussions is the access reviewed discussion forum of Biogeosciences
Availability of phosphate for
phytoplankton and bacteria and of labile
organic carbon for bacteria at different
pCO
2
levels in a mesocosm study
T. Tanaka1,*, T. F. Thingstad1, T. Løvdal1,**, H.-P. Grossart2, A. Larsen1, K. G. Schulz3, and U. Riebesell3
1
Marine Microbiology Res. Group (MMRG), Dept. of Biology, Univ. Bergen, Bergen, Norway
2
Leibniz Institute for Freshwater Ecology and Inland Fisheries (IGB-Neuglobsow), Department of Limnology of Stratified Lakes, Alte Fischerhuette 2, 16775 Stechlin, Germany
3
Leibniz Inst. for Marine Sciences (IFM-GEOMAR), D ¨usternbrooker Weg 20, 24105 Kiel, Germany
*
now at: Laboratoire d’Oc ´eanographie et de Biog ´eochimie, UMR6535-CNRS, Centre d’Oc ´eanologie de Marseille, Campus de Luminy-Case 901, 13288 Marseille CEDEX09, France
**
now at: Faculty of Science and Technology, Department of Mathematics and Natural Sciences, University of Stavanger, 4036 Stavanger, Norway
Received: 17 October 2007 – Accepted: 21 October 2007 – Published: 5 November 2007 Correspondence to: T. Tanaka ([email protected])
BGD
4, 3937–3960, 2007Availability of phosphate and labile
organic carbon T. Tanaka et al. Title Page Abstract Introduction Conclusions References Tables Figures ◭ ◮ ◭ ◮ Back Close
Full Screen / Esc
Printer-friendly Version Interactive Discussion
EGU
Abstract
Availability of phosphate for phytoplankton and bacteria and of labile organic carbon for bacteria at different pCO2levels were studied in a mesocosm experiment (PeECE III).
Using nutrient-depleted SW Norwegian fjord waters, three different levels of pCO2(350
µatm: 1×CO2; 750 µatm: 2×CO2; 1050 µatm: 3×CO2) were set up, and nitrate and
5
phosphate were added at the start of the experiment in order to induce a phytoplankton bloom. Despite similar responses of total particulate P concentration and phosphate turnover time at the three different pCO2levels, the size distribution of particulate P and
33PO
4uptake suggested that phosphate transferred to the >10 µm fraction was greater
in the 3×CO2 mesocosm during the first 6–10 days when phosphate concentration
10
was high. During the period of phosphate depletion (after Day 12), specific phosphate affinity and specific alkaline phosphatase activity (APA) suggested a P-deficiency (i.e. suboptimal phosphate supply) but not a P-limitation for the phytoplankton and bacterial community at the three different pCO2levels. Although specific phosphate affinity and
specific APA tended to be higher in 3×CO2than in 2×CO2and 1×CO2mesocosms
dur-15
ing the phosphate depletion period, no statistical differences were found. Responses of specific glucose affinity for bacteria were similar at the three different pCO2 levels.
Measured specific glucose affinities were consistently much lower than the theoretical maximum predicted from the diffusion-limited model, suggesting that bacterial growth was not limited by the availability of labile dissolved organic carbon. These results
sug-20
gest that availability of phosphate and glucose was similar at the three different pCO2
levels.
1 Introduction
Rising atmospheric CO2concentration changes seawater carbonate chemistry by low-ering seawater pH, carbonate ion concentration and carbonate saturation state, and
25
BGD
4, 3937–3960, 2007Availability of phosphate and labile
organic carbon T. Tanaka et al. Title Page Abstract Introduction Conclusions References Tables Figures ◭ ◮ ◭ ◮ Back Close
Full Screen / Esc
Printer-friendly Version Interactive Discussion
EGU
emissions continue to rise on current trends (business as usual), the world oceans will suffer an estimated pH drop of about 0.5 units, which is equivalent to a 3 fold in-crease in the concentration of hydrogen ions, until the year 2100 (Wolf-Gladrow et al., 1999; Caldeira and Wickett, 2003). While the magnitude of ocean acidification can be predicted with a high level of confidence, its impact on marine organisms, their
ecosys-5
tems, and biogeochemical cycling are largely unknown.
Studies dealing with biological responses to increasing CO2partial pressure (pCO2) and related changes in carbonate chemistry range from a single-species level in labora-tory cultures up to a semi-natural community level in outdoor mesocosms. These stud-ies show that increasing pCO2enhances photosynthetic carbon fixation (Zondervan et
10
al., 2001; Leonardos and Geider, 2005) and release of dissolved carbohydrates by phy-toplankton (Engel et al., 2004), and also modifies phyphy-toplankton species composition and succession (Tortell et al., 2002). These pCO2dependent changes in phytoplankton parameters further enhance growth rate, production as well as α- and β-glucosidase activity of heterotrophic bacteria, especially of attached bacteria (Grossart et al., 2006).
15
On the other hand, no significant increase in primary production (Tortell et al., 2002; Sciandra et al., 2003; Delille et al., 2005), total phytoplankton biomass (Tortell et al., 2002), and total bacterial biomass (Rochelle-Newall et al., 2004, Grossart et al., 2006) have been detected at increasing pCO2levels.
The elemental composition (e.g. C, N, P) in living organisms is to a certain extent
20
constrained by the necessity to maintain their metabolism (homeostasis) as compared to the rest of the material world (reviewed by Sterner and Elser, 2002). Changes in pCO2 dependent carbon production by phytoplankton and bacteria (see above) may alter their nutrient demands. On a global scale, these pCO2 dependent changes will greatly influence carbon and nutrient cycling in the ocean. However, significant
differ-25
ences in consumption ratio of various inorganic nutrients due to increasing pCO2levels have been found in one study (Tortell et al., 2002) but not in an other one (Engel et al., 2005). In this context, changes in nutrient availability for phytoplankton and bacteria at different pCO2levels seem to be unclear and, thus need to be investigated in greater
BGD
4, 3937–3960, 2007Availability of phosphate and labile
organic carbon T. Tanaka et al. Title Page Abstract Introduction Conclusions References Tables Figures ◭ ◮ ◭ ◮ Back Close
Full Screen / Esc
Printer-friendly Version Interactive Discussion
EGU
detail.
Nutrient availability (e.g. deficiency, limitation) is not necessarily easy to be ex-amined especially for natural communities of phytoplankton and bacteria. A recent study suggests that the specific affinity for phosphate uptake and the specific alkaline phosphatase activity (APA), which are phosphate uptake rates (inverse of phosphate
5
turnover times) and APA, respectively, normalized to the summed biomass of phyto-plankton and bacteria, are useful to examine phosphate availability for the natural phy-toplankton and bacteria community in different P starved aquatic systems (Tanaka et al., 2006). Similarly, specific affinity for glucose uptake, which is glucose uptake rates (inverse of glucose turnover times) normalized to bacterial biomass, can be useful to
10
examine the availability of labile organic carbon for bacteria (Tanaka et al., 20071). The objective of the present study is to examine how the availability of phosphate for phytoplankton and bacteria and of labile organic carbon for bacteria changes at different pCO2 levels during a mesocosm experiment. Particulate P concentrations,
turnover times of phosphate and glucose, and APA were measured during the
experi-15
ment. Combining these results with biomass measurements of phytoplankton and bac-teria (Paulino et al., 2007; Schulz et al., 20072), we have analyzed specific phosphate affinity, specific APA, and specific glucose affinity.
1
Tanaka, T., Thingstad, T. F., Cardel ´us, C., Jezbera, J., Lekunberri, I., Sala, M. M., Urein, F., and Gasol, J. M.: Production of non-labile DOC in the microbial food web by excessive addition of nitrogen and labile organic carbon to P-starved coastal waters, in preparation, 2007.
2
Schulz, K. G., Riebesell, U., Bellerby, R. G. J., Biswas, H., Meyerh ¨ofer, M., M ¨uller, M. N., Egge, J. K., Nejstgaard, J. C., Neill, C., Wohlers, J., and Zllner, E.: Build-up and decline of organic matter during PeECE III, Biogeosciences Discuss., in preparation, 2007.
BGD
4, 3937–3960, 2007Availability of phosphate and labile
organic carbon T. Tanaka et al. Title Page Abstract Introduction Conclusions References Tables Figures ◭ ◮ ◭ ◮ Back Close
Full Screen / Esc
Printer-friendly Version Interactive Discussion
EGU
2 Materials and methods
2.1 Experimental setup and sampling
The experimental setup and sampling has been described in detail elsewhere (Riebe-sell et al., 2007; Schulz et al., 20072). Briefly, the mesocosm experiment was carried out at the Espegrend Marine Biological Station (University of Bergen, Norway) from 15
5
May to 9 June 2005. Nine mesocosms (polyethylene, ca. 25 m3, 9.5 m water depth) were filled with unfiltered, nutrient-poor, post-bloom fjord water, and were covered by gas-tight tents (ETFE foil). Three different CO2 concentrations, 350 µatm (1×CO2),
700 µatm (2×CO2), and 1050 µatm (3×CO2), were set up in triplicates by CO2
aera-tion (see Engel et al., 2005 for details). To induce the development of a phytoplankton
10
bloom, nitrate and phosphate were added before the start of the experiment (Day −1) to obtain initial concentrations of 14 µmol L−1NO
3and 0.7 µmol L−1PO4. A tube sampler
(5 m long, 10 cm diameter) was used to collect integrated samples (0–5 m). Samples for particulate P, turnover times of glucose and phosphate, and APA were taken from three mesocosms, M2 (1×CO2), M5 (2×CO2), and M8 (3×CO2).
15
2.2 Particulate P
Particulate P samples were size-fractionated in triplicates on polycarbonate filters (47 mm diameter) with 10, 5, 1, and 0.2 µm pore sizes, respectively. Filters were trans-ferred to polycarbonate test tubes with 5 ml of Milli-Q water and oxidized by acid persul-phate at 121◦C. Liberated P was spectrophotometrically measured (Koroleff, 1983). As
20
the mean coefficient of variation was 14% for the >10 µm fraction, 10% for the >5 µm fraction, 11% for the >1 µm and >0.2 µm fractions (n=24 for each fraction), only the mean concentrations were shown for simplicity.
BGD
4, 3937–3960, 2007Availability of phosphate and labile
organic carbon T. Tanaka et al. Title Page Abstract Introduction Conclusions References Tables Figures ◭ ◮ ◭ ◮ Back Close
Full Screen / Esc
Printer-friendly Version Interactive Discussion
EGU
2.3 Uptake of33PO4and14C-glucose
Uptake rate of orthophosphate was measured using33P-orthophosphate (Thingstad et al., 1993). Carrier-free 33P-orthophosphate (Amersham, 370 MBq ml−1) was added
to 12 ml samples in 15 ml sterile Nunc test tubes to give a final radioactivity of ∼105 counts per minute ml−1. Samples for subtraction of background and abiotic adsorption
5
were fixed with 100% TCA before isotope addition. Samples were incubated under subdued (laboratory) illumination at in situ temperature. Incubation time was short enough to assure a linear relationship between the fraction of isotope adsorbed vs. the incubation time but it was long enough to reliably detect isotope uptake above back-ground levels. Incubation was stopped by a cold chase of 100 mmol L−1KH2PO4(final
10
conc. 1 mmol L−1). Subsamples were filtered in parallel on 25 mm polycarbonate filters with 10, 5, 1, and 0.2 µm pore sizes, which were placed on a Millipore 12 place mani-fold and supported on Whatman (GF/C) glass fiber filters saturated with 100 mmol L−1
KH2PO4. After filtration, filters were placed in polyethylene scintillation vials with Ultima Gold (Packard), and radio-assayed. After the radioactivities of the filter were corrected
15
for those of the blank filter obtained from fixed samples, T[PO4] (h) was calculated as
T[PO4]=−t/ln(1−f ) where f is the fraction (no dimension) of added isotope collected on
the 0.2 µm filter after the incubation time (t:h).
Uptake of glucose was measured in 20 ml samples incubated with D-[U-14C]-glucose (Amersham, 7.4 MBq ml−1) (Hobbie and Crawford, 1969 modified by Havskum et al.,
20
2003). After 1 h of incubation under subdued (laboratory) illumination at in situ temper-ature, the sample was split into two. Particulate14C (>0.2 µm) uptake was measured on 10 ml samples filtered on 0.2 µm pore size cellulose nitrate filters, and 14C-CO2 was absorbed on 25 mm Whatman (GF/F) glass fiber filters with 250 µl phenetylamine fixed inside the cap of 20 ml polyethylene scintillation vials containing 10 ml. Filters
25
were placed in polyethylene scintillation vials with Ultima Gold (Packard), and radio-assayed. Turnover time of glucose was calculated as the inverse of the fraction of added isotope consumed per hour. The measurement could not be done between
BGD
4, 3937–3960, 2007Availability of phosphate and labile
organic carbon T. Tanaka et al. Title Page Abstract Introduction Conclusions References Tables Figures ◭ ◮ ◭ ◮ Back Close
Full Screen / Esc
Printer-friendly Version Interactive Discussion
EGU
Days 0–3 due to a technical problem.
2.4 Calculation of specific affinity for phosphate and glucose uptake
Under the assumption that a community of phosphate users (i.e. bacteria and phy-toplankton) consists of a set of n groups with biomass Bi (nmol-P L−1: i =1, . . . , n),
and all of which take up PO4proportional to phosphate concentration (S[PO4]: nmol-P
5
L−1) and to each biomass, one has α
[PO4]iS[PO4]Bi=fiV[PO4], where α[PO4]i is the
spe-cific affinity for PO4uptake (L nmol-P−1h−1) by osmotroph group i and fi is the fraction (no dimension) of total uptake V[PO4]that goes into osmotroph group i (Thingstad and Rassoulzadegan, 1999). Since the sum of PO4 uptake equals to V[P O4] (sum of fi=1) and PO4turnover time is the ratio between the phosphate concentration and the P flux
10
through this pool (T[PO4]=S[PO4]/V[PO4]), one obtains n X i =1 α[PO4]iBi = V[PO4] S[PO4] = 1 T[PO4] (1)
Then, the total specific uptake rate (h−1) (Eq. 1) can be normalized to total biomass of bacteria and phytoplankton (B), and is defined as specific affinity for PO4uptake by the
osmotroph community (αe[PO4]: hereafter, specific PO4affinity):
15 αe [PO4]= n P i =1 α[PO4]iBi n P i =1 Bi = V[PO4] S[PO4]B = 1 T[PO4]B (2)
Specific affinity for glucose (αe[Glu]: L nmol-P−1 h−1) by bacteria is defined as
αe
[Glu] =
1
T[Glu]BBAC (3)
BGD
4, 3937–3960, 2007Availability of phosphate and labile
organic carbon T. Tanaka et al. Title Page Abstract Introduction Conclusions References Tables Figures ◭ ◮ ◭ ◮ Back Close
Full Screen / Esc
Printer-friendly Version Interactive Discussion
EGU
where T[Glu] is the function of glucose concentration (S[Glu]: nmol-glucose L−1) and its
flux (V[Glu]: nmol-glucose L−1 h−1) through this pool (T
[Glu]=S[Glu]/V[Glu]) and BBAC is
bacterial biomass (nmol-P L−1). Since all mesocosms were P-depleted rather than labile organic carbon depleted (see Results) and we wanted to unify the unit of specific affinity, specific glucose affinity was expressed in the unit of P.
5
To calculate P-biomass, data on bacterial abundance and Chla were used (Paulino et al., 2007; Schulz et al., 20072). Bacterial abundance and Chla were converted to C-biomass under the assumption that bacterial carbon content is 20 fg C cell−1 (Lee
and Fuhrman, 1987) and C: Chla (w:w) is 30 (w:w), respectively. Fixed C:P molar ra-tios of 106 for phytoplankton (Redfield et al., 1963) and 50 for bacteria (Fagerbakke
10
et al., 1996) were used to calculate P biomass of bacteria and phytoplankton, respec-tively. Although C:P ratios are variable for both phytoplankton and bacteria (e.g. Fager-bakke et al., 1996; Geider and La Roche, 2002), we applied the average C:P ratios for phytoplankton and bacteria. This is because direct measurement of P biomass of osmotrophs was not done in this study (see Results and Discussion for potential biases
15
by these fixed ratios).
2.5 Alkaline phosphatase activity
APA was measured fluorometrically using 3-0-methylfluorescein-phosphate as sub-strate (Perry, 1972). Samples were mixed with the subsub-strate solution in 0.1 mol L−1
Trizma-HCl pH 8.3 (final concentration 0.1 µmol L−1). Fluorescence was measured
20
just after the addition of the substrate solution and at two or three subsequent times ac-cording to the fluorescence increase. After correcting fluorescence values of samples to those of autoclaved samples, APA (nmol-P L−1h−1) was calculated by using a linear regression of fluorescence values versus incubation time. The APA measurement was done only for the period with low concentrations of soluble reactive phosphorus (SRP)
25
(Days 10–25: Schulz et al., 20072). As APA is derepressed when cellular P falls be-low a certain threshold level (e.g. Fitzgerald and Nelson, 1966; Rhee, 1973; Myklestad
BGD
4, 3937–3960, 2007Availability of phosphate and labile
organic carbon T. Tanaka et al. Title Page Abstract Introduction Conclusions References Tables Figures ◭ ◮ ◭ ◮ Back Close
Full Screen / Esc
Printer-friendly Version Interactive Discussion
EGU
and Sakshaug, 1983) and biomass of phytoplankton and bacteria were variable with time and between mesocosms, biomass-specific APA (h−1) was calculated by dividing
APA by estimated P biomass of osmotrophs (nmol-P L−1). Measurements of APA and phytoplankton biomass were not always synchronized due to logistic constraint. To calculate specific APA, Chla values on Days 19, 21, and 23 (Data from Schulz et al.,
5
20072) and APA values on Day 24 were linearly interpolated. 2.6 Statistical analysis
Analysis of covariance (ANCOVA) was done using the R software (http://www.r-project.
org/) with log-transformation of all data. Experimental day was used as the covariate and pCO2was used as the nominal predictor. Simple linear regression (Model I) was
10
used to describe the relationship between specific glucose affinity and dissolved or-ganic carbon (DOC: Data from Schulz et al., 20072). As the temporal variations of these parameters were similar between the three mesocosms (see Results and Dis-cussion), all data except on Day 4 were pooled for the correlation analysis. Statistical significance of linear regression was tested by F -test.
15
3 Results and discussion
In this study, samples were taken only from one mesocosm of each pCO2 level (M2, M5, and M8) because of logistic constraints. Since no significant differences between samples of each pCO2 level were found for temporal changes in inorganic and or-ganic nutrients, biomass and production of phytoplankton and bacteria (ANCOVA test,
20
BGD
4, 3937–3960, 2007Availability of phosphate and labile
organic carbon T. Tanaka et al. Title Page Abstract Introduction Conclusions References Tables Figures ◭ ◮ ◭ ◮ Back Close
Full Screen / Esc
Printer-friendly Version Interactive Discussion
EGU
P>0.05: Allgaier et al., 20073; Egge et al., 20074; Paulino et al., 2007; Schulz et al., 20072), we assume that the three mesocosms selected in this study were representa-tive for each pCO2level.
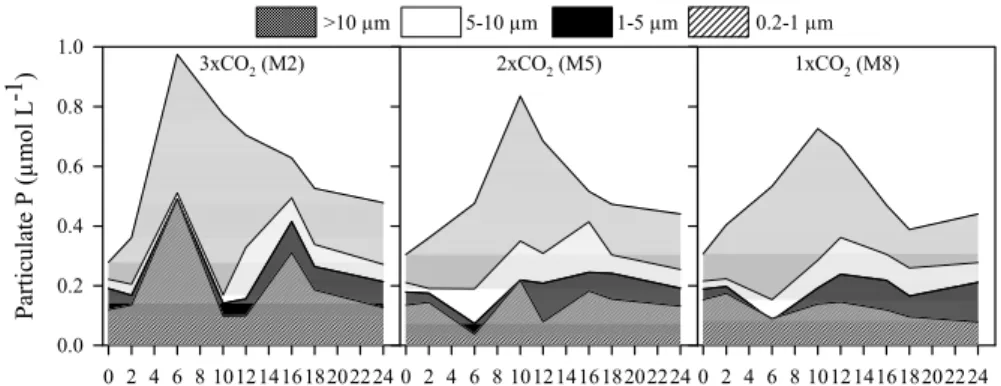
The increase of total particulate P (>0.2 µm) between Days 0-10 was accompanied by an increase of particulate P in the >10 µm fraction in all three mesocosms (Fig. 1).
5
While particulate P concentrations in the 0.2–1 µm fraction varied little except on Day 6 in 3×CO2during this period, the proportion of the 0.2–1 µm fraction to total particulate
P decreased. The particulate P concentration in the >10 µm fraction peaked on Day 10 in all mesocosms, while it was significantly higher in 3×CO2 (0.61 µmol L−1) than
in 1×CO2(0.44 µmol L−1) on Day 10 (t-test, P<0.05). While the highest proportion of
10
the >10 µm fraction in 2×CO2 and 1×CO2 was observed on Day 6 (60% and 71%,
respectively), the particulate P concentration in the >10 µm fraction on Day 6 was significantly higher in 3×CO2 (0.46 µmol L−1) than in 2×CO2 (0.29 µmol L−1) (t-test,
P<0.005). However, the statistical difference of the >10 µm fraction between 3×CO2
and 1×CO2 (0.38 µmol L−1) was marginal on Day 6 (t-test, P=0.053). After the peak
15
on Day 10, the proportion of the >10 µm fraction decreased to 33–43%, while that of the 1–10 µm fraction increased to 30-45% in all three mesocosms.
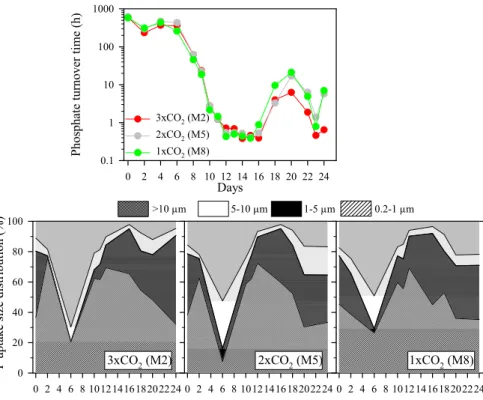
Temporal variations in substrate turnover time reflect either those of substrate con-centration or those of substrate flux through this pool or both (see Materials and Meth-ods). Phosphate turnover time varied by factor of ca. 1500 with a range of 0.4 to
20
625 h (Fig. 2). During the first 6 days when SRP concentrations were high (ca. 0.4– 0.8 µmol L−1: Schulz et al., 20072), phosphate turnover time was longest (in the order
of 100 h). Between Days 6–12, it rapidly decreased to values in the order of 0.1 h. 3
Allgaier, M., Riebesell, U., and Grossart, H.-P.: Microbial response to enrichment in pCO2
and subsequent changes in phytoplankton and nutrient dynamics, Biogeosciences Discuss., in preparation, 2007.
4
Egge, J. K., Engel, A., Thingstad, T. F., and Riebesell, U.: Primary production during nutrient-induced blooms at elevated CO2concentrations, Biogeosciences Discuss., in
BGD
4, 3937–3960, 2007Availability of phosphate and labile
organic carbon T. Tanaka et al. Title Page Abstract Introduction Conclusions References Tables Figures ◭ ◮ ◭ ◮ Back Close
Full Screen / Esc
Printer-friendly Version Interactive Discussion
EGU
From Day 16 onward, turnover time oscillated (0.4–21 h) and tended to be shorter in 3×CO2than in 2×CO2and 1×CO2. When phosphate turnover time was shorter, more
phosphate was taken up by the smaller fraction and vice versa. During the initial period (Days 0–6) with turnover time >100 h,33PO4uptake by the >10 µm fraction increased up to 70% in 3×CO2, while it was up to 50% in 2×CO2and 1×CO2. The mean uptake
5
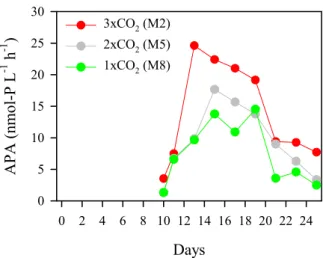
was highest (47-53%) by the 0.2–1 µm fraction and smallest (8–11%) by the 5–10 µm fraction during the experiment. APA ranged from 1.3 to 24.6 nmol-P L−1 (Fig. 3). Af-ter SRP depletion around Day 10 (Schulz et al., 20072), APA increased toward Days 13–15, and the fastest and highest increase in APA was observed in 3×CO2. After
this peak, APA decreased in all three mesocosms. Glucose turnover time was long
10
(>100 h) between Days 4–6, and rapidly decreased to ca. 16 h on Day 14 (Fig. 4). Thereafter, it rapidly increased toward Day 18 (74–91 h) and fluctuated between 39 and 73 h onward. No significant differences in any of the parameters presented in Figs. 1–4 were detected between the different pCO2 treatments during the experimental period
(ANCOVA, P>0.05).
15
Particulate organic matter (POM) and phytoplankton biomass increased from the start of the experiment, peaked around Day 10, and decreased onward, while Si, SRP, and nitrate concentrations changed from replete to deplete during the experi-ment (Schulz et al., 20072). This nutrient dynamics can be summarized as follows: (1) no obvious nutrient depletions between Days 0–6, (2) only Si depleted between
20
Days 7-9, (3) Si and phosphate depleted between Days 10–12, (4) Si, phosphate, and nitrate depleted from Day 13 onward. Interestingly, this approximately corresponded to the dynamics of phosphate turnover time: (1) the longest turnover time (>100 h) between Days 0–6, (2) decreasing turnover time between Days 7-11, (3) the shortest turnover time (<1 h) between Days 12–16, (4) increasing turnover time between Days
25
17–20, and (5) the short-term oscillation between Days 21–24 (Fig. 2). Using these five different phases of phosphate turnover time, the succession of dominant phytoplank-ton groups based on HPLC pigment analysis (Schulz et al., 20072) were summarized as follows: Diatoms and Prasinophytes in Phase I, Diatoms and Prymnesiophytes in
BGD
4, 3937–3960, 2007Availability of phosphate and labile
organic carbon T. Tanaka et al. Title Page Abstract Introduction Conclusions References Tables Figures ◭ ◮ ◭ ◮ Back Close
Full Screen / Esc
Printer-friendly Version Interactive Discussion
EGU
Phase II, Prymnesiophytes and Prasinophytes in Phase III, Prasinophytes, Dinoflag-ellates, and Diatoms in Phase IV, and Dinoflagellates and Cyanobacteria in Phase V. These results suggest that temporal changes in availability of the inorganic nutrients influenced those of phytoplankton biomass and succession during the experiment.
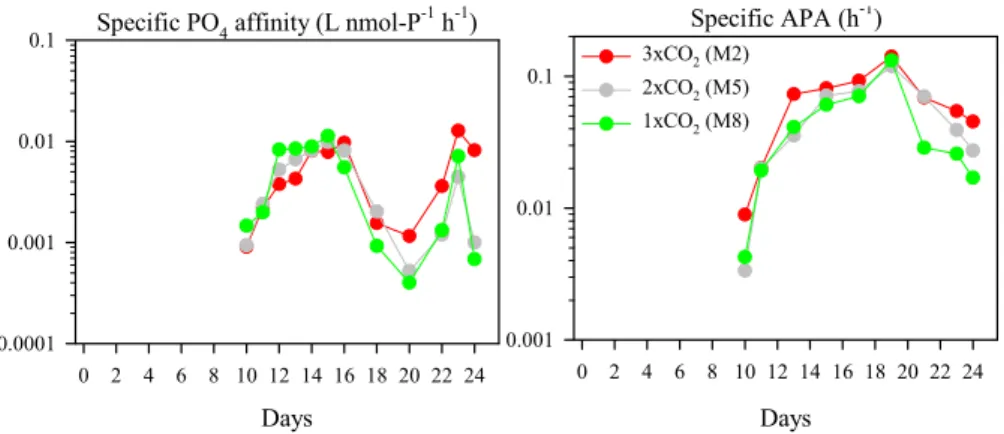
Specific phosphate affinity, which was calculated for the period of low SRP
concen-5
trations (Days 10–24: Schulz et al., 20072), ranged from 4.0×10⁻⁴to 1.3×10⁻²L
nmol-P−1h−1in the three mesocosms (Fig. 5). As the biomass of phytoplankton and bacteria was similar in all three mesocosms (Paulino et al., 2007; Schulz et al., 20072), temporal variation of specific phosphate affinity mirrored that of phosphate turnover time. After SRP depletion, specific phosphate affinity increased toward Days 12–16. However,
10
it decreased between Days 16-20, while, between Days 20–24, it showed short-term oscillations and tended to be higher in 3×CO2 than in 2×CO2 and 1×CO2. Specific
APA ranged from 0.003 to 0.141 h−1and peaked 4-6 days later (Day 19) than the APA (Figs. 3 and 5). This was because the temporal changes of the summed biomass of phytoplankton and bacteria were greater than those of the APA between Days 13–19
15
(Paulino et al., 2007; Schulz et al., 20072). However, no significant differences in spe-cific phosphate affinity and spespe-cific APA between M2, M5, and M8 occurred between Days 10–24 or 25 (ANCOVA, P>0.05).
Tanaka et al. (2006) have recently proposed that either specific APA >0.2 h−1and/or specific phosphate affinity >0.02 L nmol-P−1h−1 indicates P limitation, i.e. the growth
20
rate of the existing organisms is reduced due to the P availability, in different aquatic systems. They have also proposed that either specific APA in the order of 0.01 h−1 and/or specific phosphate affinity in the order of 0.001 L nmol-P−1h−1 indicate a situ-ation less strict than limitsitu-ation, i.e. P deficiency or suboptimal nutrient supply for phy-toplankton and bacteria community. In this context, specific phosphate affinity and
25
specific APA suggested P-deficiency of the phytoplankton and bacteria community in all three mesocosms between Days 11–24, except for 2×CO2and 1×CO2on Days 20
and 24 (Fig. 5). We acknowledge that the estimate of P biomass, which was used to de-termine specific phosphate affinity and specific APA, includes elements of uncertainty
BGD
4, 3937–3960, 2007Availability of phosphate and labile
organic carbon T. Tanaka et al. Title Page Abstract Introduction Conclusions References Tables Figures ◭ ◮ ◭ ◮ Back Close
Full Screen / Esc
Printer-friendly Version Interactive Discussion
EGU
in this study (see Materials and Methods). However, the estimated P biomass never exceeded the chemically measured particulate P (>0.2 µm) (range: 14–60%, n=36). The ratios of POC to particulate P were similar for all mesocosms and slightly higher (mean±SD: 129±28, n=38) than the Redfield ratio of 106 (see Schulz et al., 20072for POC data). If the specific phosphate affinity is recalculated by correcting the assumed
5
C: P ratios by the POC to particulate P ratios, only for one occasion (3×CO2on Day 23)
we found P-limitation whereas all other data points indicated P-deficiency. Thus, we believe that the uncertainties in P biomass estimation would not significantly change our conclusion of phosphate availability for the phytoplankton and bacteria community. During the P deficient period, viral abundance was high in all three mesocosms (Larsen
10
et al., 2007), suggesting that DOM production increased because of viral lysis of bac-terial and phytoplankton cells. However, DOP concentrations increased gradually and slightly throughout the experiment (Schulz et al., 20072). This can be explained by the fact that DOP produced via viral lysis is rather labile, and thus rapidly degraded by DOP hydrolyzing enzymes such as APA (Berman, 1969) and 5’-nucleotidase
(Am-15
merman and Azam, 1985). Both enzymes are essential for PO4uptake by osmotrophs from organic compounds when the phosphorus demand is in excess compared to the available phosphate pool.
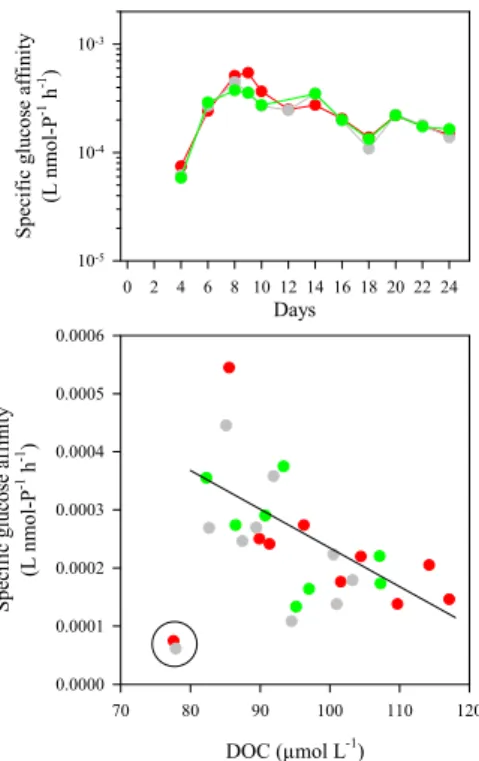
Specific glucose affinity between the three mesocosms varied similarly with a range of 5.8×10⁻⁵to 5.4×10⁻⁴L nmol-P−1h−1(Fig. 6). It increased toward Day 9 and
gradu-20
ally decreased onward. The differences in temporal variation between turnover time and specific affinity were due to the large temporal variations in bacterial biomass (Fig. 4; Paulino et al., 2007). Linear regression analysis showed a significant nega-tive relationship between specific glucose affinity and DOC concentrations (r2=0.390, P<0.0006, n=26). This suggests that the temporal changes in DOC concentration of
25
this study largely related to those of the labile DOC fraction (Fig. 7). This may be ex-plained by DOC production through DIC overconsumption by phytoplankton (Riebesell et al., 2007). In order to examine substrate availability for osmotrophs, the experimen-tally determined specific affinity (αe) can be compared with the theoretical maximum
BGD
4, 3937–3960, 2007Availability of phosphate and labile
organic carbon T. Tanaka et al. Title Page Abstract Introduction Conclusions References Tables Figures ◭ ◮ ◭ ◮ Back Close
Full Screen / Esc
Printer-friendly Version Interactive Discussion
EGU
(αmax). A theoretical expression for the maximum specific affinity for a spherical cell of radius r can be derived (Thingstad and Lignell, 1997):
αmax= 3D
σr2 (4)
where D is the diffusion constant for the substrate molecules, and σ is the volume specific constant of the element in question. If we assume that bacterial cells have
5
a density of 1.2 g cm−3, 50% dry weight of wet weight, 50% carbon of dry weight,
a C:P ratio of 50 (Fagerbakke et al., 1996), and a cell radius of 0.25 µm and that the diffusion constant for glucose is 6×10⁻⁶cm2s−1 (e.g. Koch, 1971), the maximum specific affinity given by diffusion limitation of substrate transport is calculated to be 0.207 L nmol-P−1h−1. The theoretical maximum is 3–4 orders of magnitude higher
10
than the values calculated in this study (in the order of 10−5 to 10−4L nmol-P−1h−1, Fig. 6). This suggests that bacterial growth was not limited by the availability of labile DOC.
Riebesell et al. (2007) report that enhanced DIC overconsumption was observed in higher pCO2 levels toward the peak of phytoplankton bloom (Day 12), but the ratio of
15
POC to PON remained very close to the Redfield ratio at the three pCO2levels. While this deviation between DIC/NO3 drawdown and POC/PON build-up was attributed to enhanced DOC production in higher pCO2 levels, higher loss of organic C from the upper mixed layer in higher pCO2 levels suggests enhanced export of POC including transparent exopolymer particles (TEP) originated from DOC (Riebesell et al., 2007).
20
A difference in cumulative primary production between the three pCO2levels became
evident after the peak of phytoplankton bloom or during the nutrient depleted period (Egge et al., 20074). Whereas contribution of picophytoplankton to total phytoplank-ton biomass was relatively small in all mesocosms (Riebesell et al., 2007; Paulino et al., 2007), the difference was mainly due to enhanced organic 14C production in the
25
0.2–1 µm fraction in higher pCO2levels, a fraction overlapping TEP size (Egge et al., 20074). Small and intermediate sized phytoplankton groups increased their importance relative to diatoms toward the end of the experiment (Paulino et al., 2007; Schulz et al.,
BGD
4, 3937–3960, 2007Availability of phosphate and labile
organic carbon T. Tanaka et al. Title Page Abstract Introduction Conclusions References Tables Figures ◭ ◮ ◭ ◮ Back Close
Full Screen / Esc
Printer-friendly Version Interactive Discussion
EGU
20072). This size shift of the phytoplankton community should have reduced vertical sinking flux, but the loss of organic C from the upper mixed layer continued toward the end of the experiment and was consistently higher at higher pCO2 levels (Riebesell et al., 2007). The results thus indicate that nutrient depletion (e.g. P deficient, Fig. 5) reduced the bacterial capacity to degrade organic C despite increased labile DOC at
5
higher pCO2levels, and may suggest that DOC or small C-rich organic particles, such as TEP, developed into sinking particles.
In summary, all parameters measured in the current study did not show statistically significant differences between the three mesocosms, and were thus apparently inde-pendent of different pCO2 levels. In the accompanying studies, effects of increased
10
pCO2 level were, if found, relatively small and appeared toward the end of the ex-periment (Allgaier et al., 20073; Egge et al., 20074; Paulino et al., 2007; Schulz et al., 20072). Although phosphate availability tended to be lower in the 3×CO2
meso-cosm compared to the mesomeso-cosms toward the end of the experiment, no statistical differences were detected. This may be partly due to the lack of parallel
measure-15
ments (one mesocosm for each pCO2level). However, such small differences could be explained by variance between “parallel treatments” rather than “different treatments” (Mart´ınez-Mart´ınez et al., 2006). These results suggest that availability of glucose and of phosphate availability was similar between three pCO2 levels. This implies that the plankton food webs can buffer to a large extent the effects of increased pCO2and the
20
related changes in carbon chemistry changes during a short time frame (ca. 1 month).
Acknowledgements. The authors thank the staff at the Marine Biological Station, University of
Bergen, in particular T. Sørlie and A. Aadnesen, and the Bergen Marine Research infrastructure (RI) for support in mesocosm logistics, all participants of PeECE III mesocosm experiment for valuable technical support and scientific exchange, and D. N ´erini for statistical analysis with the
25
software R. The comments by J. K. Egge, M. Meyerh ¨ofer, J. Wohlers, and E. Z ¨ollner improved the earlier version of the manuscript. This work was supported by the Norwegian Research Council (to T. F. Thingstad), the Leibniz foundation (to H.-P. Grossart), the Japanese Society for Promoting Science (to T. Tanaka).
BGD
4, 3937–3960, 2007Availability of phosphate and labile
organic carbon T. Tanaka et al. Title Page Abstract Introduction Conclusions References Tables Figures ◭ ◮ ◭ ◮ Back Close
Full Screen / Esc
Printer-friendly Version Interactive Discussion
EGU
References
Ammerman, J. W. and Azam, F.: Bacterial 5’-nucleotidase in aquatic ecosystems: a novel mechanism of phosphorus regeneration, Science, 227, 1338–1340, 1985.
Berman, T.: Phosphatase release of inorganic phosphorus in Lake Kinneret, Nature, 224, 1231–1232, 1969.
5
Caldeira, K. and Wickett, M. E.: Anthropogenic carbon and ocean pH, Nature, 425, 365, 2003. Delille, B., Harlay, J., Zondervan, I., Jacquet, S., Chou, L., Wollast, R., Bellerby, R. G.
J., Frankignoulle, M., Borges, A. V., Riebesell, U., and Gattuso, J. P.: Response of primary production and calcification to changes of pCO2 during experimental blooms
of the coccolithophorid Emiliania huxleyi, Global Biogeochem. Cycles, 19, GB2023,
10
doi:10.1029/2004GB002318, 2005.
Engel, A., Delille, B., Jacquet, S., Riebesell, U., Rochelle-Newall, E., Terbr ¨uggen, A., and Zondervan, I.: Transparent exopolymer particles and dissolved organic carbon production by Emiliania huxleyi exposed to different CO2 concentrations: a mesocosm experiment, Aquat. Microb. Ecol., 34, 93–104, 2004.
15
Engel, A., Zondervan, I., Aerts, K., Beaufort, L., Benthien, A., Chou, L., Delille, B., Gattuso, J.-P., Harlay, J., Heemann, C., Hoffmann, L., Jacquet, S., Nejstgaard, J., Pizay, M.-D., Rochelle-Newall, E., Schneider, U., Terbrueggen, A., and Riebesell, U.: Testing the direct effect of CO2concentration on a bloom of the coccolithophorid Emiliania huxleyi in mesocosm
exper-iments, Limnol. Oceanogr., 50, 493–507, 2005.
20
Fagerbakke, K. M., Heldal, M., and Norland, S.: Content of carbon, nitrogen, oxygen, sulfur and phosphorus in native aquatic and cultured bacteria, Aquat Microb. Ecol., 10, 15–27, 1996. Fitzgerald, G. P. and Nelson, T. G.: Extractive and enzymatic analyses for limiting or surplus
phosphorus in algae, J. Phycol., 2, 32–37, 1966.
Geider, R. J. and La Roche, J.: Redfield revisited: variability of C:N:P in marine microalgae and
25
its biochemical basis, European J. Phycol., 37, 1–17, 2002.
Grossart, H.-P., Allgaier, M., Passow, U., and Riebesell, U.: Testing the effect of CO2 concen-tration on the dynamics of marine heterotrophic bacterioplankton, Limnol. Oceanogr., 51, 1–11, 2006.
Havskum, H., Thingstad, T. F., Scharek, R., Peters, F., Berdalet, E., Sala, M. M., Alcaraz, M.,
30
Bangsholt, J. C., Zweifel, U. L., Hagstr ¨om, ˚A., Perez, M., and Dolan, J. R.: Silicate and labile DOC interfere in structuring the microbial food web via algal-bacterial competition for mineral
BGD
4, 3937–3960, 2007Availability of phosphate and labile
organic carbon T. Tanaka et al. Title Page Abstract Introduction Conclusions References Tables Figures ◭ ◮ ◭ ◮ Back Close
Full Screen / Esc
Printer-friendly Version Interactive Discussion
EGU
nutrients: Results of a mesocosm experiment, Limnol. Oceanogr., 48, 129–140, 2003. Hobbie, J. E. and Crawford, C. C.: Respiration Corrections for Bacterial Uptake of Dissolved
Organic Compounds in Natural Waters, Limnol. Oceanogr., 14, 528–532, 1969.
Koch, A. L.: The adaptive responses of Escherichia coli to a feast and famine existence, in: Ad-vances in Microbial Physiology, edited by: Rose, A. H. and Wilkinson, J. F., Vol 6. Academic
5
Press Inc., London, U.K., 147–217, 1971.
Koroleff, F.: Determination of phosphorus, in: Methods of seawater analysis, edited by: Grasshoff, K., Ehrhardt, M., and Kremling, K., Second, revised and extended edition. Verlag Chemie, Weinheim, Germany1983.
Larsen, J. B., Larsen, A., Thyrhaug, R., Bratbak, G., and Sandaa, R.-A.: Marine viral
pop-10
ulations detected during a nutrient induced phytoplankton bloom at elevated pCO2 levels,
Biogeosciences Discuss., in press, 2007.
Lee, S. and Fuhrman, J. A.: Relationships between biovolume and biomass of naturally derived marine bacterioplankton, Appl. Environ. Microbiol., 53, 1298–1303, 1987.
Leonardos, N. and Geider, R. J.: Elevated atmospheric carbon dioxide increases organic
car-15
bon fixation by Emiliania huxleyi (Haptophyta), under nutrient-limited high-light conditions, J. Phycol., 41, 1196–1203, 2005.
Mart´ınez-Mart´ınez, J., Norland, S., Thingstad, T. F., Schroeder, D. C., Bratbak, G., Wilson, W. H., and Larsen, A.: Variability in microbial population dynamics between similarly perturbed mesocosms, J. Plankton Res., 28, 783–791, 2006.
20
Myklestad, S. and Sakshaug, E.: Alkaline phosphatase activity of Skeletonema costatum pop-ulations in the Trondheimsfjord, J. Plankton Res., 5, 557–563, 1983.
Paulino, A. I., Egge, J. K., and Larsen, A.: Effects of increased atmospheric CO2 on small
and intermediate sized osmotrophs during a nutrient induced phytoplankton bloom, Biogeo-sciences Discuss., in press, 2007.
25
Perry, M. J.: Alkaline phosphatase activity in subtropical central north Pacific waters using a sensitive fluorometric method, Mar. Biol., 15, 113–119, 1972.
Redfield, A. C., Ketchum, B. H., and Richards, F. A.: The influence of organisms on the compo-sition of sea water, in: The sea, edited by: Hill, M. N., Vol. 2. Interscience, New York, USA, 1963.
30
Rhee, G.-Y.: A continuous culture study of phosphate uptake, growth rate and polyphosphate in Scenedesmus sp., J. Phycol., 9, 495–506, 1973.
Riebesell, U.: Effects of CO2enrichment on marine phytoplankton, J. Oceanogr., 60, 719–729, 3953
BGD
4, 3937–3960, 2007Availability of phosphate and labile
organic carbon T. Tanaka et al. Title Page Abstract Introduction Conclusions References Tables Figures ◭ ◮ ◭ ◮ Back Close
Full Screen / Esc
Printer-friendly Version Interactive Discussion
EGU
2004.
Riebesell, U., Schulz, K. G., Bellerby, R. G. J., Fritsche, P., Meyerh ¨ofer, M., Neill, C., Nondal, G., Oschlies, A., Wohlers, J., and Z ¨ollner, E.: Enhanced biological carbon consumption in a high CO2 ocean, Nature, in press, 2007.
Rochelle-Newall, E., Delille, B., Frankignoulle, M., Gattuso, J. P., Jacquet, S., Riebesell, U.,
5
Terbruggen, A., and Zondervan, I.: Chromophoric dissolved organic matter in experimen-tal mesocosms maintained under different pCO2 levels, Mar. Ecol. Prog. Ser., 272, 25–31,
2004.
Sciandra, A., Harlay, J., Lefevre, D., Lemee, R., Rimmelin, P., Denis, M., and Gattuso, J. P.: Response of coccolithophorid Emiliania huxleyi to elevated partial pressure of CO2 under
10
nitrogen limitation, Mar. Ecol. Prog. Ser., 261, 111–122, 2003.
Sterner, R. W. and Elser, J. J.: Ecological stoichiometry, Vol, Princeton University Press, Prince-ton, 2002.
Tanaka, T., Henriksen, P., Lignell, R., Olli, K., Sepp ¨al ¨a, J., Tamminen, T., and Thingstad, T. F.: Specific affinity for phosphate uptake and specific alkaline phosphatase activity as diagnostic
15
tools for detecting P-limited phytoplankton and bacteria, Estuaries and Coasts, 29, 1226– 1241, 2006.
Thingstad, T. F. and Lignell: Theoretical models for the control of bacterial growth rate, abun-dance, diversity and carbon demand, Aquat. Microb. Ecol., 13, 19–27, 1997.
Thingstad, T. F. and Rassoulzadegan, F.: Conceptual models for the biogeochemical role of the
20
photic zone microbial food web, with particular reference to the Mediterranean Sea, Prog. Oceanogr., 44, 271–286, 1999.
Thingstad, T. F., Skjoldal, E. F., and Bohne, R. A.: Phosphorus cycling and algal-bacterial competition in Sandsfjord, western Norway, Mar. Ecol. Prog. Ser., 99, 239–259, 1993. Tortell, P. D., DiTullio, G. R., Sigman, D. M., and Morel, F. M. M.: CO2 effects on taxonomic
25
composition and nutrient utilization in an Equatorial Pacific phytoplankton assemblage, Mar. Ecol.-Prog. Ser., 236, 37–43, 2002.
Wolf-Gladrow, D., Riebesell, U., Burkhardt, S., and Bijma, J.: Direct effect of CO2concentration
on growth and isotopic composition of marine plankton, Tellus, 51B, 461–476, 1999.
Zondervan, I., Zeebe, R. E., Rost, B., and Riebesell, U.: Decreasing marine biogenic
calcifi-30
cation: A negative feedback on rising atmospheric pCO2, Global Biogeochem. Cycles, 15, 507–516, 2001.
BGD
4, 3937–3960, 2007Availability of phosphate and labile
organic carbon T. Tanaka et al. Title Page Abstract Introduction Conclusions References Tables Figures ◭ ◮ ◭ ◮ Back Close
Full Screen / Esc
Printer-friendly Version Interactive Discussion EGU 3xCO2 (M2) 0 2 4 6 8 10121416182022 24 P art ic ul at e P (µ m o l L -1) 0.0 0.2 0.4 0.6 0.8 1.0 2xCO2 (M5) Days 0 2 4 6 8 1012 141618202224 1xCO2 (M8) 0 2 4 6 8 1012 141618202224 1-5 µm 0.2-1 µm >10 µm 5-10 µm
Fig. 1.Responses in concentration (µmol L−1) of size-fractionated particulate P.
BGD
4, 3937–3960, 2007Availability of phosphate and labile
organic carbon T. Tanaka et al. Title Page Abstract Introduction Conclusions References Tables Figures ◭ ◮ ◭ ◮ Back Close
Full Screen / Esc
Printer-friendly Version Interactive Discussion EGU Days 0 2 4 6 8 10 12 14 16 18 20 22 24 P h os pha te t u rnove r t im e (h) 0.1 1 10 100 1000 3xCO2 (M2) 2xCO2 (M5) 1xCO2 (M8) 0 2 4 6 8 1012 141618202224 33 P upt ake s iz e di st ri but ion (% ) 0 20 40 60 80 100 Days 0 2 4 6 8 10121416 18202224 0 2 4 6 8 1012 141618202224 1-5 µm 0.2-1 µm >10 µm 5-10 µm
3xCO2 (M2) 2xCO2 (M5) 1xCO2 (M8)
Fig. 2. Responses of phosphate turnover time (h) (top) and size-fraction (%) of33PO4uptake
BGD
4, 3937–3960, 2007Availability of phosphate and labile
organic carbon T. Tanaka et al. Title Page Abstract Introduction Conclusions References Tables Figures ◭ ◮ ◭ ◮ Back Close
Full Screen / Esc
Printer-friendly Version Interactive Discussion EGU Days 0 2 4 6 8 10 12 14 16 18 20 22 24 A P A (nm ol -P L -1 h -1 ) 0 5 10 15 20 25 30 3xCO2 (M2) 2xCO2 (M5) 1xCO2 (M8)
Fig. 3.Responses of alkaline phosphatase activity (APA: nmol-P L−1h−1).
BGD
4, 3937–3960, 2007Availability of phosphate and labile
organic carbon T. Tanaka et al. Title Page Abstract Introduction Conclusions References Tables Figures ◭ ◮ ◭ ◮ Back Close
Full Screen / Esc
Printer-friendly Version Interactive Discussion EGU Days 0 2 4 6 8 10 12 14 16 18 20 22 24 G luc os e t urnove r t im e (h) 10 100 1000 3xCO2 (M2) 2xCO2 (M5) 1xCO2 (M8)
BGD
4, 3937–3960, 2007Availability of phosphate and labile
organic carbon T. Tanaka et al. Title Page Abstract Introduction Conclusions References Tables Figures ◭ ◮ ◭ ◮ Back Close
Full Screen / Esc
Printer-friendly Version Interactive Discussion
EGU
Specific PO4 affinity (L nmol-P-1 h-1)
Days 0 2 4 6 8 10 12 14 16 18 20 22 24 0.0001 0.001 0.01 0.1 Specific APA (h -1 ) Days 0 2 4 6 8 10 12 14 16 18 20 22 24 0.001 0.01 0.1 3xCO2 (M2) 2xCO2 (M5) 1xCO2 (M8)
Fig. 5. Responses of specific phosphate affinity (L nmol-P−1h−1) (left) and specific APA (h−1)
(right).
BGD
4, 3937–3960, 2007Availability of phosphate and labile
organic carbon T. Tanaka et al. Title Page Abstract Introduction Conclusions References Tables Figures ◭ ◮ ◭ ◮ Back Close
Full Screen / Esc
Printer-friendly Version Interactive Discussion EGU Days 0 2 4 6 8 10 12 14 16 18 20 22 24 S p ec ifi c gl uc os e a ffi ni ty (L nm ol -P -1 h -1) 10-5 10-4 10-3 DOC (µmol L-1 ) 70 80 90 100 110 120 S p ec if ic gl uc o se a ff ini ty (L nm ol -P -1 h -1) 0.0000 0.0001 0.0002 0.0003 0.0004 0.0005 0.0006
Fig. 6.Responses of specific glucose affinity (L nmol-P−1h−1) (top), and relationship between
specific glucose affinity and dissolved organic carbon (DOC: µmol L−1) (bottom). A solid line
denotes a Model I linear regression ([Specific glucose affinity] = −6.7×10⁻⁶
[DOC] + 0.0009, n=26, r2=0.390, P<0.0006). Two data in the circle (M2 and M5 on Day 4) are not included for the regression analysis. The DOC data are from Schulz et al. (2007)2.