Diffusion of Ideas, Practices, and Artifacts:
Network Effects on Collective Outcomes
by
Juan Carlos Barahona Master in Business Administration
INCAE Business School, 1993
Submitted to the Program of Media Arts and Sciences, School of Architecture and Planning,
in partial fulfillment of the requirements for the degree of DOCTOR OF PHILOSOPHY IN MEDIA ARTS AND SCIENCES
at the
MASSACHUSETTS INSTITUTE OF TECHNOLOGY September, 2007
© Massachusetts Institute of Technologv 2007. All rights reserved.
Signature of Author:
firogram in Media A s and Stiences A aust 3rd, 2007
Certified by
Alex (Sandy) Pentland iba Professor of Media Arts and Sciences Program in Media Arts and Sciences Thesis Supervisor Accepted by MASSACHUSETTS NSTITUTE OF TECHNOLOGY
SEP
1
4 2007
LIBRARIES
Deb Roy Chairperson, Departamental Committee on Graduate Studies Program in Media Arts and SciencesDiffusion of Ideas, Practices, and Artifacts:
Network Effects on Collective Outcomes
by
Juan Carlos Barahona
Submitted to the Program of Media Arts and Sciences, School of Architecture and Planning, on July, 2007 in partial fulfillment of the requirements for the degree of
Doctor of Philosophy in Media Arts and Sciences
ABSTRACT
Important ideas, practices and artifacts often fail to reach their target population efficiently or fail to reach altogether. Surprisingly, most projects aimed to bring technology to underserved communities of the world lack an explicit diffusion strategy and/or lack an implementation strategy that acknowledges the social structure that binds together the members of the targeted community. Without the knowledge of social structures efficient diffusion of technological innovations becomes an unreachable goal.
Socioeconomic and behavioral information can be combined with sparse social structure data to derive quantitative estimates of a community's social dynamics, allowing improved understanding and management of diffusion processes. We found that patterns of advice and use of media provide and effective way to identify the influential members of a community. We set up a large scale experiment in a rural community using our model and tested our proposed method of intervention and found strong evidence of an improved diffusion process which is significantly related to the communities' network of advice.
The adoption of an idea, practice or artifact is heavily influenced by social context, through both conscious and unconscious mechanisms. By targeting social networks, not social classes, age, gender groups or institutions, we can create the basis for the emergence of local organizations and businesses that organically provide the necessary support to achieve effective diffusion of technological innovations. In our experiment, the introduction of a few powerful ideas at the core of the communities' social networks helped to create a social context where the new innovations created economic and social value. In addition, these new business create a richer social context from which further new innovations are expected to emerge.
Thesis Supervisor: Alex (Sandy) Pentland
Diffusion of Ideas, Practices, and Artifacts:
Network Effects on Collective Outcomes
by
Juan Carlos Barahona
Thesis Committee:
I
Thesis Advisor:
Alex'(Sandy) Pentland Toshiba Professor of Media Arts and Sciences MIT Media Laboratory
Thesis Reader:
Thesis Reader:
Mitchel Resnick LEGO Papert Professor of Learning Research Media, Arts and Sciences MIT Media Laboratory
,
t'
Randy Zadra
Managing Director, Institute for Connectivity in the Americas and Visiting Scientist MIT Media LaboratoryTo Maritza
Acknowledgments
This dissertation could not have been written without the intellectual guidance and judicious support of my advisor Professor Alex(Sandy) Pentland. During the past five years he has been a constant source of encouragement, ideas and challenges. I am also very grateful for having an exceptional doctoral committee and wish to thank Mitch Resnick for his continuous support during the doctoral program and Randy for his enthusiastic belief in the positive impact that this research may have. I also want to thank Professor Henry Lieberman's valuable feedback in preparation for the critique and defense of this thesis.
I want to thank past and present graduate students in my research group (the Pentlandians). It is a true privilege to be surrounded by so talented people. I learned so much from all of them. Daniel, Tammie and Ben, you are a great team and I wish you the best. Among all, I want to give special thanks to Tanzeem Choudhury for her warmth and welcoming attitude and guidance in my early days at MIT. I am also grateful to my office mates, Akshay Mohan's generosity and friendship and Weng Don's intelligent critique of research ideas and sense of humor. I also want to thank a very important team member, Mary Heckbert who really makes
a difference as the group manager.
A special note of gratitude goes to Professor Bakhtiar Mikhak and his loving family. I was encouraged by him to enter the doctoral program at the Media Lab and since then he has been a source of personal and professional advice and I am fortunate to count him among my dearest friends. Also, I should mention Wesley Williams and the many hours of discussions that eventually led to chapter three and the rest of my thesis. Abby and Claudia who's
support and companionship made the work of writing this document a lot easier. Manuel Esquivel, my UROP did an extraordinary work collecting and organizing the data I used in chapter four.
Next, I want to acknowledge the deep influence upon my research and teaching skills that Professor Peter Marsden has made. I first met Professor Marsden in his Social Network Analysis Seminar at Harvard. After the first few classes, my research work had a new direction. I owe him and Professor Chris Winship most of the analytical tools I used in this thesis. Both set for me the golden standard in teaching excellence.
My work at MIT since day one, has been related with a collection of projects in Costa Rica. I owe so much to so many people that it makes it impossible to list all of their names. But I should at least mention the leadership and unstintingly provided support of former INCAE president Dr. Roberto Artavia, current INCAE president Dr. Arturo Condo and former dean Dr. Alberto Trejos. I was fortunate enough to have the intellectual and material support of two Costa Rican NGOs. The first one, Fundaci6n Costa Rica para el Desarrollo Sostenible was a source of constant support. I am grateful to all of them but especially, I am grateful to President Jose Maria Figueres and Dr. Juan Barrios. CEMEDCO under the leadership of emeritus professor Leda Beirute was instrumental in the early stages of the research project. She and her colleagues provided a testing ground for new ideas, and many hours of hard work with members of the Los Santos Community members, helping to set up the experiments, registering observations and collecting data.
This research would not have been possible without the generosity of the people of Los Santos. I have no words to thank Rodrigo Jimenez for his leadership, his constant support and his friendship. Roberto Mata and Elias Calder6n and many people that work with them providing material support and data that were key to complete the experiments.
Among the many new friends that I met during my visits to Costa Rica, I want to thank the support and friendship of Ivannia and Natalia Urefia, their hospitality and generosity know no limits.
Finally, I want to thank my family. Moving to Boston was I huge challenge for my wife Vivian. She reinvented herself in different and positive ways. Her growth can only be parallel to the admiration I feel for her. Maria and Alberto, thank you for your patience, your love and your decision to share with me this wonderful ride. Last but not least, my father Dr. Rodrigo, thank you for always keeping the bar high!
Table of Contents
Chapter 1: Introduction ... 15
1.1 M otivation ... 20
1.1.1 This is an old and unsolved problem ... 21
1.1.2 Media Lab's life long commitment with technology and development ... 22
1.1.3 G-Lab, LINCOS and System Dynam ics ... 22
1.2 Thesis Organization... 24
Chapter 2: Social Networks and Diffusion of Innovations... 27
2.1 Social N etwork Analysis ... 27
2.2 Diffusion of Innovations Research... 28
2.3 Social N etworks Approach to Diffusion of Innovations ... 29
2.4 Diffusion of Innovations and Social Influence... 30
2.4.1 N etwork Diffusion M odels and Statistical M ethods... 32
2.4.2 Logistic Growth ... 32
2.4.3 The Bass M odel ... 33
2.4.4 Spatial autocorrelation ... 33
2.4.5 Network autocorrelation m odels... 34
2.4.6 Em pirical Studies ... 35
2.5 Social Em ergence ... 37
2.5.1 Agent-based generation of network data... 37
2.5.2 Exponential Random Graph M odels...38
Chapter 3: The Flow of Advice and the Diffusion of Innovation ... 41
3.1 Structural Perspectives on Diffusion of Innovations... 41
3.2 Influential people and DO I... 43
3.3 Centrality and Advice... 44
3.3.1 Degree Centrality ... 45
3.3.2 Betweeness Centrality... 46
3.3.3 Closeness centrality... 47
3.3.4 Eigenvector centrality ... 48
3.3.5 Eigen decom position of A dvice N etw orks ... 48
3.4 Em pirical A nalysis ... 50
3.5 D ata ... 51
3.5.1 Sam pling Region... 51
3.5.2 Baseline ... 52
3.5.3 D ata Collection... 54
3.5.4 G raph-theoretic D ata Sets ... 55
3.5.5 A ttribute D ata... 57
3.5.6 Explanatory V ariables... 57
3.5.7 Graph-theoretic variables ... 58
3.5.8 M edia Technology and Innovation ... 61
3.6 RESU LTS...62
3.7 D ISCU SSION ... 69
Chapter 4: Network Effects in the Adoption of PCs ... 73
4.1 M arketplace of Ideas ... 74
4.2 Project A ctivities ... 74
4.2.1 Technology w orkshop w ith the influentials... 75
4.2.2 Context im provem ent... 76
4.2.3 Community Help Desk and Communications Hub... 77
4.3 Measuring the network outcome in the diffusion process... 78
4.4 D ata ... 78
4.4.1 D ata Collection... 79
4.4.2 Survey ... 80
4.4.3 Study D esign... 81
4.4.4 M issing D ata and Im putations ... 83
4.5 M ethods ... 84
4.6 Results ... 87
4.7 Conclusion...94
Chapter 5: Network Approach to Development ... 97
5.2 Social Capital and the Influentials...101
5.3 Case Studies ... 104
5.4 Case 1: Los Santos Caf6 Coffee Shop...105
5.4.1 Im itation and Com petition ... 106
5.4.2 D iscussion ... 107
5.5 Case 2: Ganaderia Sinprim a R y M ... 108
5.5.1 Technology and the supply chain...109
5.5.2 Plans for the Future ... 110
5.5.3 D iscussion ... 110
5.6 Case 3: NutriSalud, S.A ... 11
5.6.1 Exporting services...112
5.6.2 Looking ahead...112
5.7 Case 4: Santos PC...113
5.7.1 Entrepreneurial attem pts ... 113
5.7.2 The Sales Strategy...114
5.7.3 Plans for the Future ... 115
5.7.4 Discussion ... 116
5.8 Case 5: Academ ia de C6m puto San M arcos S.A . ... 116
5.9 Cross-case Com parison...119
5.10 Innovation, Entrepreneurship and Social N etworks...120
Chapter 6: C onclusion and Future W ork...123
6.1 Contributions ... 123
6.2 Future D irections...125
6.2.1 Influence and A dvice ... 125
6.2.2 Eigenvector Centrality and other m easures of centrality. ... 126
6.2.3 N etw ork M odeling ... 126
6.2.4 N etw ork Sam pling ... 127
6.2.5 Heterogeneous com m unities...127
6.2.6 N etwork Effects Estim ation...128
List of Figures
Figure 3.1: Figure 3.2: Figure 3.3: Figure 3.4: Figure 3.5: Figure 3.6: Figure 3.7: Figure 3.8: Figure 4.1: Figure 4.2: Figure 4.3: Figura 4.4: Figura 4.5:Distribution of Respondents as they approached the Coffee Mill to collect their payments during the week of data collection
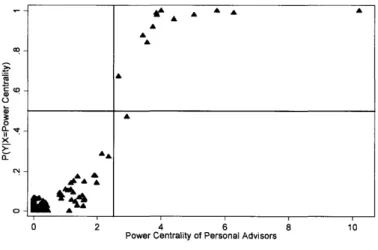
Probability of being an influential producer conditioned on Power Centrality of Personal Advice
Probability of being an influential producer conditioned on Power Centrality of business/economic Advice
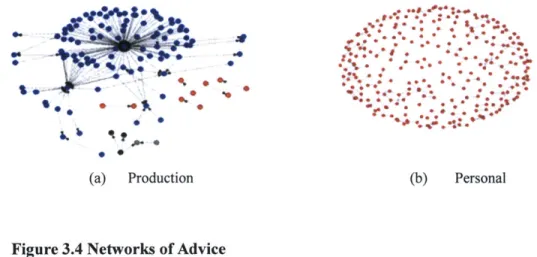
Networks of Advice
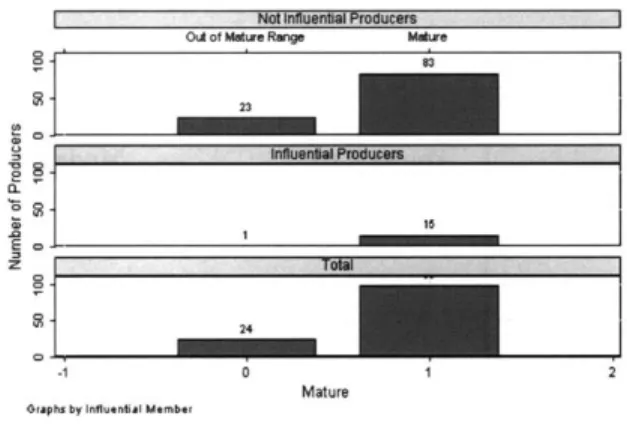
Distribution of Influential and non influential Producers According to Age (n=122)
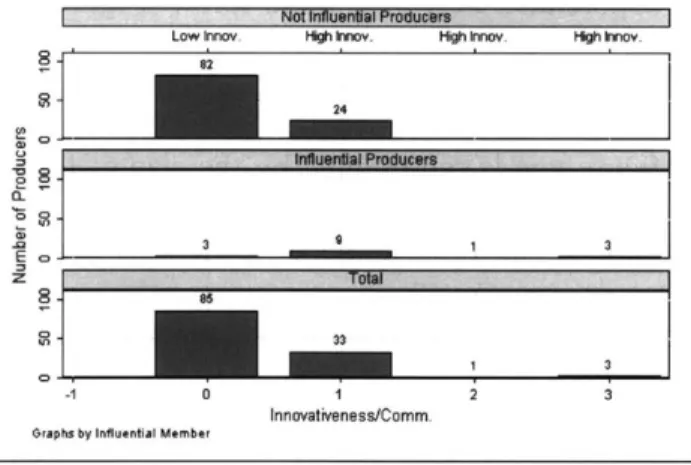
Distritution of Producers according to Innovativeness between influentials and non-influentials (n=122)
Distribution of Producers according to Advice Centrality coefficient clearly discriminating influentials from non-influentials (n= 122) Associated probability of being an influential producers according to the combination of Advice Centrality Index, Age and Pattern of Adoption of New Communication Channels
INCAE researcher at ICT workshop with influential community members. Here they are experiencing for the first time the use of e-mail.
Women's association computer training school started off with five used computers and today is a self sustained business
Network of Advice. The size of the node is proportional to the eigencentrality of each actor
Socioeconomic Regions of Costa Rica. The yellow star shows Dota's geographic position within Central, and bordering with
Central Pacific Region
Home Computer Adoption at the country, regional and Coopedota producers level
Figura 4.6:
Figure 4.7:
Figure 5.1: Figure 5.2:
Predicted value of hasPC conditioned on the Weighted Neighborhood 93 Influence (wInfluence)
Adoption of home computers within a network of advice. The size of 94 the nodes is proportional to the eigencentrality
Social Capital and Business Climate
Principal Components Layout of the Advice Network, it shows the position of RJO1 described in case 1 and RMO1 described in case 2.
103 108
List of Tables
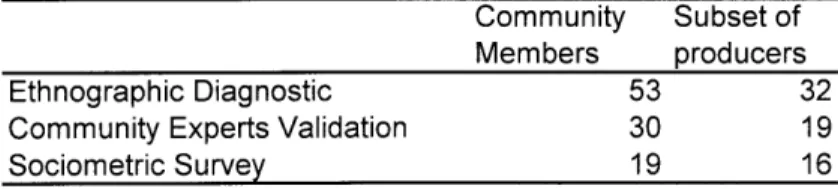
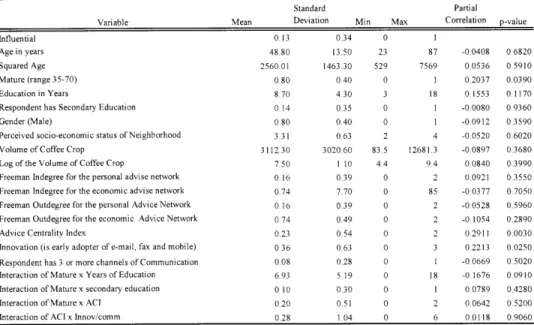
Table 3.1: The three exercises used to construct the baseline for this study Table 3.2: Description of selected variables in their original dimensions, some
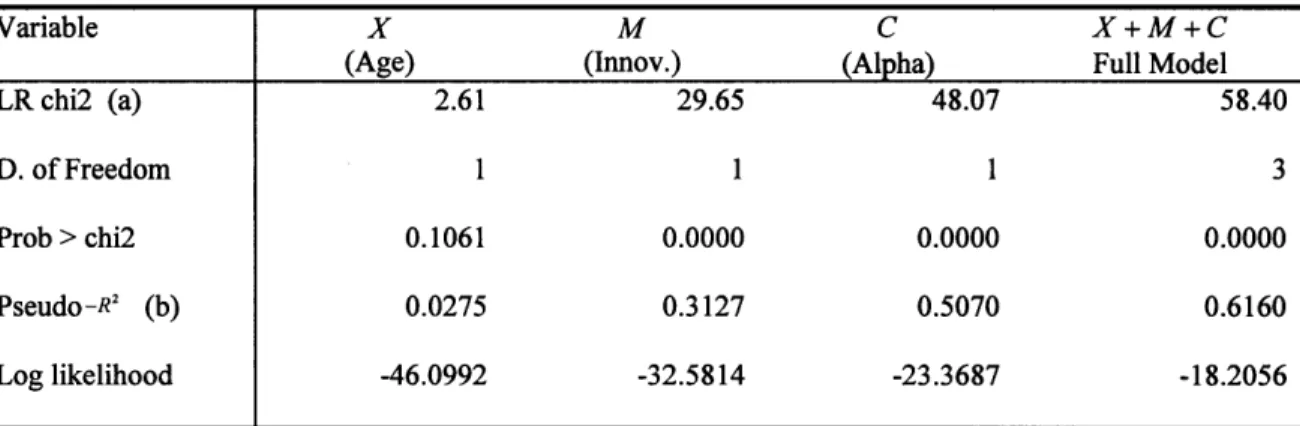
usual transformations and interaction variables that were tested Table 3.3: Logistic regression results for the components and the final model Table 3.4: Odds Ratios and p-values of the Main Effects Model
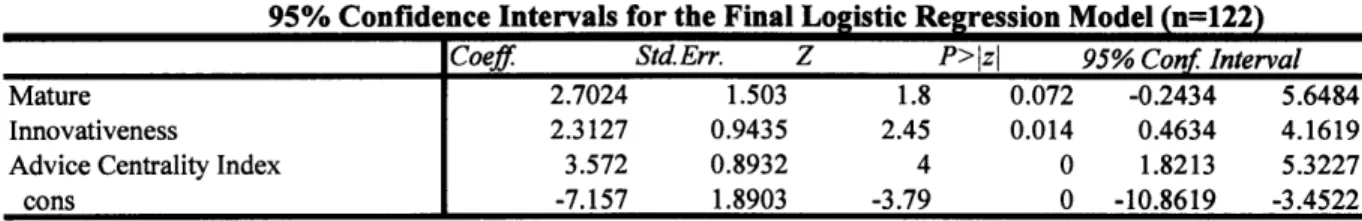
Table 3.5: Estimated coefficients, standard errors, z-scores, two tailed p-values and 95% confidence intervals for the final logistic regression model Table 3.6: Confusion matrices
Table 4.1: Distribution of registered coffee producers by neighborhood and sample used
Table 4.2: Personal, household and network data captured by paper survey and secondary sources
Table 4.3: Household heads: Sample composition Table 4.4: Association table
Table 4.5: Association table for the advice network
Table 4.6: Household heads with and without home computer
Table 4.7: Independently estimated coefficients, standard errors, z-scores, two-tailed p-values and 95% confidence intervals with dependent variable
= hasPC
Table 4.8: Estimated coefficients, standard errors, z-scores, two-tailed p-values and 95% confidence intervals with dependent variable = hasPC
Chapter 1:
Introduction
Classical writers such as John Stuart Mill and Karl Marx speculated that the standard of living could not rise indefinitely unless advances in technology increased the yield of the means of production. Neoclassical growth theory, based on capital accumulation, supports this intuition [1]. The last decade has witnessed increasing efforts to develop and deploy Information and Communication Technologies for Development (ICT4D) in underserved communities. Unfortunately, there are many more failures than success stories. This thesis provides a novel approach to social and economic development at the village level. It extends a new perspective on the role and dynamics of diffusion of technological innovations. The thesis will develop arguments for the need to understand the role of social networks and why they should be a unit of analysis for understanding, describing and dealing with community dynamics. It will present evidence of the importance of influential members of the community in optimizing diffusion processes. It will propose and test an original method to quantitatively and efficiently identify the influential members of a community. It will present an empirical study that demonstrates how the new method doubles the precision and reduces, by orders of magnitude, the time, effort and financial resources of current methods of finding these "influentials". These claims are planned, developed and evaluated through empirical work done within an experimental setting in the southern mountains of Costa Rica. Empirical
evaluation is complemented by literature review and theoretical analysis of competing methods.
1.1 Motivation
Wealth, innovation and economic growth are the result of ideas, collaboration and the ability to transform those ideas into valuable tools, products or services. This is true at personal, business, community and national level. Ideas come in a variety of forms, including knowledge, values, attitudes, information and coordination. A better flow of ideas generates wealth. ICT4D should provide to the right people a means to enhance substantially the way and frequency of their contacts and the quantity and quality of their relationships. The last decade has seen an increased effort to diffuse the use of ICT to improve the life of billions living in underserved communities. Unfortunately, most of them simply fail and early success stories become ephemeral as the critical point for massive adoption is never reached and efforts to push technological innovations become extinguished.
For a decade an impressive collection of world class universities and corporations have being trying to solve their sustainability problem and a solution that actually works has not yet been achieved. We think it is because the problem is not being framed adequately. The core of the problem is that modern digital technologies embody a diverse conglomerate of complex ideas, practices and artifacts, yet they are frequently dumped into communities without a clear strategy to manage their diffusion amongst its members' [2].
1 UNDP's 2005 book titled "Community-based Networks and Innovative Technologies: New Models to Serve and Empower the Poor is a recent and powerful example of how social structure and diffusion of technological innovations concepts are totally absent in the International Development
Around the world thousands of stories and photo opportunities for politicians and corporate marketers emerged [3, 4]; however, it is hard to find statistics of the many ICT4D projects that failed to fulfill their promises. Research on ICT4D such as telecenters, in general, is at best sparse and anecdotal[5]. Telecenters are a good example of this problem. The financial agencies no longer know what to do with them as affirmed by Klaus Stoll, president of the largest and earliest regional telecenters network in the world[6].
The proposed ideas in this thesis come from the search for an alternative solution to the paramount challenge of fostering economic and social development out of the urban settings. This thesis will provide hard data and statistical analysis to establish the empirical significance of the key elements of the proposal, but will also provide stories or cases that help clarify powerful ideas that are substantial for our closing discussion linking community development as a problem of diffusion of ideas, practices and artifacts.
1.1.1 This is an old and unsolved problem
The spread of new ideas has a dramatic impact on our lives, but we still need to improve our understanding and ability to manage the diffusion of ideas and innovations. Diffusion of Innovations pioneer Everett Rogers documented the case of scurvy in the British Navy, a good example of how inefficient the flow of ideas in an organization or community can be: Basically, the effectiveness of lemon juice in preventing this fatal illness was discovered by a British Navy Captain in 1601 and it took almost 200 years for this innovation to be adopted by the Navy, where upon scurvy was immediately wiped out [7]. New media is not enough to diffuse ideas. Today, after the impressive media development of the past 100 years, we can
Community. It uses over 74,000 words to describe the state of the art and new directions for making
observe with dismay how similarly simple solutions to similarly serious health problems suffer comparable rates of diffusion. One modem example is iodine deficiency, which for more than 80 years has been recognized as the most common cause of preventable brain damage and mental retardation. It is solved by simply adding iodine to salt, yet one out of every three human beings has some degree of iodine deficiency [8].
1.1.2 Media Lab's life long commitment with technology and development
Since its early days, the Media Laboratory has been an important contributor to developing technologies and methods that improve people lives around the world. Our work is aimed at learning from our recent past and current projects in this endeavor. We hope to contribute with a new framework of analysis, an original methodology of intervention based on quantitative analysis of the community's web of interactions.
1.1.3 G-Lab, LINCOS and System Dynamics
My first contact with this community as a Media Lab student was a Media Lab/Leaders for Manufacturing Program class project. It was set to explore "how digital technology could be applied to improve the economics of a rural community in a developing country, where infrastructure is minimal and marketing techniques must differ from those in the developed world"[9]. The context was two of the three main towns of Los Santos Region in Costa Rica. In one of them, San Marcos, LINCOS had recently shut forever its telecenter. Conventional System Dynamics ideas and tools were used to understand the social dynamics that first helped and later condemned the telecenters initiative in this region. An unexpected result was
found. By most commonly used standards within the international development community their local LINCOS may be thought by some as failed, but we arrived to the opposite conclusion when we realized the dramatic and mostly ignored impact the telecenter had on some of the people we were interviewing. Their new technological abilities and the project itself worked as a "weaver", linking people to social and business networks to which they do not belong. The network was a real source of financial and social capital that was actually being used by a few emerging local entrepreneurs. What LINCOS had unknowingly provided was a few business ideas using digital tools and communication technologies and a few people managed to use their new skills to connect and become a member of richer networks within the community. They were now able to provide a service and in exchange access human and financial support to develop their small business, a few of them initially in direct competition to LINCOS' services. Initially we tried to model our ideas using the System Dynamics concepts and software, but the experience proved to me that it was an inadequate tool to capture these phenomena. Chapter 2 will discuss the limitation of this tool to model the phenomena we are interested in. Business people frequently think in terms of clusters, or "geographic concentrations of interconnected companies". Using this mainly descriptive framework, one may say that with the new digital tools and skills a few San Marcos community members became part of the "local coffee cluster", but it understates the strong intuition we got from revisiting LINCOS with the G-Lab team: ICT was unintentionally used to build new links among community members that will change their socioeconomic status within the community in a sustainable way. We started to think that "building" these links should be the core product of ICT4D efforts and not a byproduct.
1.2
Thesis Organization
In Chapter 3, we claim that the relevant unit of analysis for the diffusion of advanced technologies is the community's social networks of advice, and that flow of ideas within these networks can be used to identify the "influentials" in order to better promote rapid diffusion of ideas. Diffusion efforts should have as an objective to increase the collective knowledge base of the new technologies and surpass the critical threshold of adoption. Valente and others have shown that sociometric concepts such as centrality are key to accelerating diffusion. We have found in our own research that the most influential people in the community should be the "entry" or starting points of the diffusion process as well[10]. We have also found that they are not always visible members of the community, and we have also found a quantitative method based on sociometric measures of advice networks that is an efficient way to find the influentials. We have also tested our intuitions and ideas by seeding a few powerful ideas in a real community with promising findings.
We have accumulated data on the social structure of a Costa Rican village and have conducted interventions aimed at people selected by their positional attributes within the social network structure. We have found out the key role played in diffusion by people considered as influential and as problem solvers by community members. Because the thesis' main focus and contribution is planned to be around a theoretically sound and empirically tested method of finding the influentials to optimize the diffusion of technological innovations, we conducted an experiment on diffusion of technological ideas. Its results are presented in Chapter 4. They represent strong evidence of the positive impact of our intervention in the rate of adoption of technology. The broader implications are discussed around business cases presented in Chapter 5. These cases show the impact at personal level
on five entrepreneurs, and how their new businesses are creating a richer "ecosystem" that should benefit the community as a whole.
Sociometric data is expected to become more available and easier to record and process, as mobile phones, computers of all sizes and the Internet become ubiquitous and better algorithms for data mining from those devices evolve. This work is part of a larger research agenda aimed at designing methods and applications informed by the structural properties of human dynamics to improve the flow of ideas and innovations.
Chapter 2:
Social Networks and Diffusion of Innovations
2.1 Social Network Analysis
Social Network Analysis provides an alternative to the traditional individualism of most mainstream social research[l1]. Social Network Analysis has been used in many different disciplines such as anthropology, biology, business (organizational behavior and marketing), computers science, ecology, epidemiology, ethology, mathematics, political science, psychology, communication science, statistics and lately physics and Artificial Intelligence.
With the renewed interest of physicists on networks, the explosion of networking sites over the Internet and the success of popular science books like Linked, The Tipping Point and The Wisdom of Crowds; the pervasiveness of networks has become evident and probably one of the defining paradigms of modern culture[12].
Literature claims at least three sources of concepts and tools in the development of Social Networks as a research field:
1) Linton C. Freeman, in his book "The Development of Social Network Analysis" defines the field as an approach to social research that displays four features: structural intuition; systematic relational data; graphic images and mathematical and computational models. For each feature he tracked back to the earliest works. So, according to Freeman, August Comte, the founder of Sociology, was the first scholar
who proposed a way of looking at society in terms of its actor's interconnections. For the systematic relational data he points at Swiss entomologist Pierre Huber and his work on bumblebees in 1802. As for the graphic component, he talks about the use of trees to describe kinship in the ninth century and the diagrams of Louis Henry Morgan on kinship data in 1858. As for mathematical modeling, he cites the algebraic models of Alexander MacFarlane. Finally, all four features came together in the 1930's when sociometry was introduced in New York by the Viennese Jacob Levy Moreno and Helen Hall Jennings.
2) Graph theory. In the sciences, the study of networks goes back to 1736, with the works of Leonard Euler (the K6nigsberg Bridge Problem). To solve a popular riddle he used a graph, i.e. "a mathematical object consisting of points also called vertices or nodes, and lines, also called edges or links, which abstracts away all the details of the original problem except for its connectivity"[ 13]. Graph theory spread from mathematics to other disciplines where abstracting details to study the topology of a latent network was useful, like applications in engineering, operations research, computer science and among all sociology and anthropology. Social Network Analysis borrowed from graph theory important nomenclature that allows describing abstract models and also became a practical tool for the analysis of empirical data[ 14].
3) Anthropologically-inclined organizational field workers based in the Harvard Business School during the 1920s (The Hawthorne Studies)[12].
2.2 Diffusion of Innovations Research
Business literature also provides a source of diffusion of innovation research. System Dynamics has being the leading modeling tool of diffusion of innovations in the business
research community. The modeler using System Dynamics will represent real-world processes in terms of stocks (inventories, materials, people, money, etc), flows between these stocks, and information that determines the values of the flows. It is an aggregated view, thus concentrating in policies. The modeler has to describe the system behavior as a number of interacting feedback loops, balancing and reinforcing. It is basically a system of differential equations. As long as the model works only with aggregates, the items in the same stock are indistinguishable, the modeler has to think in terms of global structural dependencies and has to provide accurate quantitative data for them[15].
In this field, Sterman's work on Business Dynamics[16] has been highly influential and provides a useful text book and tool to model a dynamic system. This particular tool helps to identify the interactions of multiple variables affecting complex systems. The limitation to its use comes from the difficulty of estimating the right parameters for the system being modeled. Many applications of business dynamics tools are weakened with assumptions hard to sustain out of the classroom. In the specific case of diffusion of innovations, it is traditionally modeled using the logistic or the bass model, and the network effect is recognized with vague concepts like "word of mouth".
2.3 Social Networks Approach to Diffusion of Innovations
The barriers to see more frequent use of sociometric data lay in the challenges of data measurement, model definition and the selection of research methods and different network weighting mechanisms to fit the selected model and test the results. The computing power to handle relatively complex analysis and potentially huge data sets is relatively new.
2.4 Diffusion of Innovations and Social Influence
Diffusion of innovations is treated usually as social contagion. Similar to the spread of disease, there is a chain reaction phenomenon. First there are a few adopters, then members of their networks adopt, and then they pass to their own networks and so on. First slow, then faster and faster, and then slows down again as the amount of potential adopters decreases. Mathematically, this phenomenon is best described by a logistic S-shape curve and it can be easily constructed from a simple frequency tabulation of the adoption time. If one measures a network to model a process of diffusion and the resulting graph has a poor or inexistent fit to a logistic curve, that is probably not the right network, or there is another more powerful effect other than network diffusion[ 17].
Social influence is an important process in diffusion of innovations analysis. It can be modeled, at least, using three different classes of network weight matrices that can be produced by the same network data[ 18]:
Relational: Direct ties, indirect ties, two-mode incidence (subjects and events). Positional: Percent positive matches, Euclidean distance, regular equivalence. Central: Degree, closeness, betweeness, eigenvector, integration/radiality, flow
centrality and information centrality, etc.
Assuming constant the perceived risk or advantage of an innovation and personal characteristics, if the fit to a logistic model is good and the network is a plausible explanation of the diffusion process then one can expect that[17]:
* High network density2 will contribute to the easy and fast spread of an innovation.
Low density (sparse networks) will act in the opposite direction [relational]
" Diffusion will be slower and less comprehensive than in a more connected network [relational]
" If there are pockets of interconnectivity, diffusion spreads fast within the densely connected subgroups and slower between groups.
" In a bi-component network diffusion will be faster than in components with cut-points or bridges [structural]
e The larger the ego network of a vertex within the network, the earlier it will adopt an
innovation [relational]
e The greater the amount of innovators in a vertex's ego network, the faster it will adopt.
[Relational]
" The greater the amount of members in a vertex's ego network that have adopted the higher the likelihood that it will adopt in which case exposure is a function of time and distance.
" A central position is likely to lead to early adoption [central]
" Diffusion from a central vertex (core) is faster than from a vertex in the margins of the network (periphery). [Structural Property]
e Core members tend to be more connected among themselves than periphery members,
and periphery members tend to be connected to the core members, therefore when most of the core has adopted, then most likely criticality has being achieved and an
avalanche of adoptions should occur[17]
e Since some people are more influential or persuasive than others, and some people are
more difficult to persuade than others, one should not expect a strong statistical
association between adoption and exposure in their local network in the early stages of diffusion3. [personal characteristic]
* Lower thresholds should be associated to a propensity to innovativeness. [personal characteristic]
The last two hypotheses are not directly related with the relational or structural approach, and involve time. We add them because once time is incorporated, the early adopters will most likely be those with a low threshold. And in general, innovativeness and low thresholds are supposed to be related to broad media use, high education level, high socioeconomic status, cosmopolitan contacts and cosmopolitan (outside local community) news preferences[1O, 17, 19].
2.4.1 Network Diffusion Models and Statistical Methods
Network diffusion models used by sociologists and the business communities among others are logistic growth (basic model), the Bass Model, Spatial autocorrelation and Network auto correlation.
2.4.2 Logistic Growth
It is based in the cumulative patterns of diffusion. This model follows a growth pattern, which has proven to be a consistent pattern through decades of empirical research on DOI. It is approximated by a logistic function[20]. It has one parameter and has limited applicability. It could be used to compare growth rates for various innovations. It is described by
3 The amount of exposure than an individual needs to adopt is called the individual's threshold.
y, =bo +_
1+e + (2.1)
Where t equals time, -bit is the rate parameter to be estimated and bO is the intercept.
2.4.3 The Bass Model
This model has two parameters: the rate for innovation (bO) and the rate for imitation (bl). It assumes perfect social mixing, i.e. everyone interacting with everyone else. Thus, it does not measure whether people who are connected to one another engage in the same behaviors. It is described by
y, = bo +(b] -bo)yl~l -bj (y,_l )2 (2.2)
The parameter bO can be interpreted as external influence or innovativeness. The parameter bl can be interpreted as internal influence or interpersonal persuasion. This model is used to forecast expected levels of diffusion. Interpretation of parameters is highly dependent on the time scale used to measure diffusion. It incorporates the % of adopters at each time point. Thus, it makes a better estimate of the growth attributable to personal network persuasion.
2.4.4 Spatial autocorrelation
This model measures the spread between contiguous areas. It uses proximity data to produce a network of connections based on distance. The model tests for spatial association (geographic clustering) of adoption. It is described by
Where N is the sample size, y is adoption, S is the sum of distances in D and D is the distance matrix (proximities). I measures the degree to which nodes that are connected to one another deviate from the average behavior in the network similarly or differently. A high "I" indicates positive or negative difference from the average score.
2.4.5 Network autocorrelation models
Network models measure personal or network exposure as opposed to random mixing. In network exposure models it is very important to control for clustering[18]. It is described by
Ej = DOUy
I co, (2.4)
Where E is the estimated proportion of contacts who are adopters, it is a measure of autocorrelation, y is a vector of adoptions, co is the social network weight matrix of direct contacts (relational) or centrality to reflect influence by opinion leaders (central) or it can be transformed to represent the degree of structural equivalence (positional).
Testing social influence requires at least two time points to model a simple dynamic process expressed by
Pr(y, =1) -a±~k +B
log (1 - Pr(y, = 1)) = + BX +),y, k + Bik.2)C-1>y) (2.5)
Panel data collected at two time periods are adequate for most research needs and can provide evidence of network influence on behavior. Nonetheless, there are confounding and non-observed variable problems. This model extends to a more powerful and robust model that is increasingly being use by the social network analysis community.
Event history analysis, also called survival analysis or Cox proportional hazard model is a regression model for longitudinal event data[21]. It allows managing a substantive number of time points. There are two types. Discrete type deals with binary outcome. The continuous is used in the case in which the dependent variable is timed to an event. Data needs to be reshaped to a case-time format, and then coefficient estimates are produced using Maximum Likelihood estimators. The independent variable is if adoption occurs or not. It is
described by
log Pr(y, = 1) =a + BJX +IBktXk2 + Bk+,1)CYt + BktWYt
(l- Pr(y, =1)) (2.6)
Where
j
are the socio demographic characteristics (x. ); Bk, are parameter estimates for the matrix of time-varying socio demographic characteristics (X,,); and o is the socialnetwork weight matrix. It assumes a static network.
Event history analysis is an important methodology for the analysis of diffusion of technologies since it takes into account the time-sensitive nature of this kind of data. Marsden and Podolni, for example, use this technique in their reanalysis of the physician data studied by Coleman et al and by Burt, which shows the crucial improvement in the methodology to better asses that particular empirical study.
2.4.6 Empirical Studies
Since the early work on Diffusion of Innovations (DOI) [22], the social structure has been acknowledged. Computational models of diffusion of innovations have evolved mainly in the space of system dynamics [16]. This branch of modeling has produced lots of research from
which new theoretical propositions have emerged, but in essence the System Dynamics tradition is independent of social network information.
Conducting empirical studies of the effect of social structure on DOI, however, remains quite a challenge. It requires important changes in research design and there is a notorious lack of published literature to systematically guide researchers interested in using the network approach[23]. To start, collection of data poses important limitations and trade offs. Network Data Questionnaires are usually long, and sometimes complex, and represent an enormous burden on the interviewer and the respondent. Even with recent advances with sensor networks to collect relational data [24] and while promising platforms for social sensing devices are being designed [25], important technical challenges are involved. Another important challenge is related with issues of confidentiality and human subject data protection. And even when those hurdles are overcome the greatest obstacle is ahead: most statistical tools assume independence of the observations ignoring the fundamental dependency that is inherent to social structures[26]. Recent statistical developments and algorithms are now available to estimate a limited but promising set of network parameters and they deal specifically with the dependence problem, but they are limited and still being developed [27].
Network Survey Design is also a key decision with important empirical and methodological consequences. Most of the work on the past decades on social network analysis is based on complete network data. This is equivalent to a census or saturation sample. On the other side of the spectrum is the analysis based on ego-networks where subjects are sampled and their "alters" studied assuming that there is no connection between the different sets of "egos" and their "alters", which is hardly the case in most communities,
and is of little or no interest in the study of diffusion process. In traditional research methods, a sample is the midway solution and it is expected to be a less expensive approach. Unfortunately, there is very little sampling theory when it comes to network structure [23].
One approach to this problem is to use partial information to learn the parameters that best describe the network of interest and use those parameters to generate through simulation a model of the complete network. This network then can be analyzed to learn the properties that best describes it and the consequences of such structural properties can be used to explore their implications in the flow of ideas and, eventually, other human dynamics. Thus, allowing improved understanding and management of diffusion processes. Unfortunately, the mathematics to produce specific type of networks according to a set of parameters are at best, in their early childhood stages [28].
2.5 Social Emergence
Relatively new tools like multi-agent models, may prove to be better suited for this task. Agents could be programmed to have beliefs (what it knows about the state of the world) and desires (goals). When the agent reasons about the state of the world and its goals and it makes a decision, its plan is called intentions. This particular kind of agents is called BDI (belief-desire-intention) by the artificial intelligence community[29]. Work developed in the last decade, with rather simple agents, has produced "interesting results about the emergence of social networks, trade, markets, cultural differentiation and evolution"[30, 31].
2.5.1 Agent-based generation of network data
The adoption of an idea, practice or artifact is heavily influenced by social context, through both conscious and unconscious mechanisms, but it becomes, at the end, an individual
decision. Nevertheless, how heterogeneous individuals behave with each other generate collective results that are not explained by the sum of the parts. There are different theories of how individuals engage in relations[32, 33] and some have been modeled mathematically[34, 35]. The analysis of the interplay of these different theories and how past experience and adaptation to the past experience causes mathematical analysis to be very limited in its ability to derive the dynamic consequences of the aggregate behavior. This is what makes agent-based modeling a practical method of analysis [31, 36, 37]. Surprisingly, the use of this tool to study the effect of social networks in diffusion is practically inexistent. We think that this method can be used to generate parameters useful to deal with sparse relational data problems that inevitably will emerge from the limitations on data collection and measurement we mentioned. We expect to extend concepts from the diffusion literature on economics, epidemics and herd behavior to study and model the diffusion of ideas, practices or artifacts[38, 39]. Agent-base models of human behavior that include network, context, and attribute features to produce predictive stochastic models of the diffusion process are rare and most lack validation against real data.
2.5.2 Exponential Random Graph Models
Exponential Random Graph Models are the most promising statistical models to represent social networks since they can represent structural tendencies, such as transitivity, that define complicated dependence patterns not easily modeled by more basic probability models. This model has also been referred to as a p * model [40]. Recent developments in this area and MCMC algorithms have being developed which are able to produce Maximum Likelihood estimators. This is important because it would allow the use of simulation to evaluate the fitness of empirical observations.
Structures such as transivity and heterogeneity of degrees can be represented using ERGM using new specifications such as: geometrically weighted degree distributions, alternating k-triangles, and alternating independent two-paths.
These recent methodological advances come from scientific work on the study of HIV contagion. As opposed to other contagion processes, HIV studies need to focus on the dyadic relationship. The change on the focus of research, from the subject to a pair of subjects and the existence or non existence of a link, produces different and often counterintuitive results with important impacts on health policies. Diffusion of computers in rural areas of the world, among other environments, might have something in common with this.
Chapter 3:
The Flow of Advice and the Diffusion of Innovation
3.1 Structural Perspectives on Diffusion of Innovations
Most empirical research on diffusion of innovations confirms the premise that new ideas and practices spread through interpersonal communications. However, most foundational studies have focused on the spread of relatively simple and "static" technologies, such as weed spray in Iowa [7], hybrid seed corn [41] or tetracycline [42], as opposed to ever evolving modern technologies and their myriad of versions and the potential difficulties and complexities intrinsic to them.
The key to transfer those simple technologies is awareness and imitation. In other words, P gets the idea through personal communication with 0 (awareness) and P decides to imitate 0 (adoption), later P passes the information to
Q
and so on. This approach leads to the interest in parameters such as the rate of diffusion and how it correlates with proximity, communication or influence. Valente et al. [43] studied and confirmed the association between friendship ties and the adoption of contraceptive choices in Cameroonian women. Their model defined network exposure asE( =31
Where, o is the social network weight matrix and y is the vector of adoptions. The network exposure is measured on direct contacts. co can be transformed to reflect other social influence processes through a family of relational, positional and centrality measures.
Their approach implies at least four different levels of decision to design a study of the network effect on diffusion:
1. The election of the type of network to observe and register. It could be a network of friendship, advice or any other convenient type.
2. If influence or other behavior determines P's probability of adoption, what set of structural features of networks capture such behaviors (relational, positional or centrality)?
3. Within each set, which measures should be used? (There are probably more than a dozen different types of centrality measures). And once the above decisions are made, still there is an issue of fine tuning to decide the weight attached to each factor, generally based on social distance. For example, if 0 influence P and P influences
Q.
Should the influence of P andQ
reflect the fact that 0 may or may not be connected to a highly central or an isolated N?ICT for development projects usually come in the form of computers for schools, community centers or other public or quasi-public spaces. In rural areas, probably more often, they come in the form of telecenters that embody a variety of different media that offers a wide range of potential solutions for community problems, all the way from telemedicine to e-commerce, as discussed in Chapter 2. In terms of ICT for development public policies, most discussions revolve around Internet access issues.
Those types of innovations are substantially different from the technologies mentioned above. They are knowledge intensive and for their adoption to be sustained over time there needs to be a continuous flow of information and support to keep up with the pace of new versions or even just to keep it functional. Voice over IP and wireless Internet solutions are frequently praised for their promising potential to serve isolated communities. But, updating to a newer version of hardware or software may cause operative systems to crash. In that
moment, what may seem a simple operation (update a driver for instance) can become a real problem. It may come from previous experience (knowledge), advice (another villager has the knowledge and the villager has direct or indirect access to him or her) or from specialized technical assistance, which depending on the type of source and the relative isolation, could be scarce and expensive to acquire. In this particular setting exposure to the friendship network is probably not enough. We will describe below an exercise where we gathered 30 members of a community because they were considered "influential" people that were important to "solve" the problems of the community. Among them we asked them who they considered influential and collected information about friendship and about advice. We found advice to be highly correlated with being influential.
We claim that the relevant unit of analysis for the diffusion of advanced or complex technologies is the community's social networks of advice, and that flow of ideas within these networks can be used to identify the influentials in order to better promote rapid diffusion of ideas. Rapid diffusion should be an objective to increase the collective knowledge base of the new technologies and surpass the critical threshold of adoption. In the next Chapter we will discuss an experiment in which work with the influentials was used to improve the adoption of technology.
3.2 Influential people and DOI
Most studies on innovation have been retrospective; they lack information on interpersonal communication networks, and more importantly, few have attempted to use the lessons from diffusion research to accelerate the diffusion of innovations [44]. Valente and Davis' work
[45] suggests, through simulation, the possibility of achieving a critical mass in a much shorter time by carefully selecting the opinion leaders of a social network. This chapter
evaluates the hypothesis that a target is better defined as an influential member within multiple advice networks as one of the key contributions of this work. In general, identifying who are the influential members improves the design of diffusion strategies, regardless of what is being diffused through the network. In practice, the selection of influentials is usually accomplished by using conventional wisdom and traditional sociological theory, e.g. by looking for those with higher social and economic status and leaders of formal and informal organizations within the community. Selection is usually done after the definition of general criteria to select participants or "beneficiaries", ignoring the underlying network structure. In other words, many projects by design define a profile that usually tends to make the population of interest very homogeneous (e.g. programs designed to reach the poorest of the poor, or a specific gender within an income bracket) without consideration of the social network into which they are embedded and their links to the sources of economic and social capital.
We claim that the most influential problem solvers in the community should be the "entry" or starting points of the diffusion process as well and that networks of advice contain enough information to recognize them. For the community as a whole patterns of centrality should emerge even when network information does not include the totality of possible nodes and relationships. To decide what centrality measure to use and how to adjust any time of weight, we shall review what the mean in terms of the flow of advice.
3.3 Centrality and Advice
Since research on the idea of centrality applied to human communications was introduced in the late 40's by Bavelas at the Group Networks Laboratory at M.I.T., centrality has been related to reputations of power and influence over a community [46].
The most frequent form of organization of a social structure is the center-periphery pattern. It consists of a) a subgroup of relatively central prestigious actors who are connected by direct or short indirect ties and b) a subgroup of peripheral actors who are directly connected to the central actors rather than to other peripheral actors. In this form of organization, central actors tend to be resourceful and cohesively joined to other actors [47].
Within the family of centrality measures, there are four prominent ones due to their strong and distinct qualities[48]. They are also foundational in the field of social network analysis: degree, betweenness, closeness and eigenvector centralities.
3.3.1 Degree Centrality
The most simple and natural way of describing the concept of centrality is the star configuration. The center in this structure possesses 3 unique properties: it has the maximum degree [49-51]; it falls on the geodesics (shortest path4 linking a given pair of points) between
the largest possible number of other points and, since it is located at the minimum distance from all other points, it is maximally close to them (Freeman, 1978/79). Mathematically it is defined by equation (2).
n
CD(pk) = a(p,pk)
,=1 (3.2)
Where 4',k 'if and only if A and Pk are connected by a line, otherwise it is 0.
Its strength is that is intuitively simple, it's just a count. It is widely used in social network analysis. It assumes that all nodes are "equal" in the sense that if one node is
connected to two isolates and another is connected to two stars, both nodes will have a centrality of two. Depending on the process of diffusion that we are interested in, it can make a big difference. In aids contagion for example, its risk of contagion is obviously lower for someone having sex with the first node that is only connected with two isolates, than having sex with the second that because of the centrality of its partners has a higher risk of having the disease.
3.3.2 Betweeness Centrality
Betweeness [46] usually indicates a node that can control the flow of information bridging disparate regions of the network. Betweeness centrality is a more precise way of measuring a vertex centrality, in the sense that it takes into account that some low degree centrality vertexes may still be in a position indispensable for certain transactions[52]. According to Nooy et al. "targeting" the actors with the highest betweeness-centrality is a good strategy for launching an innovation[17]. They claim that if the first adopters are central and directly linked, their neighbors have higher exposure rates, so they are more likely to adopt. This is a quantitative approach, a qualitative approach may consider that by getting all the central nodes to adopt in a short period of time the system has been changed as the individual thresholds (perceptions of risk) of core and periphery actors has been changed, as a consequence of the social signaling and monitoring processes. For the diffusion of certain technologies the threshold may be lower also because of an increased value as a result of an increase in the number of adopters, especially communication technologies like mobiles, sms, email and the like5.
Because of its reliance on non-directed paths and geodesics, betweeness cannot be easily estimated for directed data [40], which is an important loss of information in cases where persuasion or advise play an important role in the diffusion of innovations. Its assumptions are that the traffic will choose the shortest path, and if confronted with equally
short paths, it will randomly choose only one. Traffic moves one to one instead of copying itself or being broadcast from a node. A second assumption is that it is not diffusing randomly. Since it is taking only the shortest path, then it "knows" its target from the origin [53]. These last assumptions make Freeman's betweeness centrality measure unsuitable to be used in contexts where these assumptions do not hold, like the spread of computer viruses, diseases and other infections, or information movement in most cases. An innovation where imitation has an important effect may be less vulnerable to these strong assumptions than, for example, an innovation where persuasion is more important that imitation.
3.3.3 Closeness centrality
Closeness is the theoretic distance of a given node to all other nodes and it is commonly used in the study of diffusion. As opposed to degree centrality, this measure takes into account indirect connections. In a directed graph the outgoing arcs will be related to the amount of steps one actor needed to reach the other actors. In terms of flow it is ordinarily interpreted as an index of the expected time until arrival of something flowing within the network[54].
The critical assumption of this measure is that information is following the shortest path or parallel duplication -where all paths are followed simultaneously, including the
shortest path as well. It only works on connected or strongly connected graphs.
This is a disadvantage because it means that you may not be able to use this measure to compare subgroups if there are regions less connected within the network and one or more
components belong to that area. In our study, the networks of advice found and registered are not well connected. This limitation impedes the use of this measure in the current analysis.
3.3.4 Eigenvector centrality
It is the property of a node that has a high eigenvector score and that is connected to others who are also high scorers. This is measured by the principal eigenvector of the adjacency matrix of a network. It was designed to work with valued data but works on binary information as well. The use of eigenvector centrality is convenient when the status of an actor is a function of the status of those with who he is in contact (Bonacich, 1972). Given an adjacency matrix A, the eigenvector centrality of node i is:
c =a IAc
(3.3)
Where X is a required parameter to give the equations a non-trivial solution (a =1/ i.e. the reciprocal of the eigenvalue) and has no substantive interpretation.
It is usually interpreted as a measure of influence. It assumes that traffic moves via unrestricted walks and does not assume that things flowing will be transferred or copied to one neighbor at a time, so this measure is ideal for influence type processes [54]. Diffusion of innovations where social influence is an important variable should obtain better results using this centrality measure.
3.3.5 Eigen decomposition of Advice Networks
Eigenvector centrality generalizes to what is known as Bonacich Power Centrality or Alpha Centrality [55]. Among the measures of centrality the eigenvector method seems appropriate in cases where persuasion depends on the perceived knowledge or authority of the vertex that