HAL Id: hal-00296263
https://hal.archives-ouvertes.fr/hal-00296263
Submitted on 25 Jun 2007
HAL is a multi-disciplinary open access
archive for the deposit and dissemination of
sci-entific research documents, whether they are
pub-lished or not. The documents may come from
teaching and research institutions in France or
abroad, or from public or private research centers.
L’archive ouverte pluridisciplinaire HAL, est
destinée au dépôt et à la diffusion de documents
scientifiques de niveau recherche, publiés ou non,
émanant des établissements d’enseignement et de
recherche français ou étrangers, des laboratoires
publics ou privés.
near-infrared on a planetary scale
N. Hatzianastassiou, C. Matsoukas, A. Fotiadi, P. W. Stackhouse, P. Koepke,
K. G. Pavlakis, I. Vardavas
To cite this version:
N. Hatzianastassiou, C. Matsoukas, A. Fotiadi, P. W. Stackhouse, P. Koepke, et al.. Modelling the
direct effect of aerosols in the solar near-infrared on a planetary scale. Atmospheric Chemistry and
Physics, European Geosciences Union, 2007, 7 (12), pp.3211-3229. �hal-00296263�
planetary scale
N. Hatzianastassiou1,2, C. Matsoukas2,3, A. Fotiadi2,4, P. W. Stackhouse Jr.5, P. Koepke6, K. G. Pavlakis2,7, and I. Vardavas2,4
1Laboratory of Meteorology, Department of Physics, University of Ioannina, 45110 Ioannina, Greece 2Foundation for Research and Technology-Hellas, Heraklion, Crete, Greece
3Department of Environment, University of the Aegean, Mytilene, Greece 4Department of Physics, University of Crete, Crete, Greece
5Atmospheric Sciences, NASA Langley Research Center, Hampton, Virginia, USA 6Meteorological Institute, University of Munich, Munich, Germany
7Department of General Applied Science, Technological Educational Institute of Crete, Greece
Received: 24 July 2006 – Published in Atmos. Chem. Phys. Discuss.: 25 September 2006 Revised: 15 December 2006 – Accepted: 30 May 2007 – Published: 25 June 2007
Abstract. We used a spectral radiative transfer model to compute the direct radiative effect (DRE) of natural plus anthropogenic aerosols in the solar near-infrared (IR), be-tween 0.85–10 µm, namely, their effect on the outgoing near-IR radiation at the top of atmosphere (TOA, 1FTOA), on
the atmospheric absorption of near-IR radiation (1Fatmab)
and on the surface downward and absorbed near-IR radia-tion (1Fsurf, and 1Fsurfnet, respectively). The computations
were performed on a global scale (over land and ocean) un-der all-sky conditions, using detailed spectral aerosol optical properties taken from the Global Aerosol Data Set (GADS) supplemented by realistic data for the rest of surface and atmospheric parameters. The computed aerosol DRE, av-eraged over the 12-year period 1984–1995 for January and July, shows that on a global mean basis aerosols produce a planetary cooling by increasing the scattered near-IR radi-ation back to space by 0.48 W m−2, they warm the
atmo-sphere by 0.37 W m−2 and cool the surface by decreasing
the downward and absorbed near-IR radiation at surface by 1.03 and 0.85 W m−2, respectively. The magnitude of the
near-IR aerosol DRE is smaller than that of the combined ultraviolet (UV) and visible DRE, but it is still energeti-cally important, since it contributes to the total shortwave (SW) DRE by 22–31%. The aerosol-produced near-IR sur-face cooling combined with the atmospheric warming, may affect the thermal dynamics of the Earth-atmosphere system,
Correspondence to: N. Hatzianastassiou
by increasing the atmospheric stability, decreasing thus cloud formation, and precipitation, especially over desertification threatened regions such as the Mediterranean basin. This, to-gether with the fact that the sign of near-IR aerosol DRE is sometimes opposite to that of UV-visible DRE, demonstrates the importance of performing detailed spectral computations to provide estimates of the climatic role of aerosols for the Earth-atmosphere system. This was demonstrated by sen-sitivity tests revealing very large differences (up to 300%) between aerosol DREs computed using detailed spectral and spectrally-averaged aerosol optical properties. Our model re-sults indicate thus that the aerosol direct radiative effect on the near-IR radiation is very sensitive to the treatment of the spectral dependence of aerosol optical properties and solar radiation.
1 Introduction
Amongst the different factors that can cause climate change, both aerosols and greenhouse gases play an important role. Well-mixed greenhouse gases have produced a positive (warming) radiative forcing of about 2.4 W m−2 from
pre-industrial times (IPCC, 2001). Tropospheric aerosols on the other hand, both natural and anthropogenic, act in an opposite way in total through their direct radiative effect, by increasing the planetary albedo and cooling the sur-face. Aerosols may offset greenhouse-gas warming by about
25–50% (Kaufman et al., 2002), but there is uncertainty re-garding their overall radiative forcing (IPCC, 2001). Better estimates of the aerosol radiative effects on a planetary scale are required to reduce the uncertainties.
The main direct effect of aerosols is on the shortwave (SW) radiation, being much smaller in the longwave (ther-mal infrared) due to the rapid decrease of aerosol extinction with increasing wavelength for most aerosol types. One way to compute the SW direct effect is to use multi-component global aerosol models or general circulation and climate models that are able to represent adequately the physical structure of the Earth’s atmosphere with aerosols. These models require comprehensive global microphysical, micro-chemical, optical, and radiative aerosol properties. Despite the progress that has been made with these models (e.g. Ja-cobson, 2001; Liao et al., 2004; Reddy et al., 2005; Take-mura et al., 2005), there is a wide range of discrepancy between the different model results (Remer and Kaufman, 2006) and difficulties to reproduce correctly satellite obser-vations (Bellouin et al., 2005). Another way is to use satellite observations to estimate aerosol radiative effects and forc-ings. This technique has become attractive lately, as modern instruments such as the MODerate resolution Imaging Spec-troradiometer (MODIS), the Multi-angle Imaging Spectro-Radiometer (MISR) or the Clouds and Radiant Energy Sys-tem (CERES) were designed specifically to observe aerosols and the Earth’s radiation budget. Such observational meth-ods have been applied (e.g. Bellouin et al., 2005; Zhang et al., 2005) to estimate the combined direct radiative effect of both anthropogenic and natural aerosols. Yu et al. (2006) provides a thorough review of the radiative effect of aerosols from both satellite-based methods and global models. Al-though many problems related to satellite observations of aerosols have been resolved with the more sophisticated in-struments, there are still problems as shown by discrepancies between different satellite products (Zhao et al., 2005). An-other problem with the satellite-based method (e.g. Christo-pher and Zhang, 2002) is that it provides estimates of aerosol forcing only at the top of atmosphere (TOA), and not within the atmosphere and at the Earth’s surface, where the effect of aerosols is largest.
An efficient way to compute the aerosol radiative effects is the use of radiation transfer models, but these usually in-clude a few spectral bands in the whole SW range, which does not allow for precise calculations. Therefore, one of the important improvements is a better spectral resolution in these models. This is critical, since the optical proper-ties of aerosols vary within this spectral range, making thus their interaction with solar radiation very sensitive to wave-length. As shown by Hatzianastassiou et al. (2004b), it is very important to perform detailed computations of aerosol forcing, using spectrally resolved aerosol properties, since inadequate treatment can result in modified aerosol forcings at TOA, in the atmosphere and at surface by 1.4, 15.7 and 7.5%, respectively, on a global scale, and up to 100%
lo-cally (at geographical cell-level). In this study, we use a de-tailed spectral radiative transfer model along with spectral aerosol properties (and also surface and atmospheric param-eters) to compute the direct radiative effect (DRE) of aerosols at near-infrared wavelengths. We have used a detailed spec-tral radiative transfer model to match, as best possible, the detailed spectral resolution of aerosol optical properties from the Global Aerosol Data Set (GADS, Koepke et al., 1997). More specifically, the GADS aerosol properties are given at 29 wavelengths within 0.85 to 10.0 µm (see Sect. 3.1). Note that we use the term aerosol radiative effect rather than forc-ing, since we assess here the effect of both natural and an-thropogenic aerosols, while the term aerosol forcing is of-ten used to express the radiative perturbation due to anthro-pogenic aerosols only. The aerosol DRE is computed at TOA, within the atmosphere and at the Earth’s surface, on planetary scale, under all-sky conditions. This is an exten-sion of the study by Hatzianastassiou et al. (2004a) dealing with the aerosol direct effect in the ultraviolet and visible (UV-visible) wavelengths. Though the aerosol effect is larger in the UV-visible than in the solar near-IR (e.g. Valero et al., 2003; Nishizawa et al., 2004), it merits evaluation in the longer wavelengths, given that about 40% of solar radiation lies in this spectral range. Near-IR radiation is significantly affected by aerosols (Bush and Valero, 2003), especially in locations with elevated concentrations of coarse aerosol par-ticles (sea-salt and desert-dust). We clarify that our study deals with only solar radiation in the near-IR range and not with the terrestrial radiation. Moreover, note that the contri-bution of solar radiation at wavelengths larger than 3.5 µm to the total solar energy is very small (<2%) so that virtually there is no overlap between solar and terrestrial radiation.
In Sect. 2, we give a short description of the model and the methodology for modelling the aerosol radiative effects. The model input data are described and discussed in Sect. 3, while in Sect. 4 are given the modelled aerosol DREs. In Sect. 5 we quantify and discuss an important aerosol effect on atmospheric thermal dynamics caused by their direct ra-diative effects. Finally, the contribution of near-IR to the to-tal SW aerosol radiative effect and the sensitivity of aerosol DRE to the wavelength dependence of aerosol optical prop-erties are discussed in Sects. 6 and 7, respectively, before the conclusions (Sect. 8).
2 Model and methodology
The deterministic spectral radiative transfer model used here was developed from a radiative-convective model (Vardavas and Carver, 1984). The solar irradiance is computed here for the spectral interval 0.85–10 µm, using the spectral pro-file of Thekaekara and Drummond (1971), normalized to 40.1% of the solar incoming radiation using a solar constant So=1367 W m−2(Hartmann, 1994; Willson, 1997) corrected
in the near-IR under all-sky conditions. The treatment of radiation transfer for the near-IR wavelengths lying in the range 0.85–1.0 µm is the same as that used for the UV-visible range (see Hatzianastassiou et al., 2004a), whereas the treat-ment for the range 1.0–10 µm, divided into ten spectral in-tervals, will be presented here. For each wavelength and spectral interval, a set of monochromatic radiative flux trans-fer equations is solved for an absorbing/multiple-scattering atmosphere using the Delta-Eddington method of Joseph et al. (1976) which is an extension of the Eddington method de-scribed in Shettle and Weinman (1970) with the standard pa-rameters g (asymmetry factor), τ (extinction optical depth), and ω (single scattering albedo) replaced by the following transformations τ′=(1 − ωf ) τ (1) ω′ =(1 − f ) ω 1 − ωf (2) g′= g 1 + g (3)
with f=g2. For the clear-sky case (i.e. part of the geographi-cal cell), we divide the atmosphere into two layers. The low-est begins at the surface and includes atmospheric gases and the aerosols, while the highest layer contains only the atmo-spheric gases above the aerosols. For the cloudy-sky case, the atmosphere is divided into four layers. From the bottom to the top these are: (i) the aerosol layer, (ii) the layer be-tween the aerosols and the cloud base, (iii) the cloud layer and (iv) the layer above the clouds up to the TOA. Note that aerosols above clouds are not considered in this study, due to missing information. This introduces an underestimate of the aerosol effect in the case of absorbing aerosols above clouds (Keil and Haywood, 2003). In particular, studies (e.g. Hay-wood and Shine, 1997; HayHay-wood and Ramaswamy, 1998) have shown that black carbon existing above clouds exerts a DRE that may be greater than that in clear skies by more than a factor of 10, the magnitude of the increase being a function of the cloud optical depth, the surface reflectance and the solar zenith angle. The situation will improve with the emerging ground-based aerosol lidar network and launch of space-borne lidars and radars (Yu et al., 2006). The ra-diatively active gases in the near-IR are water vapour (H2O),
absorption optical depths, respectively. The single scattering albedo for each layer is
ω = ωaer+ωR+ωc (5) where ωaer=τaers/τ , ωR=τR/τ , ωc=τcs/τ (6) while g = gaer·ωaer+gR·ωR+gcωc ω (7)
with gaer the aerosol asymmetry factor, gc the
asymme-try factor of the cloud and gR is the asymmetry factor for
Rayleigh scattering set equal to 0.
For each spectral interval, b, and for each gas i, the mean transmission tb,i,mis computed for each component m of a
discrete probability distribution with coefficients pb,i,m and
absorption coefficients kb,i,m (k-distribution method) with
the normalization condition
X m
pb,i,m=1 (8)
and transmission for component m of gas species i given by
tb,i,m=exp(−kb,i,myi) (9)
where yi is the absorber amount. If there is only species i
which is radiatively active in interval b, then the transmission for the interval is
tb= X
m
pb,i,mtb,i,m (10)
However, if species i and j are active in interval b, the trans-fer equation is solved for all possible combinations of com-ponents m and n corresponding to the species i and j , re-spectively. If Fbis the spectral flux in interval b, then each
component mn has spectral flux pb,i,mpb,j,nFb and optical
depth kb,i,myi+kb,j,nyj. The concept is further generalized
to overlapping bands of more than two types of molecules (see Vardavas and Carver, 1984).
Reflection of incident solar radiation from the Earth’s sur-face is treated as explained by Hatzianastassiou et al. (2005). In brief, the surface reflectivity, Rg, for each 1-degree grid
cell, is computed considering the fractional coverage of the grid cell’s reflecting surface by four general types of surface:
land, ocean, snow and ice (frozen ocean). Information for fractional coverage for each surface type is obtained from ISCCP-D2 data (Rossow et al., 1996). The ocean reflectiv-ity, Ro, is computed using Fresnel reflection corrected for a
non-smooth surface, with the condition that if Fresnel reflec-tivity is greater than ice- or snow reflecreflec-tivity, which occurs for low solar elevations, then the reflectivities of ice or snow are set equal to the Fresnel one (see Hatzianastassiou et al., 2005). Snow and sea-ice albedo values are based on recent estimates, whereas data for land albedo were derived from ERBE data for clear sky, while overcast albedos were ob-tained by modifying the corresponding clear-sky values for diffuse radiation conditions. A correction is applied to land-surface albedo for high-altitude mountainous areas such as Tibet, Rocky Mountains or Antarctica’s plateau, resulting in a reduction of the albedo, in order to take into account the decrease of Rg over mountainous non-forested areas,
espe-cially during winter, due to the sub-grid orography (Roesch et al., 2001). The near-IR aerosol DRE (denoted henceforth as 1F), or more precisely the “aerosol flux change”, is the effect of aerosols on the near-IR (or SW) radiation budget at TOA, at the Earth’s surface, or within the atmosphere, and it is given by
1F = F − Fno−aerosol (11)
where F and Fno−aerosol are the net incoming (downward–
upward) near-IR (or SW) radiative fluxes with and with-out aerosols, respectively. The DRE components 1FTOA, 1Fatmab, 1Fsurf, and 1Fsurfnet, represent the effect of
aerosols on the net incoming (absorbed) radiation at TOA, within the atmosphere, and at the Earth’s surface. 1FTOA
is essentially the change of the outgoing (reflected) near-IR (or SW) radiation at TOA, since the incoming extraterrestrial near-IR (or SW) radiation is not affected by aerosols, and therefore 1FTOAwill refer to this henceforth. Thus, at TOA
Eq. (11) reads
1FTOA=Fno−aerosolTOA −FTOA (12)
Therefore, positive values of 1FTOAcorrespond to decreased
outgoing near-IR (or SW) radiation at TOA, and increased absorbed near-IR (or SW) radiation within the atmosphere and at the Earth’s surface, and vice versa.
The methodology followed here is similar to that used by Hatzianastassiou et al. (2004a). The spectral aerosol data used (i.e. aerosol optical thickness, AOT, single scattering albedo, ωaer, and asymmetry parameter, gaer), which are
es-sential to the spectral radiative transfer model computations, are taken from GADS. Ten aerosol components, representa-tive of the atmosphere, are provided but we re-compute their optical properties to take into account the effects of relative humidity (see Hatzianastassiou et al., 2004a), based on actual climatological data from the Goddard Earth Observing Sys-tem (GEOS) version 1 reanalysis product, provided by the Data Assimilation Office (DAO) of NASA’s Goddard Space
Flight Center (GSFC). The model aerosol DRE computations also include global distribution of surface albedo and clouds from comprehensive global climatological databases (NASA Langley Research Center dataset and ISCCP). The study is performed on a global scale, on a 1◦latitude-longitude
res-olution, for winter and summer conditions, for the 12-year period from 1984 to 1995.
3 Aerosol properties and model input data 3.1 Aerosol data and properties
The required aerosol radiative properties, AOT, ωaer, and gaer, were taken from GADS (Koepke et al., 1997). The
dataset GADS consists of aerosol particle properties aver-aged over space and time, and has been used in climate mod-els and studies (e.g. King et al., 1999; Chin et al., 2002; Morcrette, 2002; Kinne et al., 2003). A detailed discus-sion of GADS aerosol properties was given in the study by Hatzianastassiou et al. (2004a), where the same data were used to compute the UV-visible aerosol DRE. In GADS, the tropospheric aerosol particles are described by 10 main aerosol components, which are representative for the atmo-sphere, resulting from aerosol emission, formation, and re-moval processes within the atmosphere, so that they exist as mixture of different substances, both external and inter-nal. The GADS 10 aerosol components are: water-insoluble, water soluble, soot, sea-salt accumulation mode, sea-salt coarse mode, mineral nucleation mode, mineral accumula-tion mode, mineral coarse mode, mineral transport mode, and sulphate (nucleation, accumulation, coarse, and trans-port modes deal with size classes for sea-salt and mineral aerosols). For each aerosol component, the optical prop-erties, i.e. the extinction, scattering, and absorption coef-ficients, single scattering albedo, asymmetry factor, phase function, and optical depth, are calculated with Mie theory at 61 wavelengths from 0.25 to 40 µm, and for 8 values of relative humidity (0, 50, 70, 80, 90, 95, 98, and 99%), while visibility and Angstrom coefficient are also provided. The columnar aerosol properties are calculated on the basis of exponential aerosol height profiles (Jaenicke, 1993; Koepke et al., 1997; Hess et al., 1998). Global distributions of GADS aerosol properties are given as climatologically averaged val-ues both for the periods December through February ern Hemisphere winter) and June through August (North-ern Hemisphere summer) seasons on a 5◦ by 5◦
latitude-longitude resolution. However, to match the spatial resolu-tion of the climatological parameters, especially that of rel-ative humidity to which the aerosol properties are sensitive, the original GADS aerosol optical properties were up-scaled to 1◦×1◦ latitude-longitude resolution, as explained in the
next paragraph.
The aerosol properties originally taken from GADS for 8 values of relative humidity (see previous paragraph) were
(i-a)
(i-b)
(ii-a)
(ii-b)
(iii-a)
(iii-b)
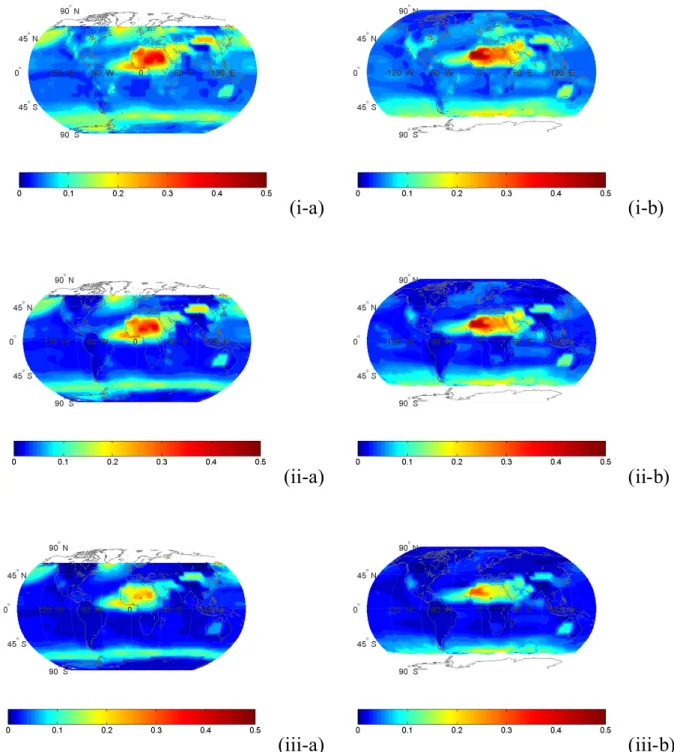
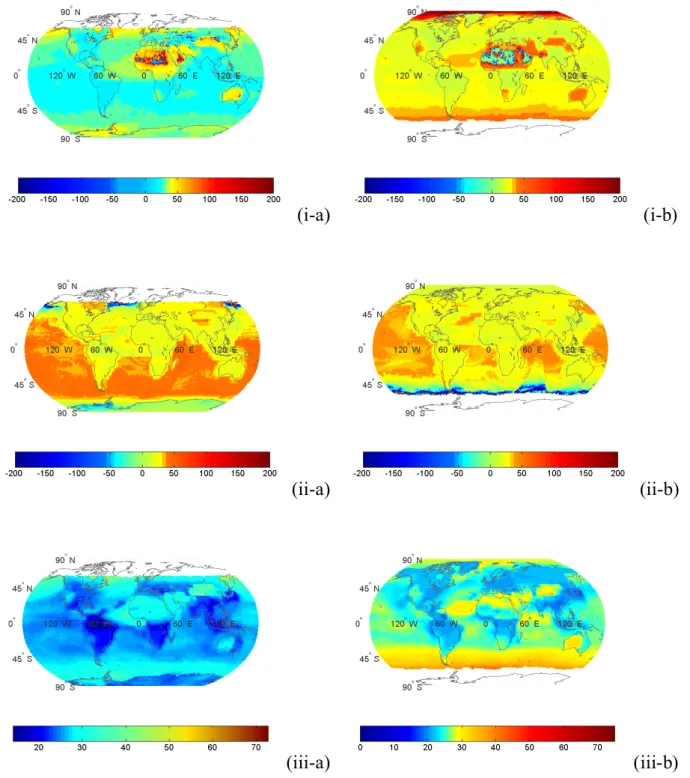
Fig. 1. Global distribution of aerosol optical thickness at (i) 0.9 µm, (ii) 1.75 µm, and (iii) 3.5 µm, for (a) January and (b) July.
re-computed for actual relative humidity values for the aerosol layer, in order to compute realistically the aerosol DREs. These properties originally taken from GADS, were re-computed for actual relative humidity values for the aerosol layer, in order to compute realistically the aerosol ra-diative DREs. This was done by using atmospheric profiles of temperature and specific humidity, taken from the GEOS Reanalysis Project for the years 1984–1995, Subsequently,
the effective mean (computed by convoluting the relative hu-midity with altitude and the aerosol particle concentration decrease with height) relative humidity value was estimated, corresponding to the tropospheric aerosol layer extent.
The GADS aerosol properties are given at 29 wavelengths within 0.85 to 10 µm. These are: 0.9, 1.0, 1.25, 1.5, 1.75, 2.0, 2.5, 3.0, 3.2, 3.39, 3.5, 3.75, 4.0, 4.5, 5.0, 5.5, 6.0, 6.2, 6.5, 7.2, 7.9, 8.2, 8.5, 8.7, 9.0, 9.2, 9.5, 9.8 and 10.0 µm.
(i-a)
(i-b)
(ii-a)
(ii-b)
(iii-a)
(iii-b)
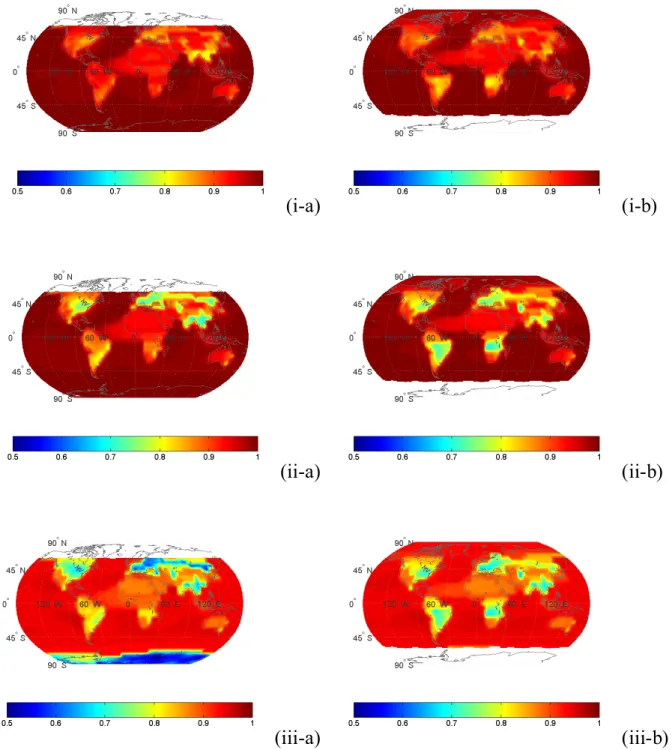
Fig. 2. Global distribution of aerosol single scattering albedo at (i) 0.9 µm, (ii) 1.75 µm, and (iii) 3.5 µm, for (a) January and (b) July.
The spectral model computations are performed for specific wavelengths and spectral intervals in the near-IR. Thus, the model required AOT, ωaer, and gaerfor these wavelengths and
intervals were obtained through interpolation. Finally, the near-IR radiative fluxes at TOA, within the atmosphere, and at the Earth’s surface, were computed for each wavelength and spectral interval, with and without aerosols, which were then summed to yield the near-IR radiative fluxes, and from their difference the radiative effects (Eq. 11).
As examples, the global distribution of GADS-derived aerosol optical properties are given in Figs. 1, 2 and 3, for the wavelengths 0.9 µm, 1.75 µm and 3.5 µm, respectively, computed for the ambient aerosol layer humidity, for North-ern Hemisphere winter (January) and summer (July) condi-tions. Blanks in Figs. 1 to 3 correspond to areas with missing data. It can be seen that AOT values (Fig. 1) decrease with increasing wavelength, especially over highly populated and industrialized areas (e.g. Europe, North and South America,
(i-a)
(i-b)
(ii-a)
(ii-b)
(iii-a)
(iii-b)
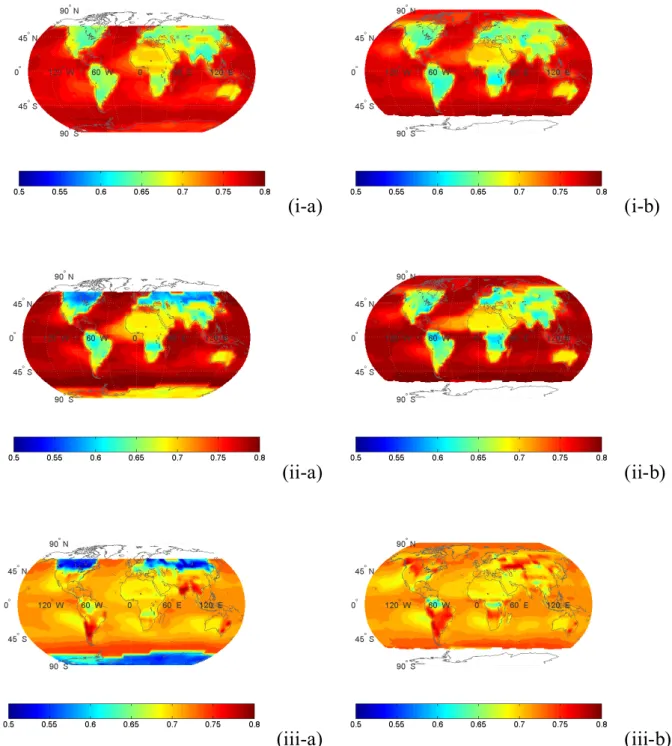
Fig. 3. Global distribution of aerosol asymmetry parameter at (i) 0.9 µm, (ii) 1.75 µm, and (iii) 3.5 µm, for (a) January and (b) July.
South and South-East Asia) with fine particles. In contrast, areas with coarse particles such as North Africa, Arabian and Gobi deserts or the windy zone (around 60◦S) of the
Southern Hemisphere, maintain relatively high AOT values for near-IR wavelengths, because of the large sizes of dust and sea-salt particles. In those areas, AOT values are up to 0.47 at 0.9 µm and 0.32 at 3.5 µm, whereas they are smaller than 0.1 at all wavelengths for the rest of globe. The single
scattering albedo values (Fig. 2) range from 0.5 to 1 in the near-IR range. Large values of ωaerare found over oceanic
areas with sulphate and sea-salt particles, decreasing to about 0.65 over continental areas with water soluble, water insol-uble and soot components (e.g. Europe, North and South America, South and South-East Asia). According to GADS, the water insoluble part of aerosol particles are a mixture of dust (soil particles) and organic material, whereas the water
soluble part consists of various kinds of sulphates, nitrates, and other, also organic, water soluble substances. The sin-gle scattering albedo for water soluble substances indicates relatively high absorption properties, while the assumed re-fractive index values indicate a slightly absorbing water solu-ble component. As for the GADS soot component, it is used to represent absorbing black carbon particles characterized by its high imaginary part of the refractive index. In con-trast to water soluble and insoluble as well as soot compo-nents, sea-salt and sulphate components are highly scattering as indicated by an associated extremely low imaginary part of the refractive indices (see Koepke et al., 1997). It is in-teresting that over desert areas, but also over oceanic regions characterized by dust transport (such as tropical Atlantic, and western Pacific off the Asian coast), the ωaervalues are larger
in the near-IR than in the UV-visible wavelengths. For exam-ple, over North Africa in July, ωaeris equal to 0.93 at 0.9 µm
and 0.87 at 3.5 µm (Fig. 2), against 0.65 at 0.25 µm (see Fig. 2 of Hatzianastassiou et al., 2004a). This is explained by the decreasing imaginary refractive index of mineral compo-nents from the UV through to about 1.0 µm, before increas-ing again at larger wavelengths. Note also the drastic drop of ωaer over Antarctica in January, due to the composition
of Antarctic aerosols from sulphate solution (Koepke et al., 1997). The aerosol asymmetry parameter (Fig. 3) has values in the near-IR varying between 0.5 and 0.81, i.e. lower than corresponding values in the UV-visible (0.6–0.85, Hatzianas-tassiou et al., 2004a). More forward scattering from aerosols is indicated by larger oceanic than continental gaervalues. In
general, gaer decreases with increasing wavelength.
How-ever, over areas dominated by a large mass concentration of mineral aerosols (e.g. Sahara, Gobi, western Australia)
gaer remains unchanged with increased wavelength, whilst
over regions with strong water insoluble aerosol components (e.g. South America, eastern USA, Europe, South and South-East Asia in January), there is an increase in gaerfrom 0.9 to
3.5 µm.
3.2 Other data
The molecules considered in this study relevant to the near-IR range of wavelengths were: H2O, CO2and CH4. Their
absorption was treated as explained in the previous section (2). The Rayleigh scattering due to atmospheric molecules, which is important only for wavelengths up to 1 µm, is con-sidered in the model in the way described by Vardavas and Carver (1984) and Hatzianastassiou et al. (2004a). The total atmospheric amounts for atmospheric molecules were par-tially distributed into each atmospheric layer according to its physical thickness as part of the total atmospheric column height.
The water vapour and temperature data were based on the GEOS-1 reanalysis product (6-hourly), averaged to a daily temporal resolution. Atmospheric temperature and humidity profiles for the years 1984 through to 1995 were used to
com-pute the mean relative humidity of the aerosol layer. Cloud data on a 1◦×1◦ resolution were taken from the
NASA-Langley data set based on GEWEX ISCCP DX cloud cli-matologies. The mean daily 1◦
×1◦ NASA-Langley cloud
data were compiled by processing the 3-hourly ISCCP-DX pixel-level data, which contain radiance and cloud retrieval information from geosynchronous and polar orbiting satel-lites sampled to a nominal resolution of 30 km. All 30 km DX pixels within a grid cell are averaged analogously to the methods of ISCCP (e.g. Rossow et al., 1996) to produce grid-ded radiance and cloud products. The NASA Langley 1◦×1◦
cloud data include: cloud amount, top pressure, cloud-top temperature, liquid water path, and optical depth for to-tal clouds. They also provide cloud amount and cloud-top temperature for low-, mid-, and high-level clouds, as well as cloud amount, cloud-top temperature, cloud optical depth, and cloud albedo separately for ice and liquid water phase clouds. We used in our study cloud amount, cloud optical depth and cloud-top pressure.
The surface reflection is computed as in Vardavas and Koutoulaki (1995), Hatzianastassiou et al. (2004a) and Hatzianastassiou et al. (2005), by using surface-type cover fractions on a mean daily and 1-degree geographical cell res-olution for the years 1984–1995. Ice/snow cover data were taken from ISCCP, while surface type classification maps were obtained from other high resolution data sets (Stack-house et al., 2002).
A complete topography scheme is included in the model, which uses the NASA DAO GEOS-1 surface pressure, grid-ded on 1◦×1◦cells. Consideration of topography is
impor-tant for regions well above sea-level, for the correct compu-tation of the mean aerosol layer humidity, but also for the correct computation of total atmospheric amount of each gas for the actual extent of the atmospheric column for a given geographical cell on the globe.
4 Model computations of near-infared aerosol radiative effects
The spectral model computations were performed using the spectral (see Sect. 3.1) GADS aerosol properties. The near-IR radiative fluxes at TOA, within the atmosphere, and at the Earth’s surface, were computed for each wavelength and spectral interval, with and without aerosols, which were then summed to yield the near-IR radiative fluxes, and from their difference the radiative effects (Eq. 11). The computed total near-IR mean monthly (winter and summer) aerosol DREs for each cell (1◦ longitude-latitude) are given in terms of
outgoing radiation at TOA (1FTOA), atmospheric absorption
(1Fatmab) and net downward or absorbed radiation at the
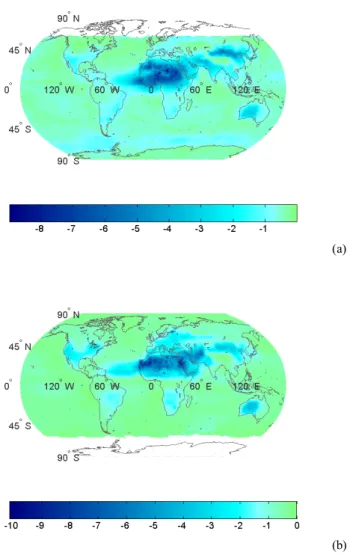
IR radiation at TOA (negative values of 1FTOA), by up to
6 W m−2 on a mean monthly basis, producing thus
plane-tary cooling. Over most of the globe, the change in near-IR radiation is smaller than 1–2 W m−2. The large values
of 1FTOA occur over continental desert areas (e.g. Sahara,
Arabian peninsula, Gobi, Australia), over oceanic areas with strong dust transport above (e.g. tropical Atlantic Ocean) and over remote oceanic areas with intense production of sea-spray (storm-track zone of the Southern Hemispere). In par-ticular, as far as dust is concerned, studies (e.g. Sokolik and Toon, 1999; Kaufman et al., 2001) have shown that the treat-ment of particle aggregation is crucial for the dust radiative effect, since this can be reversed from positive to negative and vice-versa. In GADS, mineral aerosol or desert dust pro-duced in arid regions consists of quartz and clay minerals (e.g. hematite). These particles are described by four com-ponents having the same refractive index but different sizes (see Koepke et al., 1997). The refractive index is based on a compilation of data as discussed by Carlson and Benjamin (1980) and Sokolik et al. (1993). In spite of the general near-IR planetary cooling, aerosols can produce a warming of the Earth-atmosphere system by decreasing the outgoing near-IR radiation at TOA, by up to 1 W m−2. This occurs
over Greenland in July and over limited areas (e.g. Sahara) with large surface albedo and significant loads of absorbing aerosols, as also reported in previous studies (e.g. Ming et al., 2005). In general, under all-sky conditions, the effect of aerosols on the outgoing near-IR radiation at TOA is smaller than their effect on the UV-visible wavelengths (values rang-ing from −9 to 8.5 W m−2, not shown here). The
magni-tude of 1FTOAfor a specific place on the globe is not only
determined by aerosol optical properties such as AOT, ωaer
and gaer, but also by cloud cover and surface albedo, apart
from the incoming solar flux. The role of cloud cover is indi-cated by large values appearing in regions with small cloudi-ness, e.g. sub-Sahel, Gobi and Australian deserts in January. In July, large negative values (up to minus 5–6 W m−2)
ex-ist over limited maritime areas such as the southern part of the eastern Mediterranean basin and the Red Sea, and sec-ondarily over continental areas such as Australia. Negative values (up to −1 W m−2) appear over Sahelian and Sahara
regions with large AOT, small cloudiness and large (0.3–0.4) surface albedo. The role of surface albedo is very impor-tant in determining the sign of 1FTOA. Thus, highly
reflect-was verified through sensitivity studies performed with our model. Another case of positive near-IR DRE at TOA is in Greenland, where 1FTOA∼=0.2 W m−2in July; positive DRE
appears there despite the small aerosol load (AOT<0.1) be-cause of large surface albedo. Note also the relatively large values of 1FTOA(∼=−1 W m−2) along the storm-track zone
of the Southern Hemisphere in January, due to the aerosol optical thickness values of ∼=0.1–0.2 and relatively low
sur-face albedo (<0.15–0.2). In contrast, 1FTOAis smaller in
July despite the significant AOT values (similar to those of January), because of the increased surface albedo (0.3–0.35) due to increased Fresnel reflection (and solar zenith angle, see Hatzianastassiou et al., 2004a) under cloud-free condi-tions and the small amount of incoming solar radiation at that season.
4.2 Aerosol direct radiative effect in the atmosphere (1Fatmab)
Aerosols are found to increase the near-IR atmospheric ab-sorption (Fig. 5), by as much as 7 W m−2, over areas
charac-terized by significant amounts of absorbing aerosols (such as mineral-dust or soot), especially over highly reflecting surfaces (surface albedo>0.3). Aerosol DRE values up to 2– 3 W m−2are also found over Europe, USA, South America,
South Africa, South and South-East Asia and Australia. The large values of 1Fatmabare either associated with large mass
concentrations of absorbing mineral aerosol components or with significant (but smaller) concentrations of strongly ab-sorbing soot or water soluble and insoluble components. The near-IR aerosol DREs are found to be smaller, by factor of about 0.3, compared to the corresponding UV-visible aerosol DREs, but need to be accounted for in climate studies. In January, the large values of 1Fatmabin sub-Sahel (5◦–10◦N)
and across the tropical Atlantic are attributed to the long-range transport of desert dust in higher atmospheric levels (up to 4.5 km, Formenti et al., 2003) by the “harmattan” trade winds during the dry season. The transport of mineral dust across the Atlantic ocean, as indicated by large values of
1Fatmab, is shifted northwards in July due to the changed
at-mospheric circulation (Azores anticyclone and thermal low of Pakistan). Note that slightly negative 1Fatmabvalues are
found over limited areas, such as the Antarctica, especially its western part (along the coast of Marie Byrd Land), and
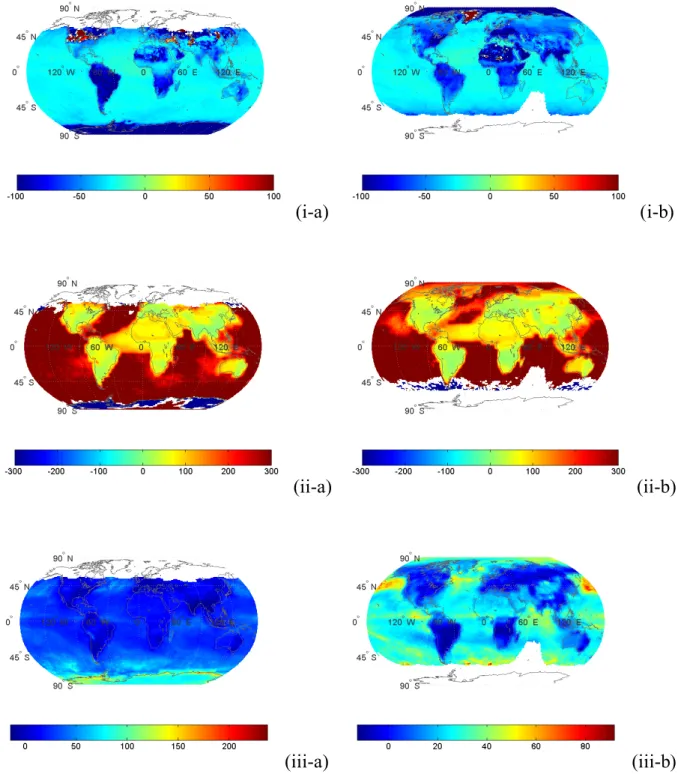
(a)
(b)
Fig. 4. Global distribution of the aerosol direct radiative ef-fect (DRE) on the outgoing near-IR radiation at top-of-atmosphere (aerosol DRE 1FTOA, W m−2), for (a) January and (b) July.
the northernmost parts of the Atlantic and Pacific oceans in January, as well as along the windy oceanic zone of the Southern Hemisphere in July, i.e. over areas with significant loads of highly scattering aerosols. In these cases, the atmo-spheric layer including scattering aerosols (water-soluble or sea-salt) is high enough and absorbs less near-IR radiation than it would do without these particles. Such behavior does not occur in the UV-visible wavelengths (Hatzianastassiou et al., 2004a).
4.3 Aerosol direct radiative effect at surface (1Fsurfnet)
Our model results (Fig. 6) indicate that aerosols decrease gionally the surface downward (not shown here since the re-sults are very similar to those for the absorbed component) and the absorbed near-IR radiation at the Earth’s surface by up to 12 and 10 W m−2, respectively, producing thus an
im-portant surface radiative cooling. The largest decreases in
(a)
(b)
Fig. 5. Global distribution of the aerosol direct radiative effect
(DRE) on the atmospheric absorption of near-IR radiation (aerosol DRE 1Fatmab, W m−2), for (a) January and (b) July.
surface near-IR radiation are found over areas with signif-icant aerosol amounts (AOT). Thus, over desert areas dur-ing summer the surface absorption of near-IR radiation is decreased by up to 10 W m−2due to the scattering and
ab-sorption of aerosols. In the rest of the continental areas, aerosols produce a radiative near-IR cooling of the surface up to 2–3 W m−2. According to our model computations, the
aerosol effect on near-IR radiation at the surface is larger, by up to 3–4 times, than at TOA at geographical cell level, i.e. the ratio 1Fsurfnet/1FTOAtakes slightly larger values in
the near-IR than in the UV-visible range for which the ra-tio is about 3 (Hatzianastassiou et al., 2004a). Lelieveld et al. (2002) have reported a factor of 2.7 from aerosol ra-diative forcing computations based on measurements of the Mediterranean Intensive Oxidation Study, performed in sum-mer 2001 in Crete (Greece). In general, the near-IR aerosol DRE values at the surface are smaller in magnitude than the corresponding UV-visible by 2–3 times. However, the ratio
in the computations, and the results are given in Table 1. The largest effect of aerosols on near-IR radiation is found at the surface, where the downward and absorbed fluxes are decreased by about 1.0 and 0.85 W m−2, respectively, on
global scale. In the atmosphere, the presence of aerosol par-ticles increases the absorption of near-IR radiation by about 0.4 W m−2, whereas the globally averaged reflected near-IR
flux to space is found to increase by about 0.5 W m−2.
Over-all, the presence of aerosols results in atmospheric warming due to absorption of near-IR solar radiation, a stronger sur-face near-IR radiative cooling, and a near-IR cooling of the Earth-atmosphere system. These near-IR DREs are in quali-tative agreement with the corresponding effects at UV-visible wavelengths (Hatzianastassiou et al., 2004a) but smaller in magnitude. However, they are still very important for cli-mate since their magnitude is of the order of 1 W m−2.
The near-IR DRE values are generally larger in the more polluted Northern Hemisphere than in the Southern, by fac-tors ranging from 1.2 to 6 depending on the DRE compo-nent and month. The largest inter-hemispherical differences occur for the aerosol effect on atmospheric absorption of near-IR flux, with the ratio 1Fatmab(North)/1Fatmab(South)
equal to 3 and 6 in January and July, respectively. In general, there are small differences between the magnitude of aerosol DRE values in January and July, as also reported by Koepke et al. (1997). Nevertheless, large seasonal differences (be-tween January and July) are found with respect to the inter-hemispherical contrast in DRE magnitude. For example, the much larger ratio, 1Fatmab(North)/1Fatmab(South), in July
(6.1) than in January (3.1) arises from the seasonal cycles of mineral dust and biomass burning in the two hemispheres.
5 Aerosol radiative effect on atmospheric thermal dy-namics
As shown in Sects. 4.2 and 4.3, aerosols cool the Earth’s sur-face by scattering to space and through atmospheric absorp-tion. Therefore, the presence of aerosols has a significant effect on the thermal dynamics of the Earth-atmosphere sys-tem. By cooling the surface and warming the atmosphere, aerosols act to produce more stable atmospheric conditions by decreasing convective activity. They also reduce evapora-tion from the surface, and so can have a significant effect on
(a)
(b)
Fig. 6. Global distribution of the aerosol direct radiative effect
(DRE) on the absorbed near-IR radiation by the Earth’s surface (aerosol DRE 1Fsurfnet, W m−2), for (a) January and (b) July.
the hydrological cycle by suppressing cloud formation (es-pecially the convective) and associated precipitation. This aerosol redistribution of near-IR radiative energy between the Earth’s surface and the atmosphere, was also found for the UV-visible (Hatzianastassiou et al., 2004a). This highlights the role of modifying atmospheric particulate matter (amount and composition) on climate, especially in climatically sen-sitive regions such as the desertification threatened Mediter-ranean basin. We quantify the magnitude of this aerosol ef-fect on thermal dynamics (AETD) by the difference
AETD = 1Fatmab−1Fsurfnet (13)
given in Fig. 7.
The magnitude of AETD can be up to 13 and 16 W m−2
for January and July, respectively, with a magnitude up to 5 and 2 W m−2over most continental and oceanic areas,
re-spectively. It is interesting to note that the largest effect of aerosols on thermal dynamics occurs over deserts and nearby
Table 1. Mean global and hemispherical (NH, SH) all-sky near-IR aerosol direct radiative effect (DRE, denoted as 1F in W m−2) for January and July. The DRE components are given in terms of: outgoing radiation at TOA (1FTOA), radiation absorbed in the atmosphere (1Fatmab), downward radiation at surface (1Fsurf), and net downward (absorbed) radiation at surface (1Fsurfnet).
1FTOA 1Fatmab 1Fsurf 1Fsurfnet
January Globe −0.5 0.36 −1.04 −0.85 North Hemisphere −0.62 0.49 −1.4 −1.12 South Hemisphere −0.43 0.16 −0.71 −0.59 July Globe −0.47 0.39 −1.02 −0.86 North Hemisphere −0.51 0.67 −1.45 −1.18 South Hemisphere −0.43 0.11 −0.59 −0.54 (a) (b)
Fig. 7. Aerosol near-IR radiative effect on atmospheric thermal
dy-namics (1Fatmab−1Fsurfnet, in W m−2), for (a) January and (b) July.
desertification threatened regions. Of course, this aerosol ra-diative effect is further amplified when the corresponding ef-fect at UV-visible wavelengths is also included (not shown here).
6 Contribution of near-infared to total shortwave aerosol direct radiative effect
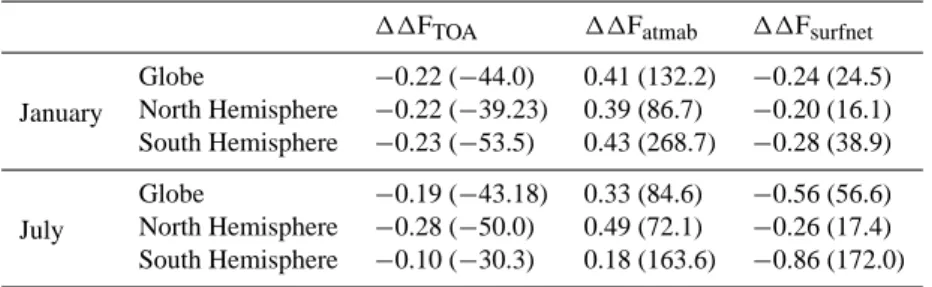
In order to quantify the relative contribution of near-IR to the total SW aerosol direct radiative effect, the percentage of total DRE due to the near-IR was computed for the three components (at TOA, in the atmosphere and at surface), for January and July, and the results are given in Fig. 8. As for
1FTOA, over most regions, the near-IR DRE contribution to
the total SW DRE is 25–30%. Nevertheless, over extended desert areas (e.g. Sahara, Arabian, Australian, Gobi) the con-tribution rises to about 50%, and over limited areas it even exceeds the magnitude of the total SW DRE (values up to 200% or even larger). At first sight this may seem strange but it can be explained by the different sign of aerosol DRE at TOA (1FTOA) for the near-IR and the UV-visible. The sum
of the UV-visible and near-IR components is smaller than the components themselves. This also explains the existence of negative values in Fig. 8, over limited regions. The changing sign of 1FTOA between the UV-visible and near-IR
wave-lengths is attributed to: (i) the decrease in AOT towards the near-IR; (ii) the decrease in surface albedo over snow (e.g. Roesch et al., 2002), sea-ice (e.g. Allison, 1993) or land-ice (e.g. Hansen et al., 1983; Roesch et al., 2002) with increas-ing wavelength; (iii) the increase of ωaer, e.g. from values of
about 0.65 at 0.25 µm to 0.88 at 3.5 µm over the Sahara in July; and (iv) the decrease of gaer, e.g. from values of about
0.82 at 0.25 µm to 0.67 at 3.5 µm over the Sahara in July. The combination of all the above results in a near-IR 1FTOA
with opposite sign to that of the UV-visible 1FTOAover
ar-eas such as the Sahara and the Arctic in July. Consequently, careful consideration of the spectral dependence of aerosol DRE at TOA is required to avoid erroneous conclusions re-garding the role of aerosols for the Earth’s climate (planetary warming instead of cooling and vice versa).
The contribution of near-IR to total SW DRE in the at-mosphere (1Fatmab) generally varies between 25 and 50%
(Fig. 8ii). However, there are extended oceanic areas (e.g. Pacific, South Altantic, Indian ocean) with values up to 70%. This is due to the comparatively stronger absorption
(i-a)
(i-b)
(ii-a)
(ii-b)
(iii-a)
(iii-b)
Fig. 8. Percent contribution of near-IR to the total SW aerosol direct radiative effect at: (i) TOA (1FTOAnear−IR/1FTOAtotal−SW), (ii) in the
atmosphere (1Fatmabnear−IR/1Fatmabtotal−SW), and (iii) at surface (1Fsurfnetnear−IR/1Fsurfnettotal−SW), for (a) January and (b) July.
of near-IR than UV-visible radiation by sea-salt aerosols (remote – pure oceanic) because of the increasing imagi-nary part of refractive index towards near-IR wavelengths (Koepke et al., 1997), opposite to aerosol populations with anthropogenic components. Note that over specific regions (e.g. western part of Antarctica, middle-to-polar oceanic re-gions of the Northern Hemisphere) there are negative values,
i.e. the atmosphere over those areas absorbs less near-IR ra-diation than it would do without aerosols included. This can occur when an aerosol layer, with a critical particle concen-tration, extends high up in the atmosphere, preventing thus penetration and absorption of radiation in the lower atmo-sphere.
(a)
(b)
Fig. 9. Absolute and percent contribution of globally averaged
near-IR and UV-visible aerosol direct radiative effects (DRE) to the total SW aerosol DRE at: TOA (1FTOA), in the atmosphere (1Fatmab), and at surface (1Fsurfnet), for (a) January and (b) July.
The contribution of near-IR aerosol DRE at the surface to the total SW DRE, has in general values varying within the range 20–30%. Only over limited regions this contribution can be larger (up to about 50%). Note that contributions of near-IR to total SW aerosol DRE at surface as large as 45% have been reported from measurements during the INDOEX and ACE-Asia experiments on the local spatial scale and di-urnal resolution, for a spectral coverage starting at 0.68 µm instead of 0.85 µm in our study. Nishizawa et al. (2004), from 2-year measurements in Japan, reported that the UV-visible aerosol forcing at the surface is almost 4 times larger than in near-IR, in agreement with our results. According to our study, on a global scale, the stronger radiative effect of aerosols on surface solar radiation lies in the UV-visible wavelengths, being larger than in the near-IR by a factor of 2.5 to 4. The fraction of total SW aerosol DRE contributed by the near-IR is somewhat smaller than the corresponding frac-tion of the total SW flux contributed by the near-IR (about
40%). This indicates that the two broad spectral intervals of the total solar spectrum (i.e. the UV-visible and the near-infrared) are affected by aerosols to a different extent.
On mean global basis, the near-IR aerosol DRE compo-nents (at TOA, in the atmosphere, and at surface) are found to contribute to the corresponding total solar DRE, by a per-centage varying within the range 22–30%, depending on the DRE component and the season (Fig. 9). The near-IR con-tribution for DRE at TOA (1FTOA) is about 30%, for the
atmospheric DRE (1Fatmab) it is about 22%, whereas for the
surface DRE (1Fsurfnet) it is about 27%. Overall, the largest
relative contribution of near-IR to total SW aerosol DRE is found for 1FTOA, and the smallest for 1Fatmab. The
contri-bution is larger in January than in July, for all DREs.
7 Sensitivity of aerosol direct radiative effect to the wavelength dependence of aerosol optical properties In order to assess the sensitivity of aerosol DREs to the wave-length dependence of aerosol optical properties, we have per-formed detailed sensitivity tests with our model, in which the averaged near-IR GADS aerosol optical properties were used in the model instead of the spectral ones used to compute the aerosol DREs presented in this study. The results of these sensitivity tests for the aerosol DREs at TOA, in the atmo-sphere, and at the Earth’s surface and (1FTOA, 1Fatmoaband 1Fsurfnet, respectively) are shown in Fig. 10. The forcing
sensitivities (in absolute and percentage terms) are defined as follows 11Fi =1Fspectral−1Fbroadband (14) 11Fi% = 11Fi 1Fspectral ×100 (15)
where 1Fspectral and 1Fbroadband are the aerosol DREs
computed using detailed spectral and spectrally averaged near-IR aerosol optical properties. According to Eq. (14) positive/negative values of 11Fi involve
underestima-tion/overestimation of the computed 1Fiusing spectrally
av-eraged aerosol optical properties with respect to those ob-tained using detailed spectral properties.
For the DRE in the atmosphere (1Fatmoab) according to
our results, there is generally larger sensitivity over ocean than land (Fig. 10b). Using spectrally averaged aerosol op-tical properties instead of detailed ones leads to a signif-icant underestimation over ocean (differences spectral mi-nus broadband 11Fatmoab up to 300%), but also over land
(11Fatmoab up to 100%). Especially, large
underestima-tion of 1Fatmoabis obtained over areas dominated by coarse
desert dust particles. Nevertheless, a significant overesti-mation (negative values of 11Fatmoab) is obtained as well
over limited areas off the Antarctica coasts in January, and in some northern parts of the storm-track zone of Southern Hemisphere in July. In general, the sensitivity of 1Fatmoab
(i-a)
(i-b)
(ii-a)
(ii-b)
(iii-a)
(iii-b)
Fig. 10. Global distribution of percentage differences (11F in %) in the reference aerosol direct radiative effects 1F, for (a) January and (b)
July, produced by using averaged near-IR aerosol optical properties (AOT, extinction aerosol optical thickness; ωaer, aerosol single scattering albedo; gaer, aerosol asymmetry parameter) instead of the spectral ones (reference DREs).
is found to be largest over areas with coarse desert dust or maritime aerosols, whereas it is smaller over areas with fine aerosols (e.g. America, Europe, South and South-East Asia, eastern Australia). This can be explained by the fact that the values of absorption AOT (and coefficient) in the near-IR
wavelengths are quite smaller for the fine than coarse aerosol types (see e.g. Almeida et al., 1991). This dominates actually the stronger spectral decrease of AOT in the near-IR wave-lengths for the fine than coarse aerosols.
Table 2. Differences (11F in W m−2) in model mean annual global and hemispherical (NH, SH) all-sky near-IR aerosol direct radiative effects 1F (in W m−2), for January and July, produced by using averaged near-IR aerosol optical properties (AOT, extinction aerosol optical
thickness; ωaer, aerosol single scattering albedo; gaer, aerosol asymmetry parameter) instead of the spectral ones (reference DREs). The forcings are explained in Table 1. The forcing changes 11F in parentheses are given as percentage changes of the reference-case DREs.
11FTOA 11Fatmab 11Fsurfnet
January Globe −0.22 (−44.0) 0.41 (132.2) −0.24 (24.5) North Hemisphere −0.22 (−39.23) 0.39 (86.7) −0.20 (16.1) South Hemisphere −0.23 (−53.5) 0.43 (268.7) −0.28 (38.9) July Globe −0.19 (−43.18) 0.33 (84.6) −0.56 (56.6) North Hemisphere −0.28 (−50.0) 0.49 (72.1) −0.26 (17.4) South Hemisphere −0.10 (−30.3) 0.18 (163.6) −0.86 (172.0)
As for the sensitivity of the aerosol direct radiative effect at TOA (1FTOA, Fig. 10a) it is found that using
spectrally-averaged aerosol optical properties in the near-IR spectral range, instead of detailed ones, results mostly in an over-estimation of 1FTOA over the globe (negative values of 11FTOA). Differences up to −100% are computed over
ex-tended continental world regions (North and South Amer-ica and AfrAmer-ica, Europe, South and South-East Asia, Antarc-tica in January and Arctic in July), whereas the differences
11FTOAover ocean are generally smaller than −40%. The
obtained differences are attributed to the spectral behaviour of the extinction and scattering coefficients and of AOT in combination with their magnitude. More specifically, the spectral variation of scattering and extinction coefficients for maritime aerosols is smaller than for continental ones. Apart from the general overestimation when using spectrally aver-aged aerosol optical properties, there appear also some lim-ited geographical regions (over the USA and part of Middle-East in January, Greenland and small areas in North Africa in July) where our computations indicate underestimation (pos-itive values of 11FTOA).
As a result of differences in 1FTOAand 1Fatmoab, between
using spectrally-averaged and detailed spectral aerosol op-tical properties in the radiative transfer model, large differ-ences are also found for the aerosol DRE on surface solar radiation (11Fsurfnet, Fig. 10c). Note that mostly
underes-timation of 1Fsurfnet (positive values of 11Fsurfnet) is
ob-tained over the globe using spectrally-averaged aerosol op-tical properties. In July, the underestimation predominates over much of the globe, being as large as 90%. Rela-tively large underestimation (of about 50%) is obtained over oceanic areas, whereas small overestimation (about -20%) appears over specific continental areas (eastern USA, south-ern America and Africa, Europe, Siberia). Similar pattsouth-erns are found for January, when a strong underestimation (150– 200%) of 1Fsurfnetis found in Antarctica’s coastal areas.
Table 2 diplays the hemispherical and global averages of differences in aerosol DREs (11F) at TOA, in the atmo-sphere and at the surface (1FTOA, 1Fatmoab and 1Fsurfnet,
respectively) between using detailed spectral and spectrally-averaged aerosol optical properties. The sensitivities are given in absolute terms (in W m−2) whereas relative
percent-age changes of the reference aerosol DREs (1Fspectral) are
also provided. As expected, in general, stronger absolute sensitivities are found in the summer hemisphere, which is an indication of the important role of the incoming solar ra-diation. Overall, the sensitivity in computations of aerosol DREs is very large for all components, i.e. at TOA, in the atmosphere and at the surface. Using spectrally-averaged aerosol optical properties produces very important underesti-mations and overestiunderesti-mations of aerosol DREs, depending on the aerosol DRE, the hemisphere and the season. The val-ues of these differences range from 16 to 270% in terms of relative percentage differences (absolute values ranging from
−0.1 to −0.86 W m−2). The relative percentage differences 11F of near-IR aerosol DREs obtained in the present study
are even larger than the corresponding differences for the UV-visible aerosol DREs (see Hatzianastassiou et al., 2004b) but they are smaller in terms of absolute values. Our results indicate that it is important to use detailed spectrally resolved aerosol optical properties in the computation of their direct radiative effects.
8 Conclusions
We used a detailed spectral radiative transfer model together with spectral aerosol optical properties to compute the di-rect radiative effect (DRE) of aerosols on the solar near-IR (λ≥0.85 µm) radiation budget. We estimated the effect of natural plus anthropogenic aerosols on the outgoing near-IR radiation at the top of atmosphere, on atmospheric absorp-tion, and on the downward and absorbed near-IR radiation at the Earth’s surface. The model computations were per-formed under all-sky conditions, using realistic data for all surface and atmospheric parameters, for the 12 years 1984– 1995. The aerosol data (optical thickness, single scatter-ing albedo and asymmetry parameter) were taken from the
properties. The differences obtained in the computed aerosol DREs were very large, exceeding 30% over most areas of the globe for the aerosol DRE at TOA, 75% for the aerosol DRE in the atmosphere, and 20% for the aerosol DRE at sur-face, whereas even much larger differences, reaching 300% in relative percentage terms, were found for specific regions. The absolute differences on a mean hemispherical and global basis, reach values up to −0.28, 0.49 and −0.86 W m−2for
the aerosol DREs at TOA, in the atmosphere and the surface, respectively. The corresponding relative percentage differ-ences are as large as −53%, 268% and 172%.
On a mean global basis, aerosols are found to increase the outgoing near-IR radiation at TOA (planetary cooling) by about 0.5 W m−2, and to radiatively heat the atmosphere
by increasing the absorption of near-IR radiation by about 0.4 W m−2. As a result, the absorbed near-IR radiation by
the Earth’s surface is found to be decreased (surface cooling) by 0.9 W m−2, due to aerosols.
At the regional (pixel) level, it is found that in general, aerosols cool the Earth-atmosphere system, through scatter-ing of near-IR radiation back to space, by up to 6 W m−2.
The largest neIR cooling effect takes place over desert ar-eas such as Sahara, as well as over oceanic regions with dust transport (e.g. tropical Atlantic). Beyond the general plan-etary cooling, aerosols are also found to produce warming (by up to 1 W m−2) over Greenland in July and over limited
areas in the Sahara. According to our results, the aerosol particles warm the atmosphere, except for some rare cases, by absorbing near-IR radiation (by up to 7 W m−2). The
largest aerosol-produced near-IR atmospheric warming oc-curs above areas characterized by strongly absorbing min-eral dust particles, especially over highly reflecting deserts. Over some regions, such as the western Antarctic or the windy zone of the Southern Hemisphere, aerosols are found to slightly decrease atmospheric absorption of near-IR radi-ation (atmospheric cooling). The strongest effect of aerosols is found at the surface, where the downward and absorbed near-IR radiation is decreased by up to 12 and 10 W m−2,
respectively, due to aerosol scattering and absorption. The near-IR aerosol DRE at the surface is larger than at TOA by a factor of 3 to 4, which indicates the important role of aerosols for surface processes and the surface radiation budget.
The aerosol-produced surface near-IR cooling combined with an associated atmospheric warming, produces a
signif-such as the Mediterranean basin.
Our modelling study indicates that the near-IR aerosol DRE is generally smaller in magnitude than the correspond-ing DRE in the UV-visible, and contributes to the total SW aerosol DRE by about 30%. This relative contribution is largest for the TOA DRE, and smallest for the atmospheric DRE. Moreover, on a regional basis, the near-IR DRE can be larger than the UV-visible, whereas over specific regions (Sahara, Arctic in July) it can even have opposite sign. This indicates that it is very important to perform detailed spectral computations of aerosol radiative effects (and forcings), in-cluding the near-IR range, in order to asses the climatic role of aerosols.
Acknowledgements. This research was co-funded by the European
Social Fund & National Resources-EPEAEK II – PYTHAGORAS (contract: 1964). The NASA-Langley data were obtained from the NASA Langley Research Center (LaRC) Atmospheric Sciences Data Center (ASDC). The GADS aerosol data were obtained from the Meteorological Institute of the University of Munich, Germany: (http://www.meteo.physik.uni-muenchen.de/strahlung/aerosol/ aerosol.htm).
Edited by: A. Nenes
References
Allison, I.: East Antarctic sea ice: Albedo, thickness distribution, and snow cover, J. Geophys. Res., 98, 12 417–12 429, 1993. Bellouin, N., Boucher, O., Haywood, J., and Reddy, M. S.: Global
estimate of aerosol direct radiative forcing from satellite mea-surements, Nature, 438, 1138–1141, 2005.
Bush, B. C. and Valero, F. P. J.: Surface aerosol radative forcing at GOSAN during the ACE-Asia campaign, J. Geophys. Res., 108(D23), 8660, doi:10.1029/2002JD003233, 2003.
Carlson, T. N. and Benjamin, S. G.: Radiative heating rates for Sa-haran dust, J. Atmos. Sci., 37, 193–213, 1980.
Chin, M., Ginoux, P., Kinne, S., Torres, O., Holben, B. N., Duncan, B. N., Martin, R. V., Logan, J. A., Higurashi, A., and Nakajima, T.: Tropospheric aerosol optical thickness from the GOCART model and comparisons with satellite and Sun photometer mea-surements, J. Atmos. Sci., 59, 461–483, 2002.
Christopher, S. A. and Zhang, J.: Shortwave aerosol radiative forc-ing from MODIS and CERES observations over the oceans, Geo-phys. Res. Lett., 29, 1859, doi:10.1029/2002GL014803, 2002.
D’Almeida, G. A., Koepke, P., and Shettle, E. P.: Atmospheric aerosols: Global climatology and radiative characteristics, 560 pp., A. Deepak Publishing, Hampton, Virginia, USA, 1991. Formenti P., Elbert, W., Maenhaut, W., Haywood, J., and
An-dreae, M. O.: Chemical composition of mineral dust aerosol dur-ing the Saharan Dust Experiment (SHADE) airborne campaign in the Cape Verde region, September 2000, J. Geophys. Res., 108(D18), 8576, doi:10.1029/2002JD002648, 2003.
Hansen, J., Russell, G., Rind, D., Stone, P., Lacis, A., Lebedeff, S., Ruedy, R., and Travis, L.: Efficient three-dimensional global models for climate: Models I and II, Mon. Wea. Rev., 111, 609– 662, 1983.
Hartmann, D. L.: Global Physical Climatology, Academic Press, 411 pp, 1994.
Hatzianastassiou, N., Katsoulis, B., and Vardavas, I.: Global dis-tribution of aerosol direct radiative forcing in the ultraviolet and visible arising under clear skies, Tellus, 56B, 51–71, 2004a. Hatzianastassiou, N., Katsoulis, B., and Vardavas, I.: Sensitivity
analysis of aerosol direct radiative forcings in the ultraviolet – visible wavelengths and consequences for the heat budget, Tel-lus, 56B, 368–381, 2004b.
Hatzianastassiou, N., Fotiadi, A., Matsoukas, C., Drakakis, E., Pavlakis, K. G., Hatzidimitriou, D., and Vardavas, I.: A 17-year global distribution of Earth’s surface shortwave radiation budget, Atmos. Chem. Phys., 5, 2847–2867, 2005,
http://www.atmos-chem-phys.net/5/2847/2005/.
Haywood, J. M. and Shine, K. P.: Multi-spectral calculations of the radiative forcing of tropospheric sulphate and soot aerosols using a column model, Quart. J. Roy. Meteorol. Soc., 123, 1907–1930, 1997.
Haywood, J. M. and Ramaswamy, V.: Global sensitivity studies of the direct radiative forcing due to anthropogenic sulfate and black carbon aerosols, J. Geophys. Res., 103, 6043–6058, 1998. Hess, M., Koepke, P., and Schult, I.: Optical properties of aerosols and clouds: The software package OPAC, Bull. Am. Meteorol. Soc., 79, 831–844, 1998.
Intergovernmental Panel on Climate Change (IPCC): Climate Change 2001, The Scientific Basis, 881 pp., edited by: Houghton J. T., Ding, Y., Griggs, D. J., et al., Cambridge Univ. Press, New York, 2001.
Jacobson, M. Z.: Global direct radiative forcing due to multicompo-nent anthropogenic and natural aerosols, J. Geophys. Res., 106, 1551–1568, 2001.
Jaenicke, R.: Tropospheric aerosols, in: Aerosol-Cloud-Climate In-teractions, edited by: P. Hobbs, pp. 1–31, Academic, San Diego, Calif., 1993.
Joseph, J. H., Wiscombe, W. J., and Weinmann, J. A.: The Delta-Eddington approximation of radiative flux transfer, J. Atmos. Sci., 33, 2452–2459, 1976.
Kaufman, Y. J., Tanr´e, D., Dubovik, O., Karnieli, A., and Remer, L. A.: Absorption of sunlight by dust as inferred from satellite and ground-based measurements, Geophys. Res. Lett., 28, 1479– 1482, 2001.
Kaufmann, Y. J., Tanr´e, D., and Boucher, O.: A satellite view of aerosols in the climate system, Nature, 419, 215–223, 2002. Keil, A. and Haywood, J.: Solar radiative forcing by biomass
burn-ing aerosol particles durburn-ing SAFARI-2000: A case study based on measured aerosol and cloud properties, J. Geophys. Res., 108(D13), 8467, doi:10.1029/2002JD002315, 2003.
King, M. D., Kaufmann, Y. J., Tanr´e, D., and Nakajima, T.: Remote sensing of tropospheric aerosols from space: Past, present, and future, Bull. Am. Meteorol. Sos., 80, 2229–2259, 1999. Kinne, S., Lohmann, U., Feichter, J., Schulz, M., et al.: Monthly
av-erages of aerosol properties: A global comparison among mod-els, satellite data, and AERONET ground data, J. Geophys. Res., 108(D20), 4634, doi:10.1029/2001JD001253, 2003.
Koepke, P., Hess, M., Schult, I., and Shettle, E. P.: Global aerosol data set. Rep. No 243, Max-Planck Institut f¨ur Meteorologie, 44 pp., Hamburg, Germany, 1997.
Lelieveld, L., Berresheim, H., Borrmann, S., et al.: Global air pollu-tion crossroads over the Mediterranean, Science, 298, 794–799, 2002.
Liao, H., Seinfeld, J. H., Adams, P. J., and Mickley, L. J.: Global radiative forcing of coupled tropospheric ozone and aerosols in a unified general circulation model, J. Geophys. Res., 109, D16207, doi:10.1029/2003JD004456, 2004.
Ming, Y., Ramaswamy, V., Ginoux, P. A., and Horowitz, L. H.: Di-rect radiative forcing of anthropogenic organic aerosols, J. Geo-phys. Res., 110, D20208, doi:10.1029/2004JD005573, 2005. Morcrette, J.-J.: The surface downward longwave radiation in the
ECMWF forecast system, J. Climate, 15, 1875–1992, 2002. Nishizawa, T., Asano, S., Uchiyama, A., and Yamazaki, A.:
Seasonal variation of aerosol direct radiative forcing and op-tical properties estimated from ground-based solar radiation measurements, J. Atmos. Sci., 61, 57–72, doi:10.1175/1520-0469(2004)061, 2004.
Reddy, M. S., Boucher, O., Bellouin, N., Schulz, M., Balka-nski, Y., Dufresne, J.-L., and Pham, M.: Estimates of global multicomponent aerosol optical depth and direct radia-tive perturbation in the Laboratoire de M´et´eorologie Dynamique general circulation model, J. Geophys. Res., 110, D10S16, doi:10.1029/2004JD004757, 2005.
Remer, L. A. and Kaufman, Y. J.: Aerosol direct radiative effect at the top of the atmosphere over cloud free ocean derived from four years of MODIS data, Atmos. Chem. Phys., 6, 237–253, 2006, http://www.atmos-chem-phys.net/6/237/2006/.
Roesch, A., Wild, M., Pinker, R., and Ohmura, A.: Compari-son of surface spectral albedos and their impact on the general circulation model estimated surface climate, J. Geophys. Res., 107(D14), ACL 13-1–ACL 13-8, doi:10.1029/2001JD000809, 2002.
Rossow, W. B., Walker, A. W., Beuschel, D. E., and Roiter, M. D.: International Satellite Cloud Climatology Project (ISCCP). Documentation of new cloud datasets, 115 pp., Wold Meteorol. Org. Geneva, 1996.
Shettle, E. P. and Weinmann, J. A.: The transfer of solar irradiance through inhomogeneous turbid atmospheres evaluated by Ed-dington’s approximation, J. Atmos. Sci., 27, 1048–1055, 1970. Sokolik, I. N., Andronova, A., and Johnson, T. C.: Complex
re-fractive index of atmospheric dust aerosols, Atmos. Environ., 27A(16), 2495–2502, 1993.
Sokolik, I. N. and Toon, O. B.: Incorporation of mineralogical com-position into models of the radiative properties of mineral aerosol from UV to IR wavelengths, J. Geophys. Res., 104(D8), 9423– 9999, 1999.
Stackhouse, P. W., Gupta, S. K., Cox, S. J., Mikowitz, C., and Chi-acchio, M.: New results from the NASA/GEWEX Surface Ra-diation Budget project: Evaluating El Nino effects at different
Res. Abstr., 5, 01607, 2003.
Vardavas, I. and Carver, J. H.: Solar and terrestrial parameteri-zations for radiative convective models, Planet. Space Sci., 32, 1307–1325, 1984.
Vardavas, I. and Koutoulaki, K.: A model for the solar radiation budget of the northern hemisphere: Comparison with Earth Ra-diation Budget Experiment data, J. Geophys. Res., 100, 7303– 7314, 1995.
D10S24, doi:10.1029/2004JD005009, 2005.
Zhao, T. X.-P., Laszlo, I., Minnis, P., and Remer, L.: Compari-son and analysis of two aerosol retrievals over the ocean in the Terra/Clouds and the Earth’s Radiant Energy System-Moderate Resolution Imaging Spectroradiometer single scanner footprint data: 1. Global evaluation, J. Geophys. Res., 110, D21208, doi:10.1029/2005JD005851, 2005.