HAL Id: hal-00302135
https://hal.archives-ouvertes.fr/hal-00302135
Submitted on 25 Sep 2006HAL is a multi-disciplinary open access
archive for the deposit and dissemination of sci-entific research documents, whether they are pub-lished or not. The documents may come from teaching and research institutions in France or abroad, or from public or private research centers.
L’archive ouverte pluridisciplinaire HAL, est destinée au dépôt et à la diffusion de documents scientifiques de niveau recherche, publiés ou non, émanant des établissements d’enseignement et de recherche français ou étrangers, des laboratoires publics ou privés.
Modelling the direct effect of aerosols in the solar
near-infrared on a planetary scale
N. Hatzianastassiou, C. Matsoukas, A. Fotiadi, E. Drakakis, P. W. Stackhouse
Jr., P. Koepke, K.G. Pavlakis, D. Hatzidimitriou, I. Vardavas
To cite this version:
N. Hatzianastassiou, C. Matsoukas, A. Fotiadi, E. Drakakis, P. W. Stackhouse Jr., et al.. Modelling the direct effect of aerosols in the solar near-infrared on a planetary scale. Atmospheric Chemistry and Physics Discussions, European Geosciences Union, 2006, 6 (5), pp.9151-9185. �hal-00302135�
ACPD
6, 9151–9185, 2006N. Hatzianastassiou et al.
Near infrared aerosol direct radiative forcing
Title Page Abstract Introduction Conclusions References Tables Figures J I J I Back Close
Full Screen / Esc
Printer-friendly Version Interactive Discussion
EGU
Atmos. Chem. Phys. Discuss., 6, 9151–9185, 2006 www.atmos-chem-phys-discuss.net/6/9151/2006/ © Author(s) 2006. This work is licensed
under a Creative Commons License.
Atmospheric Chemistry and Physics Discussions
Modelling the direct e
ffect of aerosols in
the solar near-infrared on a planetary
scale
N. Hatzianastassiou1,2, C. Matsoukas2,3, A. Fotiadi2,4, E. Drakakis2,5,
P. W. Stackhouse Jr.6, P. Koepke7, K. G. Pavlakis2,8, D. Hatzidimitriou2,4, and I. Vardavas2,4
1
Laboratory of Meteorology, Department of Physics, University of Ioannina, 45110 Ioannina, Greece
2
Foundation for Research and Technology-Hellas, Heraklion, Crete, Greece
3
Department of Environment, University of the Aegean, Mytilene, Greece
4
Department of Physics, University of Crete, Crete, Greece
5
Department of Electrical Engineering, Technological Educational Institute of Crete, Crete, Greece
6
Atmospheric Sciences, NASA Langley Research Center, Hampton, Virginia, USA
7
Meteorological Institute, University of Munich, Munich, Germany
8
Department of General Applied Science, Technological Educational Institute of Crete, Greece Received: 24 July 2006 – Accepted: 3 September 2006 – Published: 25 September 2006 Correspondence to: N. Hatzianastassiou ([email protected])
ACPD
6, 9151–9185, 2006N. Hatzianastassiou et al.
Near infrared aerosol direct radiative forcing
Title Page Abstract Introduction Conclusions References Tables Figures J I J I Back Close
Full Screen / Esc
Printer-friendly Version Interactive Discussion
EGU Abstract
We used a spectral radiative transfer model to compute the direct radiative effect (DRE) of natural plus anthropogenic aerosols in the solar near-infrared (IR), between 0.85– 10 µm, namely, their effect on the outgoing near-IR radiation at the top of atmosphere (TOA,∆FTOA), on the atmospheric absorption of near-IR radiation (∆Fatmab) and on the
5
surface downward and absorbed near-IR radiation (∆Fsurf, and∆Fsurfnet, respectively). The computations were performed on a global scale (over land and ocean) under all-sky conditions, using spectral aerosol optical properties taken from the Global Aerosol Data Set (GADS) supplemented by realistic data for the rest of surface and atmo-spheric parameters. The computed aerosol DRE, averaged over the 12-year period
10
1984–1995 for January and July, shows that aerosols produce a planetary cooling by increasing the scattered near-IR radiation back to space (by up to 6 Wm−2), they warm the atmosphere (by up to 7 Wm−2) and cool the surface (by up to 12 Wm−2). However, they can also slightly warm the Earth-atmosphere system or cool the atmosphere (by less than 1 Wm−2) over limited areas. The magnitude of the near-IR aerosol DRE is
15
smaller than that of the combined ultraviolet (UV) and visible DRE, but it is still energet-ically important, since it contributes to the total shortwave (SW) DRE by 22–31%. On a global mean basis, the DREs∆FTOA,∆Fatmab,∆Fsurf, and∆Fsurfnetare equal to about 0.48, 0.37, −1.03 and −0.85 Wm−2, i.e. their magnitude is similar to that of climate forcing associated with increasing concentrations of greenhouse gases. The aerosol
20
induced near-IR surface cooling combined with the atmospheric warming, affects the thermal dynamics of the Earth-atmosphere system, by increasing the atmospheric sta-bility, decreasing thus cloud formation, and precipitation, especially over desertification threatened regions such as the Mediterranean basin. This, together with the fact that the sign of near-IR aerosol DRE is sometimes opposite to that of UV-visible DRE,
25
demonstrates the importance of performing detailed spectral computations to provide estimates of the climatic role of aerosols for the Earth-atmosphere system.
ACPD
6, 9151–9185, 2006N. Hatzianastassiou et al.
Near infrared aerosol direct radiative forcing
Title Page Abstract Introduction Conclusions References Tables Figures J I J I Back Close
Full Screen / Esc
Printer-friendly Version Interactive Discussion
EGU 1 Introduction
Amongst the different factors that can cause climate change, both aerosols and green-house gases play an important role. Well-mixed greengreen-house gases have produced a positive (warming) radiative forcing of about 2.4 Wm−2from pre-industrial times (IPCC, 2001). Tropospheric aerosols on the other hand, both natural and anthropogenic, act in
5
an opposite way through their direct radiative effect, by increasing the planetary albedo and cooling the surface. Aerosols may offset greenhouse-gas warming by about 25– 50% (Kaufman et al., 2002), but there is uncertainty regarding their overall radiative forcing (IPCC, 2001). Better estimates of the aerosol radiative effects on a planetary scale are required to reduce the uncertainties.
10
The main direct effect of aerosols is on the shortwave (SW) radiation, being much smaller in the longwave (thermal infrared) due to the rapid decrease of aerosol ex-tinction with increasing wavelength for most aerosol types. One way to compute the SW direct effect is to use multi-component global aerosol models or general circula-tion and climate models that are able to represent adequately the physical structure
15
of the Earth’s atmosphere with aerosols. These models require comprehensive global microphysical, micro-chemical, optical, and radiative aerosol properties. Despite the progress that has been made with these models (e.g. Jacobson, 2001; Liao et al., 2004; Reddy et al., 2005; Takemura et al., 2005), there is a wide range of discrepancy between the different model results (Remer and Kaufman, 2006) and difficulties to
re-20
produce correctly satellite observations (Bellouin et al. 2005). Another way is to use satellite observations to estimate aerosol radiative effects and forcings. This technique has become attractive lately, as modern instruments such as the MODerate resolu-tion Imaging Spectroradiometer (MODIS), the Multi-angle Imaging Spectro-Radiometer (MISR) or the Clouds and Radiant Energy System (CERES) were designed specifically
25
to observe aerosols and the Earth’s radiation budget. Such observational methods have been applied (e.g. Bellouin et al., 2005; Zhang et al., 2005) to estimate the com-bined direct radiative effect of both anthropogenic and natural aerosols. Yu et al. (2006)
ACPD
6, 9151–9185, 2006N. Hatzianastassiou et al.
Near infrared aerosol direct radiative forcing
Title Page Abstract Introduction Conclusions References Tables Figures J I J I Back Close
Full Screen / Esc
Printer-friendly Version Interactive Discussion
EGU
provides a thorough review of the radiative effect of aerosols from both satellite-based methods and global models. Although many problems related to satellite observations of aerosols have been resolved with the more sophisticated instruments, there are still problems as shown by discrepancies between different satellite products (Zhao et al., 2005). Another problem with the satellite-based method (e.g. Christopher and Zhang,
5
2002) is that it provides estimates of aerosol forcing only at the top of atmosphere (TOA), and not within the atmosphere and at the Earth’s surface, where the effect of aerosols is largest.
An important improvement in estimating aerosol radiative effects is a better spec-tral resolution in the models for radiation transfer, which usually include a few specspec-tral
10
bands in the whole SW range. This is critical, since the optical properties of aerosols vary within this spectral range, making thus their interaction with solar radiation very sensitive to wavelength. As shown by Hatzianastassiou et al. (2004b), it is very im-portant to perform detailed computations of aerosol forcing, using spectrally resolved aerosol properties, since inadequate treatment can result in modified aerosol forcings
15
at TOA, in the atmosphere and at surface by 1.4, 15.7 and 7.5%, respectively, on a global scale, and up to 100% locally (at geographical cell-level). In this study, we use a detailed spectral radiative transfer model along with spectral aerosol properties (and also surface and atmospheric parameters) to compute the direct radiative effect (DRE) of aerosols at near-infrared wavelengths. We have used a detailed spectral radiative
20
transfer model to match, as best possible, the detailed spectral resolution of aerosol optical properties from the Global Aerosol Data Set (GADS, Koepke et al., 1997). More specifically, the GADS aerosol properties are given at 29 wavelengths within 0.85 to 10.0 µm (see Sect. 3.1). Note that we use the term aerosol radiative effect rather than forcing, since we assess here the effect of both natural and anthropogenic aerosols,
25
while the term aerosol forcing is often used to express the radiative perturbation due to anthropogenic aerosols only. The aerosol DRE is computed at TOA, within the atmosphere and at the Earth’s surface, on planetary scale, under all-sky conditions. This is an extension of the study by Hatzianastassiou et al. (2004a) dealing with the
ACPD
6, 9151–9185, 2006N. Hatzianastassiou et al.
Near infrared aerosol direct radiative forcing
Title Page Abstract Introduction Conclusions References Tables Figures J I J I Back Close
Full Screen / Esc
Printer-friendly Version Interactive Discussion
EGU
aerosol direct effect in the ultraviolet and visible (UV-visible) wavelengths. Though the aerosol effect is larger in the UV-visible than in the solar near-IR (e.g. Valero et al., 2003; Nishizawa et al., 2004), it merits evaluation in the longer wavelengths, given that about 40% of solar radiation lies in this spectral range. Near-IR radiation is significantly affected by aerosols (Bush and Valero, 2003), especially in locations with elevated
con-5
centrations of coarse aerosol particles (sea-salt and desert-dust). We clarify that our study deals with only solar radiation in the near-IR range and not with the terrestrial radiation. Moreover, note that the contribution of solar radiation at wavelengths larger than 3.5 µm to the total solar energy is very small (<2%) so that virtually there is no overlap between solar and terrestrial radiation.
10
The methodology followed here is similar to that used by Hatzianastassiou et al. (2004a). The spectral aerosol data used (i.e. aerosol optical thickness, AOT, sin-gle scattering albedo, ωaer, and asymmetry parameter, gaer), which are essential to the spectral radiative transfer model computations, are taken from GADS. Ten aerosol com-ponents, representative of the atmosphere, are provided but we re-compute their
opti-15
cal properties to take into account the effects of relative humidity (see Hatzianastassiou et al., 2004a), based on actual climatological data from the Goddard Earth Observing System (GEOS) version 1 reanalysis product, provided by the Data Assimilation Of-fice (DAO) of NASA’s Goddard Space Flight Center (GSFC). The model aerosol DRE computations also include global distribution of surface albedo and clouds from
com-20
prehensive global climatological databases (NASA Langley Research Center dataset and ISCCP). The study is performed on a global scale, on a 1◦latitude-longitude reso-lution, for winter and summer conditions, for the 12-year period from 1984 to 1995.
In Sect. 2, we give a short description of the model and the methodology for mod-elling the aerosol radiative effects. The model input data are described and discussed
25
in Sect. 3, while in Sect. 4 are given the modelled aerosol DREs. In Sect. 5 we quantify and discuss an important aerosol effect on atmospheric thermal dynamics caused by their direct radiative effects. Finally, the contribution of near-IR to the total SW aerosol radiative effect is discussed in Sect. 6, before the conclusions (Sect. 7).
ACPD
6, 9151–9185, 2006N. Hatzianastassiou et al.
Near infrared aerosol direct radiative forcing
Title Page Abstract Introduction Conclusions References Tables Figures J I J I Back Close
Full Screen / Esc
Printer-friendly Version Interactive Discussion
EGU
2 The model
The deterministic spectral radiative transfer model used here was developed from a radiative-convective model (Vardavas and Carver, 1984). The solar irradiance is com-puted here for the spectral interval 0.85–10 µm, using the spectral profile of Thekaekara and Drummond (1971), normalized to 40.1% of the solar incoming radiation using a
so-5
lar constant So=1367 Wm−2(Hartmann, 1994; Willson, 1997) corrected for the Earth’s elliptical orbit. Of course, the definition for near-IR radiation usually also covers smaller wavelengths, i.e. from 0.75 or 0.8 µm, but we start in this study at 0.85 µm because the computations of aerosol radiative forcing are complementary to those given in the paper by Hatzianastassiou et al. (2004a) that have covered the spectral range 0.2–
10
0.85 µm. The incoming total solar flux at TOA for each 1-degree latitude-longitude cell, was computed as in Hatzianastassiou et al. (2004a), where it was used for the com-putations of the aerosol radiative effects in the UV-visible range 0.2–0.85 µm under clear sky conditions. Here, we will only provide a brief description of the model for the computations in the near-IR under all-sky conditions. The treatment of radiation
15
transfer for the near-IR wavelengths lying in the range 0.85–1.0 µm is the same as that used for the UV-visible range (see Hatzianastassiou et al., 2004a), whereas the treatment for the range 1.0–10 µm, divided into ten spectral intervals, will be presented here. For each wavelength and spectral interval, a set of monochromatic radiative flux transfer equations is solved for an absorbing/multiple-scattering atmosphere using the
20
Delta-Eddington method of Joseph et al. (1976) which is an extension of the Edding-ton method described in Shettle and Weinman (1970) with the standard parameters g (asymmetry factor), τ (extinction optical depth), and ω (single scattering albedo) re-placed by the following transformations
τ0= (1 − ωf ) τ (1)
25
ω0= (1 − f ) ω
ACPD
6, 9151–9185, 2006N. Hatzianastassiou et al.
Near infrared aerosol direct radiative forcing
Title Page Abstract Introduction Conclusions References Tables Figures J I J I Back Close
Full Screen / Esc
Printer-friendly Version Interactive Discussion
EGU
g0= g
1+ g (3)
with f=g2. For the clear-sky case (i.e. part of the geographical cell), we divide the atmosphere into two layers. The lowest begins at the surface and includes atmospheric gases and the aerosols, while the highest layer contains only the atmospheric gases above the aerosols. For the cloudy-sky case, the atmosphere is divided into four layers.
5
From the bottom to the top these are: (i) the aerosol layer, (ii) the layer between the aerosols and the cloud base, (iii) the cloud layer and (iv) the layer above the clouds up to the TOA. Note that aerosols above clouds are not considered in this study, due to missing information, which can introduce errors in the case of absorbing aerosols above clouds (Keil and Haywood, 2003). The situation will improve with the emerging
10
ground-based aerosol lidar network and launch of spaceborne lidars and radars (Yu et al., 2006). The radiatively active gases in the near-IR are water vapour (H2O), carbon dioxide (CO2), and methane (CH4), whereas clouds (low, middle, and high) and aerosols are considered as well. For each layer, the total optical depth is evaluated from the individual components at the specific layer
15
τ= τaers+ τaera+ τma+ τR + τcs+ τca (4)
where τaersis the scattering aerosol optical depth, τaerais the absorption aerosol optical depth, τma is that for molecular absorption, τR is that for Rayleigh scattering (τR= 0 in the near-IR) and τcs and τca are the cloud scattering and cloud absorption optical depths, respectively. The single scattering albedo for each layer is
20 ω= ωaer + ωR + ωc (5) where ωaer = τaers/τ, ωR = τR/τ, ωc= τcs/τ (6) while g= gaer· ωaer+ gR · ωR + gcωc ω (7) 25
ACPD
6, 9151–9185, 2006N. Hatzianastassiou et al.
Near infrared aerosol direct radiative forcing
Title Page Abstract Introduction Conclusions References Tables Figures J I J I Back Close
Full Screen / Esc
Printer-friendly Version Interactive Discussion
EGU
with gaer the aerosol asymmetry factor, gcthe asymmetry factor of the cloud and gR is the asymmetry factor for Rayleigh scattering set equal to 0.
For each spectral interval, b, and for each gas i , the mean transmission tb,i ,m is computed for each component m of a discrete probability distribution with coefficients pb,i ,mand absorption coefficients kb,i ,m(k-distribution or sumfits method) with the
nor-5
malization condition X
m
pb,i ,m= 1 (8)
and transmission for component m of gas species i given by
tb,i ,m= exp(−kb,i ,myi) (9) where yi is the absorber amount. If there is only species i which is radiatively active in
10
interval b, then the transmission for the interval is tb=X
m
pb,i ,mtb,i ,m (10)
However, if species i and j are active in interval b, the transfer equation is solved for all possible combinations of components m and n corresponding to the species i and j , respectively. If Fb is the spectral flux in interval b, then each component mn has
15
spectral flux pb,i ,mpb,j,nFb and optical depth kb,i ,myi+kb,j,nyj. The concept is further generalized to overlapping bands of more than two types of molecules (see Vardavas and Carver, 1984).
Reflection of incident solar radiation from the Earth’s surface is treated as explained by Hatzianastassiou et al. (2004a). The near-IR aerosol DRE (denoted henceforth as
20
∆F), or more precisely the “aerosol flux change”, is the effect of aerosols on the near-IR (or SW) radiation budget at TOA, at the Earth’s surface, or within the atmosphere, and it is given by
ACPD
6, 9151–9185, 2006N. Hatzianastassiou et al.
Near infrared aerosol direct radiative forcing
Title Page Abstract Introduction Conclusions References Tables Figures J I J I Back Close
Full Screen / Esc
Printer-friendly Version Interactive Discussion
EGU
where F and Fnoaerosol are the near-IR (or SW) radiative fluxes with and without aerosols, respectively. The DRE components ∆FTOA, ∆Fatmab, ∆Fsurf, and ∆Fsurfnet, represent the effect of aerosols on the outgoing radiation at TOA, the radiation ab-sorbed within the atmosphere, the downward radiation at the Earth’s surface, and the net downward (or absorbed) radiation at surface.
5
3 Aerosol properties and model input data
3.1 Aerosol data and properties
The required aerosol radiative properties, AOT, ωaer, and gaer, were taken from GADS (Koepke et al., 1997). The dataset GADS consists of aerosol particle properties aver-aged over space and time, and has been used in climate models (e.g. King et al., 1999;
10
Chin et al., 2002; Morcrette, 2002). A detailed discussion of GADS aerosol properties was given in the study by Hatzianastassiou et al. (2004a), where the same data were used to compute the UV-visible aerosol DRE. In GADS, the tropospheric aerosol par-ticles are described by 10 main aerosol components, which are representative for the atmosphere, resulting from aerosol emission, formation, and removal processes within
15
the atmosphere, so that they exist as mixture of different substances, both external and internal. Global distributions of GADS aerosol properties are given as climato-logically averaged values both for the periods December through February (northern hemisphere winter) and June through August (northern hemisphere summer) seasons on a 5◦ by 5◦latitude-longitude resolution. However, to match the spatial resolution of
20
the climatological parameters, especially that of relative humidity to which the aerosol properties are sensitive, the original GADS aerosol optical properties were up-scaled to 1◦×1◦latitude-longitude resolution, as explained in the next paragraph.
The GADS aerosol properties are provided for 8 values of relative humidity (0, 50, 70, 80, 90, 95, 98, and 99%). These properties originally taken from GADS, were
25
com-ACPD
6, 9151–9185, 2006N. Hatzianastassiou et al.
Near infrared aerosol direct radiative forcing
Title Page Abstract Introduction Conclusions References Tables Figures J I J I Back Close
Full Screen / Esc
Printer-friendly Version Interactive Discussion
EGU
pute realistically the aerosol radiative DREs. This was done in the way described by Hatzianastassiou et al. (2004a), but here for computed relative humidity values esti-mated from atmospheric temperature and specific humidity profiles (see 3.2).
The GADS aerosol properties are given at 29 wavelengths within 0.85 to 10 µm. These are: 0.9, 1.0, 1.25, 1.5, 1.75, 2.0, 2.5, 3.0, 3.2, 3.39, 3.5, 3.75, 4.0, 4.5, 5.0, 5.5,
5
6.0, 6.2, 6.5, 7.2, 7.9, 8.2, 8.5, 8.7, 9.0, 9.2, 9.5, 9.8 and 10.0 µm. The spectral model computations are performed for specific wavelengths and spectral intervals in the near-IR. Thus, the model required AOT, ωaer, and gaer for these wavelengths and intervals were obtained through interpolation and extrapolation, when necessary. Finally, the near-IR radiative fluxes at TOA, within the atmosphere, and at the Earth’s surface,
10
were computed for each wavelength and spectral interval, with and without aerosols, which were then summed to yield the near-IR radiative fluxes, and from their difference the radiative effects (Eq. 11).
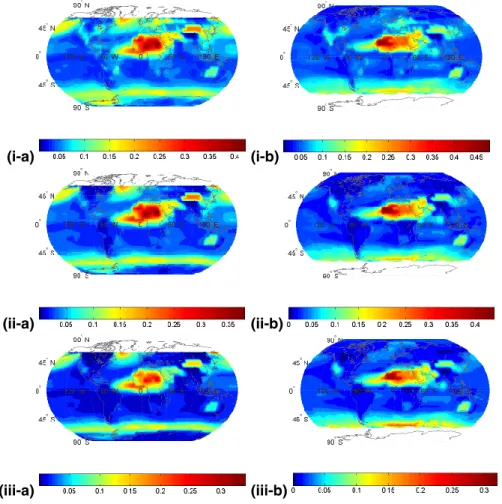
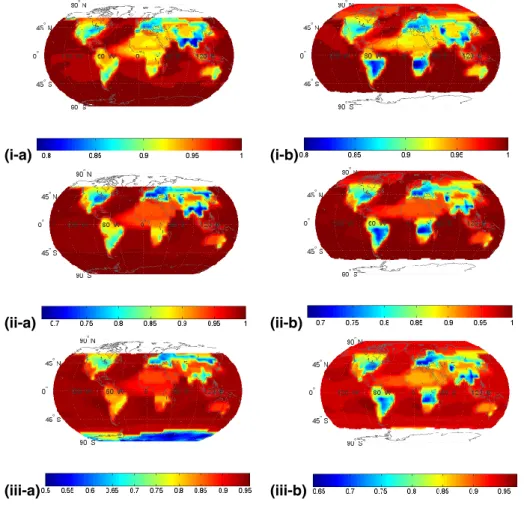
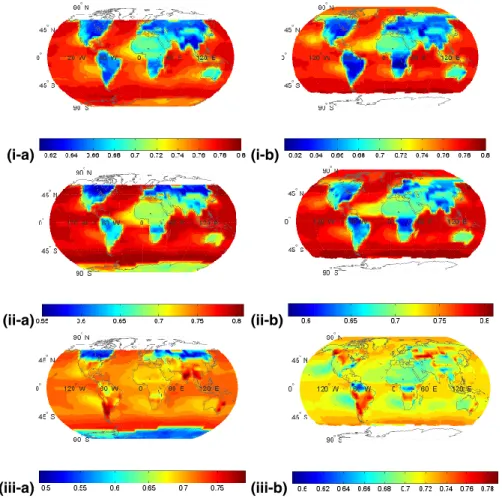
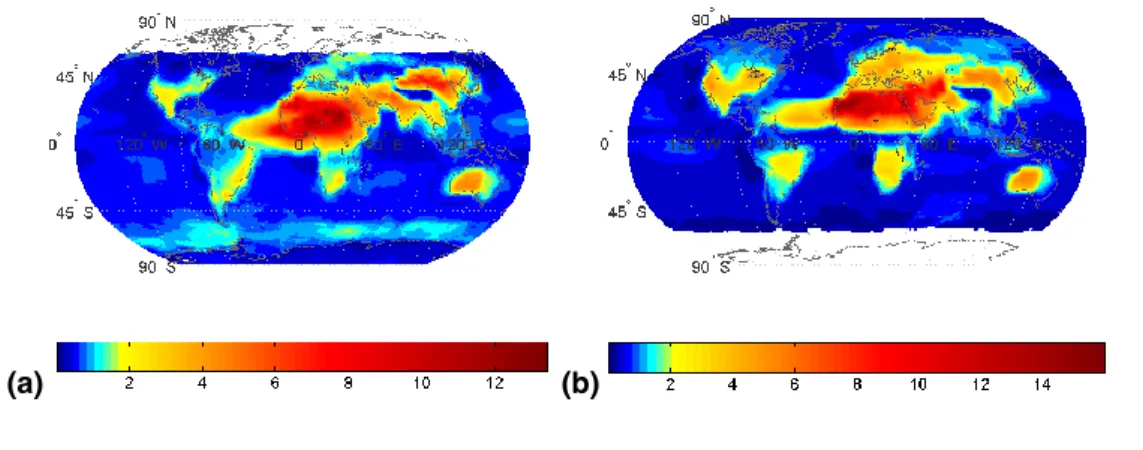
As examples, the global distribution of GADS-derived aerosol optical properties are given in Figs. 1, 2 and 3, for the wavelengths 0.9 µm, 1.75 µm and 3.5 µm, respectively,
15
computed for the ambient aerosol layer humidity, for northern hemisphere winter (Jan-uary) and summer (July) conditions. It can be seen that AOT values (Fig. 1) decrease with increasing wavelength, especially over highly populated and industrialized areas (e.g. Europe, North and South America, South and South-East Asia) with fine particles. In contrast, areas with coarse particles such as North Africa, Arabian and Gobi deserts
20
or the windy zone (around 60◦S) of the southern hemisphere, maintain relatively high AOT values for near-IR wavelengths, because of the large sizes of dust and sea-salt particles. In those areas, AOT values are up to 0.47 at 0.9 µm and 0.32 at 3.5 µm, whereas they are smaller than 0.1 at all wavelengths for the rest of globe. The single scattering albedo values (Fig. 2) range from 0.5 to 1 in the near-IR range. Large values
25
of ωaer are found over oceanic areas with sulphate and sea-salt particles, decreasing to about 0.65 over continental areas with water soluble, water insoluble and soot com-ponents (e.g. Europe, North and South America, South and South-East Asia). It is interesting that over desert areas, but also over oceanic regions characterized by dust
ACPD
6, 9151–9185, 2006N. Hatzianastassiou et al.
Near infrared aerosol direct radiative forcing
Title Page Abstract Introduction Conclusions References Tables Figures J I J I Back Close
Full Screen / Esc
Printer-friendly Version Interactive Discussion
EGU
transport (such as tropical Atlantic, and western Pacific off the Asian coast), the ωaer values are larger in the near-IR than in the UV-visible wavelengths. For example, over North Africa in July, ωaeris equal to 0.93 at 0.9 µm and 0.87 at 3.5 µm (Fig. 2), against 0.65 at 0.25 µm (see Fig. 2 of Hatzianastassiou et al., 2004a). This is explained by the decreasing imaginary refractive index of mineral components from the UV through to
5
about 1.0 µm, before increasing again at larger wavelengths. Note also the drastic drop of ωaer over Antarctica in January, due to the composition of Antarctic aerosols from sulphate solution (Koepke et al., 1997). The aerosol asymmetry parameter (Fig. 3) has values in the near-IR varying between 0.5 and 0.81, i.e. lower than corresponding values in the UV-visible (0.6–0.85, Hatzianastassiou et al., 2004a). More forward
scat-10
tering from aerosols is indicated by larger oceanic than continental gaervalues. In spite of the general decrease of gaer with increasing wavelength, for the case of a high con-tribution of water insoluble and soluble components in the aerosol particles (e.g. South America, eastern USA, Europe, South and South-East Asia in January), there is an increase in gaer from 0.9 to 3.5 µm.
15
3.2 Other data
The molecules considered in this study relevant to the near-IR range of wavelengths were: H2O, CO2 and CH4. Their absorption was treated as explained in the previous Sect. (2). The Rayleigh scattering due to atmospheric molecules, which is important only for wavelengths up to 1 µm, is considered in the model in the way described by
Var-20
davas and Carver (1984) and Hatzianastassiou et al. (2004a). The total atmospheric amounts for atmospheric molecules were partially distributed into each atmospheric layer according to its physical thickness as part of the total atmospheric column height. The water vapour and temperature data were based on the GEOS-1 reanalysis prod-uct (6-hourly), averaged to a daily temporal resolution. Atmospheric temperature and
25
humidity profiles for the years 1984 through to 1995 were used to compute the mean relative humidity of the aerosol layer. Cloud data on a 1◦×1◦resolution were taken from the NASA-Langley data set based on GEWEX ISCCP DX cloud climatologies. The
ACPD
6, 9151–9185, 2006N. Hatzianastassiou et al.
Near infrared aerosol direct radiative forcing
Title Page Abstract Introduction Conclusions References Tables Figures J I J I Back Close
Full Screen / Esc
Printer-friendly Version Interactive Discussion
EGU
mean daily 1◦×1◦NASA-Langley cloud data were compiled by processing the 3-hourly ISCCP-DX pixel-level data, which contain radiance and cloud retrieval information from geosynchronous and polar orbiting satellites sampled to a nominal resolution of 30 km. All 30 km DX pixels within a grid cell are averaged analogously to the methods of IS-CCP (e.g. Rossow et al., 1996) to produce gridded radiance and cloud products. The
5
NASA Langley 1◦×1◦ cloud data include: cloud amount, cloud-top pressure, cloud-top temperature, liquid water path, and optical depth for total clouds. They also provide cloud amount and cloud-top temperature for low-, mid-, and high-level clouds, as well as cloud amount, cloud-top temperature, cloud optical depth, and cloud albedo sepa-rately for ice and liquid water phase clouds.
10
The surface reflection is computed as in Vardavas and Koutoulaki (1995), Hatzianas-tassiou et al. (2004a) and HatzianasHatzianas-tassiou et al. (2005), by using surface-type cover fractions on a mean daily and 1-degree geographical cell resolution for the years 1984– 1995. Ice/snow cover data were taken from ISCCP, while surface type classification maps were obtained from other high resolution data sets (Stackhouse et al., 2002).
15
A complete topography scheme is included in the model, which uses the NASA DAO GEOS-1 surface pressure, gridded on 1◦ by 1◦ cells. Consideration of topography is important for regions well above sea-level, for the correct computation of the mean aerosol layer humidity, but also for the correct computation of total atmospheric amount of each gas for the actual extent of the atmospheric column for a given geographical
20
cell on the globe.
4 Model computations of near-infared aerosol radiative effects
The spectral model computations were performed using the spectral (see 3.1) GADS aerosol properties. The near-IR radiative fluxes at TOA, within the atmosphere, and at the Earth’s surface, were computed for each wavelength and spectral interval, with and
25
without aerosols, which were then summed to yield the near-IR radiative fluxes, and from their difference the radiative effects (Eq. 11). The computed total near-IR mean
ACPD
6, 9151–9185, 2006N. Hatzianastassiou et al.
Near infrared aerosol direct radiative forcing
Title Page Abstract Introduction Conclusions References Tables Figures J I J I Back Close
Full Screen / Esc
Printer-friendly Version Interactive Discussion
EGU
monthly (winter and summer) aerosol DREs for each cell (1◦ longitude-latitude) are given in terms of outgoing radiation at TOA (∆FTOA), atmospheric absorption (∆Fatmab) and net downward or absorbed radiation at the surface (∆Fsurfnet) in Wm−2.
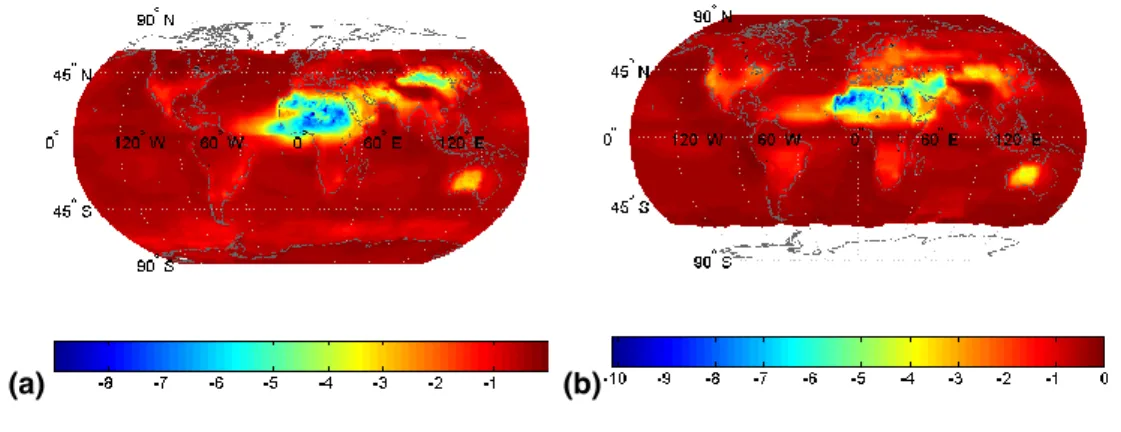
4.1 Aerosol direct radiative effect at the top of atmosphere (∆FTOA)
The change of outgoing near-IR radiation at TOA due to aerosols (aerosol direct
radia-5
tive effect ∆FTOA) under all-sky conditions is given in Fig. 4. According to Eq. (11), pos-itive values indicate increased outgoing near-IR radiation, i.e. near-IR radiative cooling of the Earth-atmosphere system, while negative values indicate planetary warming. In general, aerosols increase, through reflection, the outgoing near-IR radiation at TOA, by up to 6 Wm−2 on a mean monthly basis, producing thus planetary cooling. Over
10
most of the globe, the change in near-IR radiation is smaller than 1–2 Wm−2. The large values of∆FTOAoccur over continental desert areas (e.g. Sahara, Arabian penin-sula, Gobi, Australia), over oceanic areas with strong dust transport above (e.g. tropical Atlantic Ocean) and over remote oceanic areas with intense production of sea-spray (storm-track zone of the Southern Hemispere). In spite of the general near-IR
plan-15
etary cooling, aerosols can produce a warming of the Earth-atmosphere system by decreasing the outgoing near-IR radiation at TOA, by up to 1 Wm−2. This occurs over Greenland in July and over limited areas (e.g. Sahara) with large surface albedo and significant loads of absorbing aerosols. In general, under all-sky conditions, the ef-fect of aerosols on the outgoing near-IR radiation at TOA is smaller than their effect on
20
the UV-visible wavelengths (values ranging from −9 to 8.5 Wm−2, not shown here). The magnitude of∆FTOAfor a specific place on the globe is determined by AOT, cloud cover and surface albedo, apart from the incoming solar flux. Thus, large values appear in regions with small cloudiness, e.g. sub-Sahel, Gobi and Australian deserts in January. In July, large positive values (up to 5–6 Wm−2) exist over limited maritime areas such as
25
the southern part of the eastern Mediterranean basin and the Red Sea, and secondar-ily over continental areas such as Australia. Negative values (up to −1 Wm−2) appear over Sahelian and Sahara regions with large AOT, small cloudiness and large (0.3–0.4)
ACPD
6, 9151–9185, 2006N. Hatzianastassiou et al.
Near infrared aerosol direct radiative forcing
Title Page Abstract Introduction Conclusions References Tables Figures J I J I Back Close
Full Screen / Esc
Printer-friendly Version Interactive Discussion
EGU
surface albedo. The role of surface albedo is very important in determining the sign of∆FTOA. For example, note that in Sahel and Sahara, over limited continental areas with smaller surface albedo (0.2 to 0.3) or over maritime areas with low surface albedo (<0.1), adjacent to areas with∆FTOA<0, the values of∆FTOA either decrease in mag-nitude (but negative) or change to positive, as in the case of tropical Atlantic with dust
5
transport, where∆FTOA=1–2 Wm−2. Another case of negative near-IR DRE at TOA is in Greenland, where∆FT OA∼=−0.2 Wm−2in July; negative DRE appears there despite the small aerosol load (AOT<0.1) because of large surface albedo. Note also the rel-atively large values of∆FTOA (∼=1 Wm−2) along the storm-track zone of the Southern Hemisphere in January, due to the aerosol optical thickness values of ∼=0.1–0.2 and
10
relatively low surface albedo (<0.15–0.2). In contrast,∆FTOA is very small in July de-spite the significant AOT values (similar to those of January), because of the increased surface albedo (0.3–0.35) due to increased Fresnel reflection (and solar zenith angle) under cloud-free conditions (under which the the aerosol radiative forcing is important) accounted for in the model (see Hatzianastassiou et al., 2004a), as well as the small
15
amount of incoming solar radiation at that time.
4.2 Aerosol direct radiative effect in the atmosphere (∆Fatmab)
Aerosols are found to increase the near-IR atmospheric absorption (Fig. 5), by as much as 7 Wm−2, over areas characterized by significant amounts of absorbing aerosols (such as mineral-dust or soot), especially over highly reflecting surfaces (surface
20
albedo>0.3). Aerosol DRE values up to 2–3 Wm−2 are also found over Europe, USA, South America, South Africa, South and South-East Asia and Australia. The large values of ∆Fatmab are either associated with large mass concentrations of absorbing mineral aerosol components or with significant (but smaller) concentrations of strongly absorbing soot or water soluble and insoluble components. The near-IR aerosol DREs
25
are found to be smaller, by factor of about 0.3, compared to the corresponding UV-visible aerosol DREs, but need to be accounted for in climate studies. In January, the large values of ∆Fatmab in sub-Sahel (5◦–10◦N) and across the tropical Atlantic
ACPD
6, 9151–9185, 2006N. Hatzianastassiou et al.
Near infrared aerosol direct radiative forcing
Title Page Abstract Introduction Conclusions References Tables Figures J I J I Back Close
Full Screen / Esc
Printer-friendly Version Interactive Discussion
EGU
are attributed to the long-range transport of desert dust in higher atmospheric lev-els (up to 4.5 km, Formenti et al., 2003) by the “harmattan” trade winds during the dry season. The transport of mineral dust across the Atlantic ocean, as indicated by large values of∆Fatmab, is shifted northwards in July due to the changed atmospheric circulation (Azores anticyclone and thermal low of Pakistan). Note that slightly
nega-5
tive∆Fatmab values are found over limited areas, such as the Antarctica, especially its western part (along the coast of Marie Byrd Land), and the northernmost parts of the Atlantic and Pacific oceans in January, as well as along the windy oceanic zone of the Southern Hemisphere in July, i.e. over areas with significant loads of highly scattering aerosols. In these cases, the atmospheric layer including scattering aerosols
(water-10
soluble or sea-salt) is high enough and absorbs less near-IR radiation than it would do without these particles. Such behavior does not occur in the UV-visible wavelengths (Hatzianastassiou et al., 2004a).
4.3 Aerosol direct radiative effect at surface (∆Fsurfnet)
Our model results (Fig. 6) indicate that aerosols decrease regionally the surface
down-15
ward (not shown here since the results are very similar to those for the absorbed com-ponent) and the absorbed near-IR radiation at the Earth’s surface by up to 12 and 10 Wm−2, respectively, producing thus an important surface radiative cooling. The largest decreases in surface near-IR radiation are found over areas with significant aerosol amounts (AOT). Thus, over desert areas during summer the surface
absorp-20
tion of near-IR radiation is decreased by up to 10 Wm−2 due to the scattering and absorption of aerosols. In the rest of the continental areas, aerosols produce a radia-tive near-IR cooling of the surface up to 2–3 Wm−2. According to our model compu-tations, the aerosol effect on near-IR radiation at the surface is larger, by up to 3–4 times, than at TOA at geographical cell level, i.e. the ratio∆Fsurfnet/∆FTOAtakes slightly
25
larger values in the near-IR than in the UV-visible range for which the ratio is about 3 (Hatzianastassiou et al., 2004a). Lelieveld et al. (2002) have reported a factor of 2.7 from aerosol radiative forcing computations based on measurements of the
Mediter-ACPD
6, 9151–9185, 2006N. Hatzianastassiou et al.
Near infrared aerosol direct radiative forcing
Title Page Abstract Introduction Conclusions References Tables Figures J I J I Back Close
Full Screen / Esc
Printer-friendly Version Interactive Discussion
EGU
ranean Intensive Oxidation Study, performed in summer 2001 in Crete (Greece). In general, the near-IR aerosol DRE values at the surface are smaller in magnitude than the corresponding UV-visible by 2–3 times. However, the ratio of UV-visible/near-IR aerosol DRE at surface is even larger, i.e. by up to about 5 times, over regions with fine particles, such as the industrialized/urban regions of the North Hemisphere (Europe,
5
USA, South and South-East Asia). This is further discussed in Sect. 5.
4.4 Global and hemispherical averages of aerosol direct radiative effects
The global and hemispherical averages of near-IR aerosol DREs were estimated, by including surface area weighting in the computations, and the results are given in Ta-ble 1. The largest effect of aerosols on near-IR radiation is found at the surface, where
10
the downward and absorbed fluxes are decreased by about 1.0 and 0.85 Wm−2, re-spectively, on global scale. In the atmosphere, the presence of aerosol particles in-creases the absorption of near-IR radiation by about 0.4 Wm−2, whereas the globally averaged reflected near-IR flux to space is found to increase by about 0.5 Wm−2. Over-all, the presence of aerosols results in a stronger surface near-IR radiative cooling,
15
which in combination with atmospheric warming, produces near-IR planetary cooling. These near-IR DREs are in qualitative agreement with the corresponding effects at UV-visible wavelengths (Hatzianastassiou et al., 2004a). Although smaller in mag-nitude (Sect. 4.6), they are very important, since their magmag-nitude is comparable to that of climate forcing induced by elevated concentrations of greenhouse gases (about
20
2.4 Wm−2, IPCC, 2001).
The near-IR DRE values are generally larger in the more polluted northern hemisphere than in the southern, by factors ranging from 1.2 to 6 depending on the DRE component and month. The largest inter-hemispherical differences oc-cur for the aerosol effect on atmospheric absorption of near-IR flux, with the ratio
25
∆Fatmab(North)/∆Fatmab(South) equal to 3 and 6 in January and July, respectively.
In general, there are small differences between the magnitude of aerosol DRE val-ues in January and July, as also reported by Koepke et al. (1997). Nevertheless,
ACPD
6, 9151–9185, 2006N. Hatzianastassiou et al.
Near infrared aerosol direct radiative forcing
Title Page Abstract Introduction Conclusions References Tables Figures J I J I Back Close
Full Screen / Esc
Printer-friendly Version Interactive Discussion
EGU
large seasonal differences (between January and July) are found with respect to the inter-hemispherical contrast in DRE magnitude. For example, the much larger ratio, ∆Fatmab(North)/∆Fatmab(South), in July (6.1) than in January (3.1) arises from the
sea-sonal cycles of mineral dust and biomass burning in the two hemispheres.
5 Aerosol radiative effect on atmospheric thermal dynamics
5
As shown in Sects. 4.2 and 4.3, aerosols cool the Earth’s surface by scattering to space and through atmospheric absorption. Therefore, the presence of aerosols has a sig-nificant effect on the thermal dynamics of the Earth-atmosphere system. By cooling the surface and warming the atmosphere, aerosols act to produce more stable atmo-spheric conditions by decreasing convective activity. They also reduce evaporation
10
from the surface, and so can have a significant effect on the hydrological cycle by sup-pressing cloud formation (especially the convective) and associated precipitation. This aerosol redistribution of near-IR radiative energy between the Earth’s surface and the atmosphere, was also found for the UV-visible (Hatzianastassiou et al., 2004a). This highlights the role of modifying atmospheric particulate matter (amount and
composi-15
tion) on climate, especially in climatically sensitive regions such as the desertification threatened Mediterranean basin. We quantify the magnitude of this aerosol effect on thermal dynamics (AETD) by the difference
AETD= ∆Fatmab−∆Fsurfnet (12)
given in Fig. 7.
20
The magnitude of AETD can be up to 13 and 16 Wm−2 for January and July, re-spectively, with a magnitude up to 5 and 2 Wm−2 over most continental and oceanic areas, respectively. It is interesting to note that the largest effect of aerosols on ther-mal dynamics occurs over deserts and nearby desertification threatened regions. Of course, this aerosol radiative effect is further amplified when the corresponding effect
25
ACPD
6, 9151–9185, 2006N. Hatzianastassiou et al.
Near infrared aerosol direct radiative forcing
Title Page Abstract Introduction Conclusions References Tables Figures J I J I Back Close
Full Screen / Esc
Printer-friendly Version Interactive Discussion
EGU 6 Contribution of near-infared to total shortwave aerosol direct radiative effect
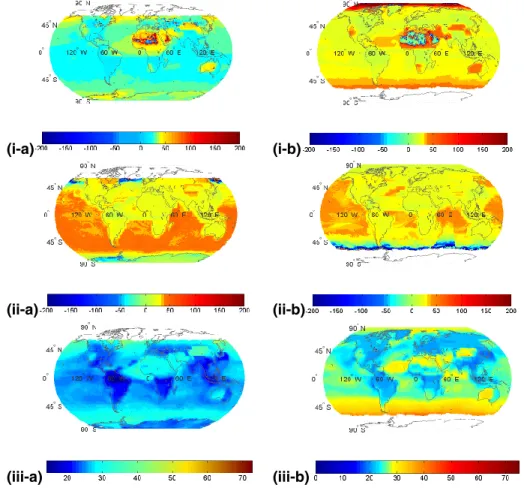
In order to quantify the relative contribution of near-IR to the total SW aerosol direct radiative effect, the percentage of total DRE due to the near-IR was computed for the three components (at TOA, in the atmosphere and at surface), for January and July, and the results are given in Fig. 8. As for∆FTOA, over most regions, the near-IR DRE
5
contribution to the total SW DRE is 25–30%. Nevertheless, over extended desert areas (e.g. Sahara, Arabian, Australian, Gobi) the contribution rises to about 50%, and over limited areas it even exceeds the magnitude of the total SW DRE (values up to 200% or even larger). At first sight this may seem strange but it can be explained by the different sign of aerosol DRE at TOA (∆FTOA) for the near-IR and the UV-visible. The sum of
10
the components is smaller than the components. This also explains the existence of negative values in Fig. 8, over limited regions. The changing sign of∆FTOA between the UV-visible and near-IR wavelengths is attributed to: (i) the decrease in AOT towards the near-IR; (ii) the decrease in surface albedo over snow (e.g. Roesch et al., 2002), sea-ice (e.g. Allison, 1993) or land-ice (e.g. Hansen et al., 1983; Roesch et al., 2002)
15
with increasing wavelength; (iii) the increase of ωaer, e.g. from values of about 0.65 at 0.25 µm to 0.88 at 3.5 µm over the Sahara in July; and (iv) the decrease of gaer, e.g. from values of about 0.82 at 0.25 µm to 0.67 at 3.5 µm over the Sahara in July. The combination of all the above results in a near-IR∆FTOAwith opposite sign to that of the UV-visible∆FTOA over areas such as the Sahara and the Arctic in July. Consequently,
20
careful consideration of the spectral dependence of aerosol DRE at TOA is required to avoid erroneous conclusions regarding the role of aerosols for the Earth’s climate (planetary warming instead of cooling and vice versa).
The contribution of near-IR to total SW DRE in the atmosphere (∆Fatmab) gener-ally varies between 25 and 50% (Fig. 8ii). However, there are extended oceanic
ar-25
eas (e.g. Pacific, South Altantic, Indian ocean) with values up to 70%. This is due to the comparatively stronger absorption of near-IR than UV-visible radiation by sea-salt aerosols (remote – pure oceanic) because of the increasing imaginary part of refractive
ACPD
6, 9151–9185, 2006N. Hatzianastassiou et al.
Near infrared aerosol direct radiative forcing
Title Page Abstract Introduction Conclusions References Tables Figures J I J I Back Close
Full Screen / Esc
Printer-friendly Version Interactive Discussion
EGU
index towards near-IR wavelengths (Koepke et al., 1997), opposite to aerosol popula-tions with anthropogenic components. Note that over specific regions (e.g. western part of Antarctica, middle-to-polar oceanic regions of the northern hemisphere) there are negative values, i.e. the atmosphere over those areas absorbs less near-IR radia-tion than it would do without aerosols included. This can occur when an aerosol layer,
5
with a critical particle concentration, extends high up in the atmosphere, preventing thus penetration and absorption of radiation in the lower atmosphere.
The contribution of near-IR aerosol DRE at the surface to the total SW DRE, has in general values varying within the range 20–30%. Only over limited regions this con-tribution can be larger (up to about 50%). Note that concon-tributions of near-IR to total
10
SW aerosol DRE at surface as large as 45% have been reported from measurements during the INDOEX and ACE-Asia experiments on the local spatial scale and diurnal resolution, for a spectral coverage starting at 0.68 µm instead of 0.85 µm in our study. Nishizawa et al. (2004), from 2-year measurements in Japan, reported that the UV-visible aerosol forcing at the surface is almost 4 times larger than in near-IR, in
agree-15
ment with our results. According to our study, on a global scale, the stronger radiative effect of aerosols on surface solar radiation lies in the UV-visible wavelengths, being larger than in the near-IR by a factor of 2.5 to 4. The fraction of total SW aerosol DRE contributed by the near-IR is somewhat smaller than the corresponding fraction of the total SW flux contributed by the near-IR (about 40%), indicating thus a non-linear
rela-20
tionship between the solar radiative flux and the corresponding aerosol direct radiative effect (DRE).
On mean global basis, the near-IR aerosol DRE components (at TOA, in the atmo-sphere, and at surface) are found to contribute to the corresponding total solar DRE, by a percentage varying within the range 22–30%, depending on the DRE component and
25
the season (Fig. 9). The near-IR contribution for DRE at TOA (∆FTOA) is about 30%, for the atmospheric DRE (∆Fatmab) it is about 22%, whereas for the surface DRE (∆Fsurfnet) it is about 27%. Overall, the largest contribution of near-IR to total SW aerosol DRE is found for∆FTOA, and the smallest for∆Fatmab. The contribution is larger in January
ACPD
6, 9151–9185, 2006N. Hatzianastassiou et al.
Near infrared aerosol direct radiative forcing
Title Page Abstract Introduction Conclusions References Tables Figures J I J I Back Close
Full Screen / Esc
Printer-friendly Version Interactive Discussion
EGU
than in July, for all DREs.
7 Conclusions
We used a detailed spectral radiative transfer model together with spectral aerosol op-tical properties to compute the direct radiative effect (DRE) of aerosols on the near-IR (λ≥0.85 µm) radiation budget. We estimated the effect of natural plus anthropogenic
5
aerosols on the outgoing near-IR radiation at the top of atmosphere, on atmospheric absorption, and on the downward and absorbed near-IR radiation at the Earth’s sur-face. The model computations were performed under all-sky conditions, using real-istic data for all surface and atmospheric parameters, for the 12 years 1984–1995. The aerosol data (optical thickness, single scattering albedo and asymmetry
param-10
eter) were taken from the Global Aerosol Data Set (GADS) and were subsequently re-computed for realistic relative humidity values of the aerosol layer. The results are given for January and July at 1◦ latitude-longitude resolution, but also averaged for the two hemispheres and for the globe.
It is found that in general, aerosols cool the Earth-atmosphere system, through
scat-15
tering of near-IR radiation back to space, by up to 6 Wm−2. The largest near-IR cool-ing effect takes place over desert areas such as Sahara, as well as over oceanic re-gions with dust transport (e.g. tropical Atlantic). Beyond the general planetary cooling, aerosols are also found to produce warming (by up to 1 Wm−2) over Greenland in July and over limited areas in the Sahara. According to our results, the aerosol particles
20
warm the atmosphere, except for some rare cases, by absorbing near-IR radiation (by up to 7 Wm−2). The largest aerosol-induced near-IR atmospheric warming occurs above areas characterized by strongly absorbing mineral dust particles, especially over highly reflecting deserts. Over some regions, such as the western Antarctic or the windy zone of the southern hemisphere, aerosols are found to slightly decrease
atmo-25
spheric absorption of near-IR radiation (atmospheric cooling). The strongest effect of aerosols is found at the surface, where the downward and absorbed near-IR radiation
ACPD
6, 9151–9185, 2006N. Hatzianastassiou et al.
Near infrared aerosol direct radiative forcing
Title Page Abstract Introduction Conclusions References Tables Figures J I J I Back Close
Full Screen / Esc
Printer-friendly Version Interactive Discussion
EGU
is decreased by up to 12 and 10 Wm−2, respectively, due to aerosol scattering and absorption. The near-IR aerosol DRE at the surface is larger than at TOA by a factor of 3 to 4, which indicates the important role of aerosols for surface processes and the surface radiation budget.
On a mean global basis, aerosols are found to increase the outgoing near-IR
radi-5
ation at TOA (planetary cooling) by about 0.5 Wm−2, and to radiatively heat the atmo-sphere (atmospheric heating) by increasing the absorption of near-IR radiation roughly by 0.4 Wm−2. As a result, the absorbed near-IR radiation by the Earth’s surface is found to be decreased (surface cooling) by 0.9 Wm−2, due to aerosols.
The aerosol induced surface near-IR cooling combined with an associated
atmo-10
spheric warming, produces a significant aerosol effect on the thermal dynamics (AETD) of the Earth-atmosphere system. This radiative effect was quantified by the difference AETD=∆Fatmab−∆Fsurfnet, and found to be up to 13 and 16 Wm−2for January and July, respectively, being largest over deserts and surrounding semi-arid regions. Aerosol induced changes in the near-IR energy distribution between the Earth’s surface and
15
the atmosphere is important for atmospheric dynamics, since it can create more sta-ble atmospheric conditions and lower surface evaporation, resulting in less clouds and precipitation, thus enhancing desertification processes, especially in semi-arid regions such as the Mediterranean basin.
Our modelling study indicates that the near-IR aerosol DRE is generally smaller in
20
magnitude than the corresponding DRE in the UV-visible, and contributes to the total SW aerosol DRE by about 30%. This contribution is largest for the TOA DRE, and smallest for the atmospheric DRE. Moreover, on a regional basis, the near-IR DRE can be larger than the UV-visible, whereas over specific regions (Sahara, Arctic in July) it can even have opposite sign. This indicates that it is very important to perform detailed
25
spectral computations of aerosol radiative effects (and forcings), including the near-IR range, in order to asses the climatic role of aerosols.
Acknowledgements. This research was co-funded by the European Social Fund & National
ob-ACPD
6, 9151–9185, 2006N. Hatzianastassiou et al.
Near infrared aerosol direct radiative forcing
Title Page Abstract Introduction Conclusions References Tables Figures J I J I Back Close
Full Screen / Esc
Printer-friendly Version Interactive Discussion
EGU
tained from the NASA Langley Research Center (LaRC) Atmospheric Sciences Data Cen-ter (ASDC). The GADS aerosol data were obtained from the Meteorological Institute of the University of Munich, Germany (http://www.meteo.physik.uni-muenchen.de/strahlung/aerosol/ aerosol.htm).
References
5
Allison, I.: East Antarctic sea ice: Albedo, thickness distribution, and snow cover, J. Geophys. Res., 98, 12 417–12 429, 1993.
Bellouin, N., Boucher, O., Haywood, J., and Reddy, M. S.: Global estimate of aerosol direct radiative forcing from satellite measurements, Nature, 438, 1138–1141, 2005.
Bush, B. C. and Valero, F. P. J.: Surface aerosol radative forcing at GOSAN during the ACE-Asia
10
campaign, J. Geophys. Res., 108, D23, 8660, doi:10.1029/2002JD003233, 2003.
Chin, M., Ginoux, P., Kinne, S., Torres, O., Holben, B. N., Duncan, B. N., Martin, R. V., Logan, J. A., Higurashi, A., and Nakajima, T.: Tropospheric aerosol optical thickness from the GO-CART model and comparisons with satellite and Sun photometer measurements, J. Atmos. Sci., 59, 461–483, 2002.
15
Christopher, S. A. and Zhang, J.: Shortwave aerosol radiative forcing from MODIS and CERES observations over the oceans, Geophys. Res. Lett., 29, 1859, doi:10.1029/2002GL014803, 2002.
Formenti P., Elbert, W., Maenhaut, W., Haywood, J., Andreae, M. O.: Chemical composi-tion of mineral dust aerosol during the Saharan Dust Experiment (SHADE) airborne
cam-20
paign in the Cape Verde region, September 2000, J. Geophys. Res., 108 (D18), 8576, doi:10.1029/2002JD002648, 2003.
Hansen, J., Russell, G., Rind, D., Stone, P., Lacis, A., Lebedeff, S., Ruedy, R., and Travis, L.: Efficient three-dimensional global models for climate: Models I and II, Mon. Weather. Rev., 111, 609–662, 1983.
25
Hartmann, D. L.: Global Physical Climatology, Academic Press, 411 pp, 1994.
Hatzianastassiou, N., Katsoulis, B., and Vardavas, I.: Global distribution of aerosol direct radia-tive forcing in the ultraviolet and visible arising under clear skies, Tellus, 56B, 51–71, 2004a. Hatzianastassiou, N., Katsoulis, B., and Vardavas, I.: Sensitivity analysis of aerosol direct
ra-ACPD
6, 9151–9185, 2006N. Hatzianastassiou et al.
Near infrared aerosol direct radiative forcing
Title Page Abstract Introduction Conclusions References Tables Figures J I J I Back Close
Full Screen / Esc
Printer-friendly Version Interactive Discussion
EGU
diative forcings in the ultraviolet - visible wavelengths and consequences for the heat budget, Tellus, 56B, 368–381, 2004b.
Hatzianastassiou, N., Fotiadi, A., Matsoukas, C., Drakakis, E., Pavlakis, K. G., Hatzidimitriou, D., and Vardavas, I.: A 17-year global distribution of Earth’s surface shortwave radiation budget, Atmos. Chem. Phys., 5, 2847–2867, 2005.
5
Intergovernmental Panel on Climate Change (IPCC): Climate Change 2001, The Scientific Ba-sis, 881 pp., edited by: Houghton J. T., Ding, Y., Griggs, D. J., et al., Cambridge Univ. Press, New York, 2001.
Jacobson, M. Z.: Global direct radiative forcing due to multicomponent anthropogenic and natural aerosols, J. Geophys. Res., 106, 1551–1568, 2001.
10
Joseph, J. H., Wiscombe, W. J., and Weinmann, J. A.: The Delta-Eddington approximation of radiative flux transfer, J. Atmos. Sci., 33, 2452–2459, 1976.
Kaufmann, Y. J., Tanr ´e, D., and Boucher, O.: A satellite view of aerosols in the climate system, Nature, 419, 215–223, 2002.
Keil, A. and Haywood, J.: Solar radiative forcing by biomass burning aerosol particles during
15
SAFARI-2000: A case study based on measured aerosol and cloud properties, J. Geophys. Res., 108(D13), 8467, doi:10.1029/2002JD002315, 2003.
King, M. D., Kaufmann, Y. J., Tanr ´e, D., and Nakajima, T.: Remote sensing of tropospheric aerosols from space: Past, present, and future, Bull. Am. Meteorol. Soc., 80, 2229–2259, 1999.
20
Koepke, P., Hess, M., Schult, I. and Shettle, E. P.: Global aerosol data set. Rep. No 243, Max-Planck Institut f ¨ur Meteorologie, 44 pp., Hamburg, Germany, 1997.
Lelieveld, L., Berresheim, H., Borrmann, S., et al.: Global air pollution crossroads over the Mediterranean. Science, 298, 794–799, 2002.
Liao, H., Seinfeld, J. H., Adams, P. J., and Mickley, L. J.: Global radiative forcing of coupled
25
tropospheric ozone and aerosols in a unified general circulation model, J. Geophys. Res., 109, D16207, doi:10.1029/2003JD004456, 2004.
Morcrette, J.-J.: The surface downward longwave radiation in the ECMWF forecast system, J. Climate, 15, 1875–1992, 2002.
Nishizawa, T., Asano, S., Uchiyama, A., and Yamazaki, A.: Seasonal variation of aerosol direct
30
radiative forcing and optical properties estimated from ground-based solar radiation mea-surements. J. Atmos. Sci., 61, 57–72, doi:10.1175/1520-0469(2004)061, 2004.
ACPD
6, 9151–9185, 2006N. Hatzianastassiou et al.
Near infrared aerosol direct radiative forcing
Title Page Abstract Introduction Conclusions References Tables Figures J I J I Back Close
Full Screen / Esc
Printer-friendly Version Interactive Discussion
EGU
M.: Estimates of global multicomponent aerosol optical depth and direct radiative perturba-tion in the Laboratoire de M ´et ´eorologie Dynamique general circulaperturba-tion model, J. Geophys. Res., 110, D10S16, doi:10.1029/2004JD004757, 2005.
Remer, L. A. and Kaufman, Y. J.: Aerosol direct radiative effect at the top of the atmosphere over cloud free ocean derived from four years of MODIS data, Atmos. Chem. Phys., 6, 237–
5
253, 2006.
Roesch, A., Wild, M., Pinker, R., and Ohmura, A.: Comparison of surface spectral albedos and their impact on the general circulation model estimated surface climate, J. Geophys. Res., 107, D14, 10.1029/2001JD000809, ACL 13-1–ACL 13-8, 2002.
Rossow, W. B., Walker, A. W., Beuschel, D. E., and Roiter, M. D.: International Satellite Cloud
10
Climatology Project (ISCCP). Documentation of new cloud datasets, 115 pp., Wold Meteorol. Org. Geneva, 1996.
Shettle, E. P. and Weinmann, J. A.: The transfer of solar irradiance through inhomogeneous turbid atmospheres evaluated by Eddington’s approximation, J. Atmos. Sci., 27, 1048–1055, 1970.
15
Stackhouse, P. W., Gupta, S. K., Cox, S. J., Mikowitz, C., and Chiacchio, M.: New results from the NASA/GEWEX Surface Radiation Budget project: Evaluating El Nino effects at differ-ent scales, 11th American Meteorological Society Conference on Atmospheric Radiation, Ogden, UT, USA, P.3.6, 2002.
Takemura, T., Nakajima, T., Dubovik, O., Holben, B. N., and Kinne, S.: Single-scattering albedo
20
and radiative forcing of various aerosol species with a global three-dimensional model, J. Climate, 15, 333–352, 2005.
Thekaekara, M. P. and Drummond, A. J.: Standard values for the solar constant and its spectral components, Nature Phys. Sci., 229, 6–9, 1971.
Valero, F. P. J., Bush, B. C., Pope, S. K., Marsden, D. C., and Leitner, A. S.: Aerosol
forc-25
ing during INDOEX and ACE-Asia as determined from aircraft and ground measurements, Geophys. Res. Abstr., 5, 01607, 2003.
Vardavas, I. and Carver, J. H.: Solar and terrestrial parameterizations for radiative convective models, Planet. Space Sci., 32, 1307–1325, 1984.
Vardavas, I. and Koutoulaki, K.: A model for the solar radiation budget of the northern
hemi-30
sphere: Comparison with Earth Radiation Budget Experiment data, J. Geophys. Res., 100, 7303–7314, 1995.
ACPD
6, 9151–9185, 2006N. Hatzianastassiou et al.
Near infrared aerosol direct radiative forcing
Title Page Abstract Introduction Conclusions References Tables Figures J I J I Back Close
Full Screen / Esc
Printer-friendly Version Interactive Discussion
EGU
1965, 1997.
Yu, H., Kaufman, Y. J., Chin, M., Feingold, G., Remer, L. A., Anderson, T. L., Balkanski, Y., Bellouin, N., Boucher, O., Christopher, S., DeCola, P., Kahn, R., Koch, D., Loeb, N., Reddy, M. S., Schulz, M., Takemura, T., and Zhou, M.: A review of measurement-based assessment of aerosol direct radiative effect and forcing, J. Geophys. Res., 109, D03206,
5
doi:10.1029/2003JD003914, 2006.
Zhang, J., Christopher, S. A., Remer, L. A., and Kaufman, Y. J.: Shortwave aerosol cloud-free radiative forcing from Terra, II: Global and seasonal distributions, J. Geophys. Res., D10S24, doi:10.1029/2004JD005009, 2005.
Zhao, T. X.-P., Laszlo, I., Minnis, P., and Remer, L.: Comparison and analysis of two aerosol
re-10
trievals over the ocean in the Terra/Clouds and the Earth’s Radiant Energy System-Moderate Resolution Imaging Spectroradiometer single scanner footprint data: 1. Global evaluation, J. Geophys. Res., 110, D21208, doi:10.1029/2005JD005851, 2005.
ACPD
6, 9151–9185, 2006N. Hatzianastassiou et al.
Near infrared aerosol direct radiative forcing
Title Page Abstract Introduction Conclusions References Tables Figures J I J I Back Close
Full Screen / Esc
Printer-friendly Version Interactive Discussion
EGU
Table 1. Mean global and hemispherical (NH, SH) all-sky near-IR aerosol direct radiative effect (DRE, denoted as∆F in Wm−2) for January and July. The DRE components are given in terms of: outgoing radiation at TOA (∆FTOA), radiation absorbed in the atmosphere (∆Fatmab),
down-ward radiation at surface (∆Fsurf), and net downward (absorbed) radiation at surface (∆Fsurfnet).
∆FTOA ∆Fatmab ∆Fsurf ∆Fsurfnet
January Globe 0.5 0.36 –1.04 –0.85 North Hemisphere 0.62 0.49 –1.4 –1.12 South Hemisphere 0.43 0.16 –0.71 –0.59 July Globe 0.47 0.39 –1.02 –0.86 North Hemisphere 0.51 0.67 –1.45 –1.18 South Hemisphere 0.43 0.11 –0.59 –0.54
ACPD
6, 9151–9185, 2006N. Hatzianastassiou et al.
Near infrared aerosol direct radiative forcing
Title Page Abstract Introduction Conclusions References Tables Figures J I J I Back Close
Full Screen / Esc
Printer-friendly Version Interactive Discussion EGU (i-a) (i-b) (ii-a) (ii-b) (iii-a) (iii-b)
Fig. 1. Global distribution of aerosol optical thickness at (i) 0.9 µm, (ii) 1.75 µm, and (iii) 3.5
ACPD
6, 9151–9185, 2006N. Hatzianastassiou et al.
Near infrared aerosol direct radiative forcing
Title Page Abstract Introduction Conclusions References Tables Figures J I J I Back Close
Full Screen / Esc
Printer-friendly Version Interactive Discussion EGU (i-a) (i-b) (ii-a) (ii-b) (iii-a) (iii-b)
Fig. 2. Global distribution of aerosol single scattering albedo at (i) 0.9 µm, (ii) 1.75 µm, and (iii) 3.5 µm, for (a) January and (b) July.
ACPD
6, 9151–9185, 2006N. Hatzianastassiou et al.
Near infrared aerosol direct radiative forcing
Title Page Abstract Introduction Conclusions References Tables Figures J I J I Back Close
Full Screen / Esc
Printer-friendly Version Interactive Discussion EGU (i-a) (i-b) (ii-a) (ii-b) (iii-a) (iii-b)
Fig. 3. Global distribution of aerosol asymmetry parameter at (i) 0.9 µm, (ii) 1.75 µm, and (iii) 3.5 µm, for(a) January and (b) July.
ACPD
6, 9151–9185, 2006N. Hatzianastassiou et al.
Near infrared aerosol direct radiative forcing
Title Page Abstract Introduction Conclusions References Tables Figures J I J I Back Close
Full Screen / Esc
Printer-friendly Version Interactive Discussion
EGU
(a) (b)
Fig. 4. Global distribution of the aerosol direct radiative effect (DRE) on the outgoing near-IR radiation at top-of-atmosphere (aerosol DRE∆FTOA, W m−2), for(a) January and (b) July.
ACPD
6, 9151–9185, 2006N. Hatzianastassiou et al.
Near infrared aerosol direct radiative forcing
Title Page Abstract Introduction Conclusions References Tables Figures J I J I Back Close
Full Screen / Esc
Printer-friendly Version Interactive Discussion
EGU
(a) (b)
Fig. 5. Global distribution of the aerosol direct radiative effect (DRE) on the atmospheric ab-sorption of near-IR radiation (aerosol DRE∆Fatmab, Wm−2), for(a) January and (b) July.
ACPD
6, 9151–9185, 2006N. Hatzianastassiou et al.
Near infrared aerosol direct radiative forcing
Title Page Abstract Introduction Conclusions References Tables Figures J I J I Back Close
Full Screen / Esc
Printer-friendly Version Interactive Discussion
EGU
(a) (b)
Fig. 6. Global distribution of the aerosol direct radiative effect (DRE) on the absorbed near-IR radiation by the Earth’s surface (aerosol DRE∆Fsurfnet, Wm−2), for(a) January and (b) July.
ACPD
6, 9151–9185, 2006N. Hatzianastassiou et al.
Near infrared aerosol direct radiative forcing
Title Page Abstract Introduction Conclusions References Tables Figures J I J I Back Close
Full Screen / Esc
Printer-friendly Version Interactive Discussion
EGU
(a) (b)
Fig. 7. Aerosol near-IR radiative effect on atmospheric thermal dynamics (∆Fatmab−∆Fsurfnet,
ACPD
6, 9151–9185, 2006N. Hatzianastassiou et al.
Near infrared aerosol direct radiative forcing
Title Page Abstract Introduction Conclusions References Tables Figures J I J I Back Close
Full Screen / Esc
Printer-friendly Version Interactive Discussion EGU (i-a) (i-b) (ii-a) (ii-b) (iii-a) (iii-b)
Fig. 8. Percent contribution of near-IR to the total SW aerosol direct radiative effect at: (i) TOA (∆Fnear−IR
TOA /∆F
total−SW
TOA ), (ii) in the atmosphere (∆F near−IR atmab /∆F
total−SW
atmab ), and (iii) at surface
(∆Fnear−IR surfnet /∆F
total−SW
ACPD
6, 9151–9185, 2006N. Hatzianastassiou et al.
Near infrared aerosol direct radiative forcing
Title Page Abstract Introduction Conclusions References Tables Figures J I J I Back Close
Full Screen / Esc
Printer-friendly Version Interactive Discussion
EGU
Fig. 9. Absolute and percent contribution of globally averaged near-IR and UV-visible aerosol direct radiative effects (DRE) to the total SW aerosol DRE at: TOA (∆FTOA), in the atmosphere