Publisher’s version / Version de l'éditeur:
Materials Research and Standards, 8, 1, pp. 24-28, 1968-02-01
READ THESE TERMS AND CONDITIONS CAREFULLY BEFORE USING THIS WEBSITE.
https://nrc-publications.canada.ca/eng/copyright
Vous avez des questions? Nous pouvons vous aider. Pour communiquer directement avec un auteur, consultez la
première page de la revue dans laquelle son article a été publié afin de trouver ses coordonnées. Si vous n’arrivez pas à les repérer, communiquez avec nous à [email protected].
Questions? Contact the NRC Publications Archive team at
[email protected]. If you wish to email the authors directly, please see the first page of the publication for their contact information.
NRC Publications Archive
Archives des publications du CNRC
This publication could be one of several versions: author’s original, accepted manuscript or the publisher’s version. / La version de cette publication peut être l’une des suivantes : la version prépublication de l’auteur, la version acceptée du manuscrit ou la version de l’éditeur.
Access and use of this website and the material on it are subject to the Terms and Conditions set forth at
Delayed hydration in white-coat plaster : comparison of different
methods of analysis
Ramachandran, V. S.; Sereda, P. J.; Feldman, R. F.
https://publications-cnrc.canada.ca/fra/droits
L’accès à ce site Web et l’utilisation de son contenu sont assujettis aux conditions présentées dans le site LISEZ CES CONDITIONS ATTENTIVEMENT AVANT D’UTILISER CE SITE WEB.
NRC Publications Record / Notice d'Archives des publications de CNRC:
https://nrc-publications.canada.ca/eng/view/object/?id=597fdcd7-3d34-4d96-a0a1-54143dd40482 https://publications-cnrc.canada.ca/fra/voir/objet/?id=597fdcd7-3d34-4d96-a0a1-54143dd40482
ayed Hydration in White-Coat Plaster:
Comparison of Different
Methods of Analysis
V. S. Ramachandran/
P. J. Sereda/
R. F. FeldmanR E F E R E N C E : Ramachandran, V. S., Sereda, P. J., and Feld- man, R. F., "Delayed H y d r a t i o n i n White-Coat Plaster: Com- parison o f D i f f e r e n t Methods o f Analysis," Materials Research
& S1arzda1-cis, Vol. 8, No. 1, pp. 24-28.
ABSTRACT: Samples of white-coat plaster having the constitu- ents of CaS0.,.2H,O, Mg(OH),, Ca(OH),, CaCO,, and MgO were analyzed by DTA, TGA, and chemical analysis. Comparison of results shows fair agreement. Analyses of failed plaster are compared with those for sound plaster to show significant &if-
ferences in the MgO content when the two samples are adjacent to each other in the wall, thus accounting for failure by bulging in localized areas.
KEY WORDS: plaster, differential thermal analysis, thermo- gravimetric analysis, chemical analysis, hydration, magnesium ox- ide
A
number
of
studies
[I-31' have been made of the failure of white-coat plaster by popping or bulging[I-41. Recently, similar failure on one wall in a local laboratory presented an even better case for study because direct comparison could be made of the failed plaster and that which was apparently in good condition. To supplement previous work in- volving autoclave expansion of compacts, differential thermal analyses, thermogravimetric analyses, and chemical analyses were used to determine the con- stituents in the system containing calcium sulfate dihydrate, magnesium hydroxide, calcium hydroxide, calcium carbonate, and magnesium oxide (CaS04. 2 H 2 0 , Mg(OH)Z, Ca(OH)2, CaC03, and MgO). This paper compares the results of the different methods.
Experimental Procedures
Differential thermal investigations were made by an
1 The italic numbers in brackets refer to the list of references
appended t o the paper.
V. S. Rarnachandran was a post-doctorate fellow at the Division of Building Research. National Research Council, Ottawa, Ont.. Canada, from October 1962 to January 1965. His main work with the Division pertained to clay mineralogy, lime and cement chem- istry. Dr. Ramachandran holds B.Sc., M.Sc.. and D.Phil. degrees from Mysore,Banaras, and Calcutta Universities, respectively.
Peter J. Sereda received his engineering training at the University of Alberta, graduating i n chemical engineering i n 1943 and re- ceiving his Master's degree i n 1944. From 1944 t o 1948 he was engaged i n research at the Atomic Energy Project of Canada, at Chalk River, Ont. Subsequently, he has been engaged i n research
automatic recorder unit. All the samples were ground to pass 200-mesh sieve, and quantitative studies were made with a constant weight of the sample. The rate of heating was maintained at 10 c/min, with the sensitivity for the full-scale deflection on the dif- ferential recorder at 2OPv.
Thermogravimetric analysis was carried out by thermobalance. The samples were heated in air at a rate of 5 C/min.
Chemical analysis of all the samples was done ac- cording to the ASTM Methods of Physical Testing of Quicklime and Hydrated Lime ( C 110-58). Loss on ignition was determined by heating the sample to constant weight at 900 C. The loss included carbon dioxide (COz) from CaC03, and water ( H 2 0 ) from Ca(OH)2, Mg(OH)2, and gypsum. Heating at 900 C does not expel sulfur trioxide (SO3) from gypsum and hence this is not involved in ignition loss.
Compacts were formed from plaster samples crushed to pass 200-mesh sieve and compacted in a steel mold of 1.25 in. diameter (3.175 X meters) at a load of 20,000 lb. (9078 kilograms). The diameter of the compact before and after auto- clave treatment was measured with a micrometer of range 1 to 2 in. and sensitivity 0.0001 in. (2.54 X 10-"eters). The compacts were placed in a cage with copper gauze platforms and autoclaved at 295 psi for 1 hr.
Discussion
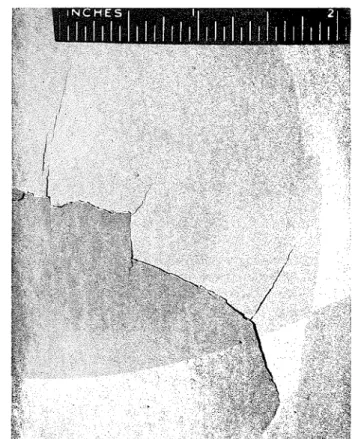
Figures 1 and 2 illustrate the type of plaster failure. Figure 1 shows a typical effect of expansion, which seems to be a prelude to peeling. The extent of fail- on building materials with the Division of Building Research of the National Research Council, Canada. He is head of the Divi- sion's Inorganic Materials Section. Mr. Sereda is the author of many scientific and technical papers. He is a member of t h e Association of Professional Engineers of Ontario, and the U. S. Highway Research Board, and also serves as a member of tech- nical committees of the Canadian Standards Association, National Fire Protection Association, and ASTM.
R. F. Feldrnan was granted his M.A.Sc. degree by Toronto Uni- versity in 1959 and has since been employed at the National Re- search Council. He has been engaged i n research on many physi- cal and chemical phenomena related to materials, their forma- tion, and their deterioration. He has also been involved in a basic study of sorption and length changes on various building materials and has several research publications to his credit.
ure is clearly seen in Fig. 2. The break usually oc- curred at the interface between the white-coat and the base-coat.
Fig. 1 S i n g l e large bulge of white-coat plaster
Fig. %Extent of failure of white-coat plaster
Failure within the period of a few days occurred on one portion sf a wall. A sterilizer had been used continually only a few yards from the point at which failure occurred. Ventilation in the room caused air currents to d e ~ o s i t steam from the sterilizer on the wall at the point where damage was evident. It ap- peared that this portion of the wall had been ex- posed for years to higher humidities than were the bther walls, which were exposed to general room humidity conditions only. This idea was verified by various tests as reported below.
Chemical Analysis
/
Table 1 gives the chemicalTable 1--Chemical Analysis of Plaster Samples, Per Cent
Failed Sound Plaster Plaster Failed Sound (auto- (auto- Plaster Plaster claved) claved)
C a O . . . . . 38.2 39.1 39.0 38.1 M g O . . . . . 22.1 22.2 22.7 22.2 COu.. . . 9.5 10.8 9 . 8 10.8 SO8 . . . 12.4 1 2 . 9 12.9 13.0 Al2O3. . . <0.05 <0.05 <0.05 <0.05 SiO? . . . 0.49 0.48 0 . 4 4 0.58 Loss on ignition.. . . 27.1 2 5 . 2 25.1 25.7
analyses of four samples. The h s t column refers to a sample ,taken from the wall where extensive failure had occurred and is termed "failed plaster." The sam- ple termed "sound" is the plaster, apparently in good condition, taken from an-adjacent
wall.
The third column gives the results from failed plaster after autoclave treatment at 295 psi (2074 kgf/mm" for 1 hr. The last column presents the chemical analysis of autoclaved sound plaster.In all samples the amount of calcium oxide (CaO) varied within a narrow range, 38.1 to 39.1 per cent; the magnesium oxide (MgO) content was almost al- ways the same; and the percentage of COa, SO3, alu- minum oxide (A1203), and silicon dioxide (Si02) remained practically the same. Loss on ignition was higher for failed plaster because more MgO was present than Mg(OH)2. Results indicate that the same type of plaster was applied on all the walls of the room.
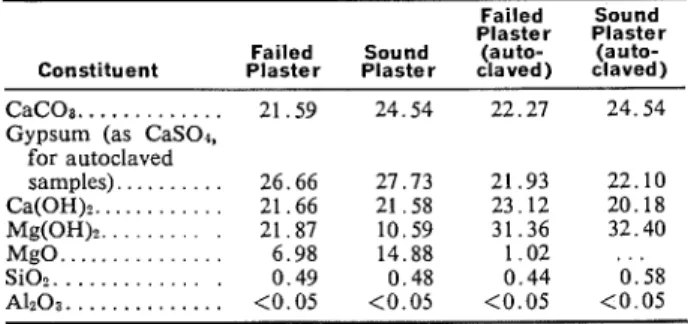
Table 2 shows the amounts of various possible constituents in plasters calculated on the basis of chemical analysis and ignition loss. The loss on igni- tion refers to the loss of COa from CaCO,, and H z 0 from CaS04-2H20, C a ( 0 H ) 2, and Mg(OH) 2. As they were all oven-dried, there was practically no absorbed water on the samples. This was confirmed by DTA and TGA.
The CaC03 content was calculated by assigning all C 0 2 to CaC03. It was assumed that there was no carbonate of magnesium. Gypsum was estimated by assuming that all SO, is attributable to the pres- ence of gypsum. Thus, by knowing the amount of gypsum, the water of its hydration could be calcu- lated. After assigning CaO to gypsum and CaC03 the remaining amount was shown against Ca(OH)2.
Table 2-Calculated Percentages of Various Constituents of Plaster by Chemical Analysis
Failed Sound Plaster Plaster Failed Sound (auto- (auto- Constituent Plaster Plaster claved) claved) CaCOa.. . . . 21.59 24.54 22.27 24.54 Gypsum (as CaSOd,
for autoclaved samples). . . . 26.66 27.73 21.93 22.10 Ca(OH)?.. . . . 21.66 21.58 23.12 20.18 Mg(0H)z.. . . . 21.87 10.59 31.36 32.40 MgO. . . . 6.98 14.88 1 . 0 2 . . . SiO?. . . . 0 . 4 9 0.48 0 . 4 4 0 . 5 8
From the above calculations the percentage of Mg(OH)2 would be
Molecular wt of Mg(OH)2
X loss on ignition -
18
(per cent HzO from C a ( O H ) 2
+
per cent H 2 0 from CaSO4.2Hz0+
per cent COz from CaCO,). The per cent MgO that remained unhydrated is equal to the difference between the total MgO and the MgO present in Mg(OH)2.
Gypsum contents of the sound and failed plaster were about the same, although much lower after autoclave treatment, under which gypsum dehydrates to CaS04. This was observed in an earlier study of plasters [ 4 ] . The results of TGA and DTA also con- firmed that CaS04-2Hz0 was almost completely de- hydrated with autoclaving. The water of hydration for gypsum, according to chemical analysis for the sound plaster, was 5.81 per cent, and this reduces to almost nil after autoclaving. Hence, in calculations in Table 2 no HzO was assigned to gypsum, which was calculated as CaS04 for autoclaved samples.
The amount of Mg(OH)2 in the failed plaster was 21.87 per cent, whereas in the sound plaster it was only 10.59 per cent. This should indicate that hydra- tion had occurred to a greater extent in the failed plaster. The autoclaved samples of sound and failed plaster contained 32.40 and 31.36 per cent Mg- (OH)2, respectively.
Although the amounts of C a ( O H ) z in both sound and failed plaster were nearly the same, the CaC03 content in sound plaster was greater. In the calcula- tions for failed plaster, increasing the Mg(OH)2 content may result in a slightly decreased value of CaC03. In addition, the conditions of exposure for sound plaster were different from those for failed plaster.
The alumina content in all the samples was very low and the quantity of silica negligible. Hence, it was assumed that they would not affect the calcula- tions.
Sound plaster contained 14.88 per cent MgO, whereas failed plaster contained only 6.98 per cent MgO. This indicates that there was more hydration of MgO in the failed plaster. Although autoclave treatment involves complete hydration of MgO in the sound plaster, some MgO remained unhydrated in the failed plaster. It is not known whether this is due to a protective layer of Mg(OH)2 on MgO or
whether higher pressures ana more prolonged auto- claving were needed. MgO with varying degrees of unreactivity is also expected.
Thermogravimetric Analysis
/
Figure 3 shows TGA curves for four samples. The TGA is a dynamic method, and the temperature versus loss in weight curve is obtained fairly quickly. It can be applied to a quantitative evaluation of the various substances present in a mixture. It was of interest to study how the accuracy of TGA compared with chemical analysis.Thermogravimetric curves represent the per- centage loss calculated on the basis of the ignited sample. Gypsum loses two molecules of water in the temperature range 120 to 150 C, and Mg(OH)2 loses ( O H ) water in the range 325 to 450 C. The onset of dehydroxylation of C a ( O H ) 2 takes place at about the temperature at which dehydroxylation of Mg(OH)2 appears to be complete. The exact location of the end point of Mg(OH)2 dehydroxylation or the onset of dehydroxylation of Ca(OH), involves some error, but does not alter the estimation signikantly. Dehydroxylation of C a ( O H ) 2 is noticed in the tem- perature range 450 to 550 C. The loss of C 0 2 from CaCO, is calculated at between 600 and 850 C. It is difficult to determine exactly the temperature inter- vals of weight loss due to any particular component when the inflections in the curve are not flat. The small slopes of the curve are observed at tempera- tures of 250 to 325 C and 550 to 600 C. Weight losses in these ranges are negligible. Perhaps in such cases they could be equally shared between two constituents on either side of the inflection. A slight increase in C a ( O H ) 2 in failed plaster indicates the presence of CaO in the original material.
Comparison of T G A and Chemical Analysis
/
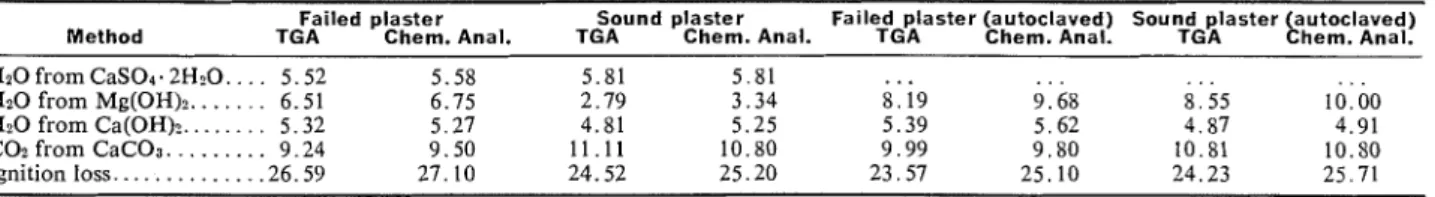
Table 3 gives the weight losses obtained by TGA and chemical analysis for various constituents of the plaster. In general, agreement was good for gypsum, CaC03, and Ca(OH)2; but there are some differ- ences in the values for Mg(OH)2, that obtained by TGA being relatively less.
In sound plaster TGA gave estimations of CaS04 -2H20, Mg (OH)2, Ca(OH)2, and CaC03 as 27.76, 9.04, 19.77, and 25.24 per cent, respectively, and corresponding values for failed plaster of 26.37, 21.09, 21.87, and 21.00 per cent. The percentage of MgO by difference in sound and failed plaster was 18.19 and 9.67 per cent, respectively. Higher values obtained by TGA could be due to the dy- namic nature of the method itself, and also to the unestimated A120, and S O z . Taking into account A12O3 and S O 2 , determined by chemical analysis, the percentage of MgO calculated by TGA differed by 2.78 per cent for sound plaster and 2.15 per cent for failed plaster. The TGA method is expected to give more accurate results if the rate of heating is much lower than 5 C/min. The time required to heat to 1000 C would be nearly 17 hr if the rate of heating were 1 C/min. Perhaps the TGA method could profitably be applied even if carried out at a rate of 5 C/min for testing the unsoundness of limes. The ASTM Specification for Special Finishing Hy-
Table 3-A Comparison of Weight Losses Due to Various Components by Chemical and Thermograwimetric Analysis
Failed plaster Sound plaster Failed plaster (autoclaved) Sound plaster (autoclaved) Method TGA Chem. Anal. TGA Chem. Anal. TGA Chem. Anal. TGA Chem. Anal.
~ -
H z 0 from CaSOd. 2H2O.. . . 5.52 5.58 5.81 5.81 ... . . . . . . . . . H z 0 from Mg(0H)z. . . 6.51 6.75 2.79 3.34 8.19 9.68 8 . 5 5 10.00 H z 0 from Ca(0H)z. . . 5.32 5.27 4.81 5.25 5.39 5.62 4.87 4.91 C0z from CaC03. ... 9.24 9.50 11.11 10.80 9.99 9.80 10.81 10.80 Ignition loss.. . . .26.59 27.10 24.52 25.20 23.57 25.10 24.23 25.71
Table +Proportions of Various Constituents in Plaster as Obtained by Chemical Analysis, TGA, and DTA
Gypsum Mg(0H)z Ca(OH)? CaCOl
Chem. Chem. Chem. Chem.
Sample Anal. TGA DTA Anal. TGA DTA Anal. TGA DTA Anal. TGA DTA
Sound plaster.. . . . 1 1 1 1 1 1 1 1 1 1 1 1 Failed plaster.. . . .0.96 1.07 0.97 2.08 2.33 2.26 1 1.10 1.03 0.88 0.83 0.90
. . .
Autoclaved sound plaster. . . . . . 3.08 3.06 3.12 0.93 1.01 1.03 1 0 . 9 8 0.91 Autoclaved failed plaster.. . . . . . . . . 2.98 2.94 2.89 1 . 0 6 1.12 1.09 0.91 0.89 0.93
3 6 - 34 - 3 2 - 30 - 2 8 - S o u n d P l a s t e r 2 6 - F a i l e d P l a s t e r + C 2 4 - 2 2 2 - a 2 0 - V)
.?
1 8 - + 1= rn 16- 1 2 - 10- 8 - 6 - S o u n d P l a s t e r T e m p e r a t u r e ,"CFig. 3-Thermogravimetric curves of plasters
drated Lime ( C 206-49) does not allow more than 8 per cent unhydrated oxides. If a TGA gives an MgO content less than 8 per cent, then it is safe to pass the lime. It may be a very useful negative test for limes.
Differential Thermal Analysis
/
The technique of DTA can be applied with advantage to identify and estimate quantitatively various compounds in the plaster. Well-defined peaks for gypsum, Mg(OH)?, Ca(OH)2, and CaCOs make the DTA method particularly useful in plaster investigations. Kiyoura and Sata [5] could identify CaCO, to anaccuracy of + 2 per cent in mixtures of CaC0, and
F a i l e d P l a s t e r S o u n d P l a s t e r A u t o c l a v e d F a i l e d P l a s t e r A u t o c l a v e d Sound P l a s t e r T e m p e r a t u r e , "C
Fig. &Differential thermal analysis of plasters
Ca(OH)2. The failed plaster (Fig. 4 ) exhibits two endothermic peaks at 150 and 165 C. The first rep- resents the loss of 1Y2 molecules of water and the second, the remaining 1/2 molecule of water from
gypsum. The endothermic peak at 386 C is caused by the decomposition of M g ( ( O H ) z ; that at 484 C by the decomposition o,f Ca(OH)2. The decarbonation reaction of CaC03 is shown as a very large endo- thermic effect at 808 C. In all four samples the peak temperatures of particular constituents are about the same.
A comparison of the thermograms of failed and sound plaster is interesting: the Mg(OH)2 peak in
failed plaster is much more intense than that of sound plaster. This is a clear indication that failed plaster contains more Mg(OH)2, and results of T G A and chemical analysis bear this out. The autoclaved plaster failed to indicate the inflections due to gypsum, showing that gypsum is dehydrated under autoclave treatment. These results agree with those of TGA. The DTA of both autoclaved samples is almost identical, and the chemical analysis also proves that the constitution of the autoclaved samples is very similar.
Quantitative estimation of the constituents can be obtained by determining the peak areas and cali- brating against the DTA of pure substances with known heats of reaction. A direct comparison of the areas of various effects obtained for one sample will be misleading, however, because the peak area is proportional to the heat of reaction, and this value differs from one compound to the other. For ex- ample, in failed plaster the percentages of C a ( O H ) 2 and CaC03 are about the same, but the endothermic peak area of CaC03 is much larger.
Comparison of TGA, DTA, and Chemical Anal- ysis
/
No attempt was made to calculate the AH values. Endothermal peak areas of the four constit- uents in sound plaster were, however, compared with the corresponding areas of the other three samples. The results were then compared with those of TGA and chemical analysis, and are presented in Table 4. The properties of the individual constituents were calculated, taking the proportions for the sound plaster as unity. The results of TGA and DTA show good agreement. Because of the dynamic nature of the DTA and TGA techniques, the estimated values are less than thosc obtained by chemical analysis and ignition loss.Autoclave Studies on Compacts
/
Earlier studies [6] have shown that autoclave expansion experiments on limes could be carried out without admixing them with cement. The failed and sound plasters were powdered, and circular compacts of diameter 1.25 in. were formed at 20,000-lb pressure. The weight and dimensional changes were determined both before and after autoclaving. Autoclave treatment resulted in a weight decrease of 2.93 per cent in the failed plaster and a weight increase of 0.87 per cent in the sound plaster. These results were checked from the results of chemical analysis, which gave the amounts of gypsum and MgO in the failed plaster as 26.66 and 6.98 per cent, respectively. Autoclave treatment should result in a decrease of 5.58 per cent H 2 0 with gypsum and an increase of 3.12 per cent H 2 0 with MgO. The net decrease in weight would be 2.46 per cent, which is lower than the autoclave weight loss results. Chemical analysis shows that in failed plaster 1.02 per cent MgO remains unhydrated; hence the increase in weight due to hydration of(6.98 to 1.02) per cent MgO is equal to 2.66 per cent, and the net decrease is 2.92 per cent. This is in excellent agreement with an autoclave weight change value of 2.93 per cent. The weight increase in sound plaster after autoclaving is 0.87 per cent. By chemi- cal analysis, the dehydration of 27.73 per cent
28 / MATERIALS RESEARCH & STANDARDS
gypsum results in a loss of 5.81 per cent, and the hydration of 14.88 per cent MgO results
in
a weight increase of 6.64 per cent. The net weight gain is 0.83 per cent, also a figure that is in good agreement with experimentally determined values.compacts
made
from the two plaster samples, when autoclaved, showed an expansion of 15.4 per cent for sound plaster and 5.4 per cent for failed plaster. Becausi investigations to date prove that expansion is the result of hydration of MgO, it may be concluded that the difference in expansion be- tween the two samples can b e accounted for by the difference in the MgO content of the two samples; the hydration of 7.9 per cent MgO resulted in the 1 0 per cent difference in expansion. This result, however, cannot be interpreted to mean that an ex- pansion of 1 0 per cent took place in the white-coat plaster on the wall. It would depend on the conditions of hydration, the porosity of the material, and per- haps on the character of the bond with the base. Thus, autoclaving of compacts should be used only to indicate the relative potential for expansion of different samples. If a calibration were carried out, as for dolomitic lime [ 6 ] , this expansion could be re- lated in terms of practical experience to limit the amount of MgO permissible in white-coat plaster.Conclusions
Techniques involving compacts, TGA, DTA, chemi- cal analysis, and autoclaving can be applied to the study of plasters containing mainly CaS0,-2H20, M g ( 0 H ) 2, C a ( 0 H ) CaCO:{, and MgO. Results ob- tained by these methods were in fair agreement with each other. The dynamic methods of T G A and DTA could be used as negative tests for determining the suitability of limes.
Results of the investigation prove that the failure of the plaster was caused by the expansive forces of the hydration of unreactive MgO. The sudden failure is attributed to the condensation of steam on a par- ticular patch of wall.
The-autoclave test sccms to simulate the natural conditions of exposure to humidity, differing only in being more severe. Application of the autoclave test for soundness should again be reviewed for inclusion in standard specifications.
REFERENCES
[ I ] Murray, J . A. and Fischer, H . C., "A Study of White-Coat Plaster by Differential Thermal Analysis," Proceedirzgs, Am. Soc. Testing Mats., Vol. 51, 1951, pp. 1-16.
[2] Newman, E. S., "Investigation of Plaster Failure," B~rlletin,
Am. Ceramic Soc., Vol. 26, 1947, p. 117.
[3] Wells, L. S., Clarke, W. F., Newman, E. S., and Bishop, D. L., "Investigation of Failures of White Coat Plaster," Building Materials and Structlrre Rept. No. 121, National Bureau of Standards, 1951, p. 42.
[4] Ramachandran, V. S., Sereda, P. J., and Feldman, R. F., "De- layed Hydration in White Coat Plaster," Materials Research
& Standards, Vol. 4 , No. 12, p. 663.
151 Kiyoura, R. and Sata, T., "Quantitative Analysis of the CaCo,, Ca(OH)2, Mg(OH), System by DTA," Journal,
Ceramic Assoc. Japan, Vol. 58, 1950, p. 39.
[61 Ramachandran, V. S., Feldman, R. F. and Sereda, P. J., "An
Unsoundness Test for Limes without Cement," Materials Re- search & Standards, Vol. 5, No. 10, 1965, p. 510.