www.atmos-chem-phys.net/6/3315/2006/ © Author(s) 2006. This work is licensed under a Creative Commons License.
Chemistry
and Physics
Optical properties and mineralogical composition of different
Saharan mineral dust samples: a laboratory study
C. Linke1, O. M¨ohler1, A. Veres2, ´A. Moh´acsi3, Z. Boz´oki3, G. Szab´o2, and M. Schnaiter11Forschungszentrum Karlsruhe, Institute of Meteorology and Climate Research, P.O. Box 3640, 76021 Karlsruhe, Germany 2University of Szeged, Faculty of Natural sciences, Department of Optics and Quantum Electronics, P.O. Box 406, 6701
Szeged, Hungary
3Research Group on Laser Physics of the Hungarian Academy of Sciences, D´om t´er 9., 6720 Szeged, Hungary
Received: 23 December 2005 – Published in Atmos. Chem. Phys. Discuss.: 11 April 2006 Revised: 10 July 2006 – Accepted: 4 August 2006 – Published: 10 August 2006
Abstract. In aerosol chamber experiments optical properties of resuspended mineral dust samples of defined size distribu-tions were measured. Extinction coefficients (bext)and mass
specific extinction cross sections (σext)were determined for
Saharan dust samples from different locations. The results for σextwere not very sensitive to the type of dust and varied
at λ=550 nm between 3.3±0.4 m2g−1 and 3.7±0.4 m2g−1. The absorption coefficients (babs)and mass specific
absorp-tion cross secabsorp-tions (σabs)were determined with a novel
multi-wavelength photo-acoustic absorption spectrometer (PAS). The single scattering albedo was close to 1 (0.98 to 0.99) at 532 nm and 1064 nm, but significantly lower (0.63 to 0.76) at 266 nm. Additionally the chemical and mineralogical com-position of the dust samples were analysed with special re-gard to the iron oxide phases hematite and goethite. At
λ=266 nm the mineral dust sample without any detectable iron oxides showed a significantly higher SSA compared to the sample with a hematite content of 0.6 wt-%.
1 Introduction
Mineral dust aerosols from desert regions contribute signifi-cantly to the total atmospheric aerosol load (Andreae, 1995). During the transport over long distances the dust clouds are able to affect the earth’s radiative budget by absorption and scattering in the near-UV, visible and infrared spectral re-gions. The optical properties vary with size and mineralog-ical composition of the dust, resulting in a positive or neg-ative radineg-ative forcing of the atmosphere. Especially dark mineral phases like iron oxides predominantly influence the wavelength-dependent mass specific absorption cross section of naturally occurring mineral dusts in the visible spectral re-gion (Tegen et al., 1996; Sokolik and Toon, 1999).
Correspondence to: M. Schnaiter ([email protected])
We measured the specific extinction and absorption cross-sections of different airborne Saharan dust samples in the UV/VIS spectral region. All optical instruments sampled from a laboratory aerosol chamber which contained the min-eral dust aerosol with a well characterised size distribution in the sub-micron particle diameter range.
Spectra of the extinction coefficient were measured from
λ=230 to 1000 nm. The absorption coefficient, and hence the single scattering albedo were determined at three wave-lengths in the near-UV (λ=266 nm), the visible (λ=532 nm), and the near-IR (λ=1064 nm). In addition to the optical measurements, the chemical and mineralogical compositions of the dust samples were analysed, with a focus on iron oxide mineral phases, i.e. hematite (Fe2O3) and goethite
(FeO(OH)). The correlation between the deduced spectral quantities and the iron oxide content of the samples is dis-cussed.
2 Aerosol chamber experiments
2.1 Experimental set-up and instrumentation
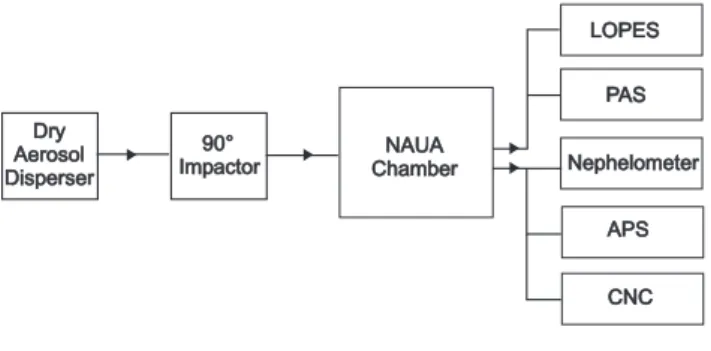
The experiments were conducted using the stainless steel aerosol chamber NAUA which is part of the AIDA (Aerosol Interactions and Dynamics in the Atmosphere) facility of Forschungszentrum Karlsruhe, Germany. The chamber has a volume of 3.7 m3which allows measurements over several hours with the suite of devices used in this study (Fig. 1). The chamber is equipped with a mixing fan to achieve ho-mogeneous conditions throughout the chamber volume. A constant synthetic air flow of about 2 m3h−1 balances for sampling losses and assures a well defined dilution rate of the aerosol during the experiment. All experiments were performed at constant temperature (296 K) and atmospheric pressure conditions.
Dry Aerosol Disperser Dry Aerosol Disperser 90° Impactor90°
Impactor ChamberChamberNAUANAUA
LOPES
Nephelometer APS CNC PAS
Fig. 1. Experimental setup of mineral dust dispersion, aerosol chamber NAUA and sampling. LOPES: Long Path Extinction Spectrometer, PAS: Photo-acoustic Absorption Spectrometer, APS: Aerodynamic Particle Sizer, CPC: Condensation Particle Counter.
Mineral dust aerosol was generated and added to the aerosol chamber by roughly dispersing the finest sieved frac-tion (<20 µm) of the dry desert dust samples in a rotating brush disperser (Palas, RGB 1000), de-agglomerating the finest particles in an aerosol dispersion nozzle and remov-ing larger particles in a series of four 90◦ inertial impactor stages. Both the brush disperser and the dispersion nozzle were operated with dry and particle-free synthetic air. The dispersion pressure of the nozzle was 1.5 bar. The impactor stages with a cut-off d(50)of 1.2 µm (aerodynamic
diame-ter) limited the size range of particles entering the NAUA chamber. Thus, particle losses by sedimentation in the hor-izontal sampling lines and the long horhor-izontal flow tube of LOPES were minimised resulting in a low systematic error of less than 5% in the deduced specific optical cross sections. Figure 2 shows representative size distributions of the four mineral dust aerosols in the NAUA chamber during the ex-periments.
The extinction coefficient was measured wavelength-resolved from λ=230 to 1000 nm with a spectral resolution of 2.5 nm by the extinction spectrometer LOPES (Schnaiter et al., 2005). The optical cell of LOPES is a horizontally mounted stainless steel flow tube of 3.5 m length and of 26 mm inner diameter. The optical length is twice the ge-ometric length. The tube was operated at a flow rate of 5 L min−1 resulting in an aerosol transmission efficiency of more than 95% for particles with Stokes diameters smaller than 1 µm.
During calibration and validation the scattering coeffi-cients at 450, 550 and 700 nm were measured for soot aerosol with a commerical integrating nephelometer (TSI; 3653). The instrument was calibrated by CO2and filtered air. The
nephelometer was operated at a flow rate of 5 L/min. From extinction and scattering measurements the absorp-tion coefficients can be calculated by the difference method (DM):
babs=bext−bsca
Fig. 2. Size distributions of mineral dust aerosols measured by the
APS (Aerodynamic Particle Sizer). The aerodynamic equivalent particle diameter was converted to the Stokes diameter dst using
Eq. (1). The aerosol was sampled from the aerosol chamber NAUA.
Necessary nephelometer corrections are reasonable for mod-erately absorbing aerosols like biomass burning smoke with SSAs up to 0.7 (Schnaiter et al., 2005). For aerosols with higher SSA values the uncertainties in the calculated ab-sorption coefficient increase due an increasing importance of the nephelometer and LOPES measurement errors. With regard to typical mineral dust aerosols with particle sizes above 0.5 µm, broad distributions and non-spherical particle shapes, the nephelometer turned out to be not applicable for precise measurements of the scattering coefficient, necessary to deduce the absorption coefficient by applying the DM. Closer examination of similar sized, non-absorbing quartz glass beads and non-spherical quartz glass particles indicates that the nephelometer correction depends not only on particle size but also on particle shape. Therefore, we used the DM only in case of highly absorbing soot to validate the direct absorption measurements by the photo-acoustic absorption spectrometer.
Absorption measurements were conducted with a multi-wavelength photo-acoustic absorption spectrometer (PAS) recently developed at the University of Szeged, Hungary, with a total sample rate of 1.5 L min−1. PAS uses the fun-damental (λ=1064 nm), the frequency doubled (λ=532 nm), and quadrupled (λ=266 nm) modulated emission of a diode-laser-pumped, quasi-continuous wave, Q-switched Nd:YAG laser (Spectra Physics, laser head VHP80-106Q, power sup-ply J20I-8S40-16NSI). The photo acoustic signal genera-tion basically implies the conversion of light into acoustic energy. The intensity of the generated sound, which was detected with a microphone placed inside a resonant photo acoustic absorption cell (PA cell), is proportional to the con-centration of absorbing trace molecules or aerosol particles. The Nd:YAG laser was run at 16 kHz repetition rate (which
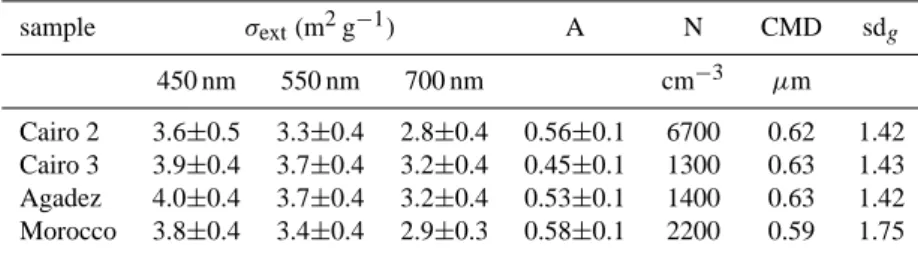
Table 1. Specific extinction cross sections, size distribution parameters. sample σext(m2g−1) A N CMD sdg 450 nm 550 nm 700 nm cm−3 µm Cairo 2 3.6±0.5 3.3±0.4 2.8±0.4 0.56±0.1 6700 0.62 1.42 Cairo 3 3.9±0.4 3.7±0.4 3.2±0.4 0.45±0.1 1300 0.63 1.43 Agadez 4.0±0.4 3.7±0.4 3.2±0.4 0.53±0.1 1400 0.63 1.42 Morocco 3.8±0.4 3.4±0.4 2.9±0.3 0.58±0.1 2200 0.59 1.75
σext– specific extinction cross section; A – Angstr¨om Exponent for extinction; N – initial number concentration at t=0; CMD – count median
diameter; sdg– geometric standard deviation
was the optimum frequency for the highest fourth harmonic power) and was modulate at 4 kHz (which was equal to the resonance frequency of the PA cells). The wavelength con-version was achieved by focusing first the near-infrared light (1064 nm) to a nonlinear LBO (LiB3O5)crystal followed by
focusing the derived green light to a second nonlinear DKDP (deuterated potassium dihydrogen phosphate) crystal. The power of the laser lights were 750 mW at 1064 nm, 80 mW at 532 nm and 4 mW at 266 nm. This system is an upgraded version of a system used for photo acoustic ozone detection (Veres et al., 2005). While the ozone detection system used only one photoacoustic cell, for one wavelength of 266 nm, the present system uses 3 identical PA cells for the 3 avail-able wavelengths. The aerosol sample from the chamber was split in three identical flows through the PA cells.
At λ=266 nm and λ=532 nm, the photo acoustic cells were calibrated with ozone and NO2, respectively. For
the ozone calibration at λ=266 nm, a cross section of 9.44×10⁻¹⁸cm2/molecule was applied, taken from a spec-trum by Voigt et al. (2001) measured at 293 K and 1000 mbar. For the NO2 calibration at λ=532 nm, a cross section of
1.47×10⁻¹⁹cm2/molecule was used, taken from a spectrum by Voigt et al. (2002) which was also measured at 293 K and 1000 mbar.
At the IR-wavelength λ=1064 nm, the PAS system was calibrated with a polydisperse soot aerosol from a co-flow diffusion flame of propane and air (Combustion Aerosol Standard, CAST, Jing-CAST Technologies). The burner was operated at a C/O ratio of 0.29. Wavelength-dependent mass-specific absorption cross sections of the same CAST-soot in the wavelength-range between 450 nm and 700 nm have been determined in a separate campaign, yielding an Angstr¨om ex-ponent for absorption of 1.0 (.Schnaiter et al., 2006). Taking this Angstr¨om exponent the absorption at λ=1064 nm was calculated by extrapolation. The uncertainty of calibration was determined to be ±2% for all three wavelengths.
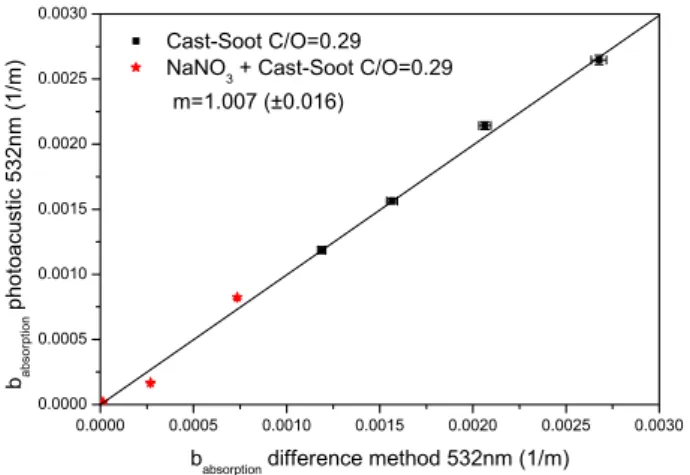
Correlations between absorption coefficients measured with PAS and derived from extinction and scattering mea-surements by the difference method (DM, Schnaiter et al., 2005) are shown in Figs. 3 and 4 for pure CAST soot and mixtures of CAST soot with non-absorbing but scattering
Fig. 3. Comparison of PAS at 266 nm with the difference method
(DM) using CAST-soot with a C/O ratio of 0.29.
sodium nitrate at λ=266 nm and λ=532 nm, respectively. The latter experiments with external aerosol mixtures showed that the presence of a strongly scattering aerosol fraction does not interfere significantly with the PA measurement of absorp-tion. Here, the absorption Angstr¨om exponent determined by DM in the 450 to 700 nm spectral region was used to ex-trapolate and interpolate the DM deduced absorption coeffi-cients at λ=450 nm and λ=550 nm to the PAS wavelengths at λ=266 nm and λ=532 nm. The detection limit of the PAS system was determined to be 10−5m−1. The overall uncer-tainty of the PAS measurement is about 5% for our aerosol concentrations. Total particle number concentrations of the aerosols in the chamber were measured with a condensation particle counter (TSI, CPC 3022A) operated at a flow rate of 0.3 L min−1. Number size distributions were measured with an aerodynamic particle sizer (APS 3321, TSI) operated at a flow rate of 5 L min−1. The APS acquires size distributions in the aerodynamic diameter range from 0.5 to 10 µm with a resolution of 32 channels per decade.
Fig. 4. Comparison of PAS at 532 nm with the difference method
(DM) using CAST-soot with a C/O ratio of 0.29.
2.2 Experimental procedure
At the beginning of each experiment the NAUA chamber was evacuated, flushed, and re-filled with dry synthetic air, result-ing in a background particle concentration less than 2 cm−3.
All experiments were performed at room temperature and ambient pressure. Mineral dust aerosol was then added to the chamber using the dispersion set-up described above for about 30 min, which led to initial particle number concen-trations between 1300 cm−3and 6700 cm−3. The container volume served as an aerosol reservoir for the sampling in-struments. On the time scale of the experiments, aerosol dilu-tion was the dominant loss process for mineral dust particles which had no significant effect on the specific optical prop-erties of the aerosol. In addition to the online measurements mineral dust samples were collected on Nuclepore filters for analysis by scanning electron microscopy (SEM).
Two sets of experiments were performed: In a first set, the optical properties were quantified by means of extinc-tion measurements solely, together with measurements of the aerosol number concentration and size distribution. In a sec-ond set of experiments, the PAS instrument was also operated at the NAUA chamber to measure optical absorption coeffi-cients simultaneously to the extinction coefficoeffi-cients.
3 Aerosol concentration and size distribution
A series of similar experiments was performed with four Sa-haran mineral dust samples of different colour and origin. A soil sample from the Northern Sahara, Cairo 2, was collected 70 km northeast of Cairo city from a depth of 0.5 m. The colour of this sample is light yellow to light brown. A wind blown dust sample, Cairo 3, was collected on a flat surface in Cairo city after a dust storm event at 19 March 2002. This sample has a similar colour as Cairo 2. A Sahelian soil
sam-ple from Agadez (Niger) and a soil samsam-ple from Morocco became available by courtesy of Lothar Sch¨utz from the Uni-versity of Mainz. Compared to the Cairo samples, these sam-ples have a darker appearance and are coloured yellow brown (Agadez) to reddish brown (Morocco).
All samples were sieved to grain size fractions of less than 20 µm, 20 to 75 µm, and greater than 75 µm. Our experi-ments were performed with the fraction of particles less than 20 µm. The other fractions were disregarded for the present study.
Applying the same dispersion procedure resulted in a larger aerosol number concentration for the Cairo 2 sam-ple (6700 cm−3) compared to the other samples (1300 to 2200 cm−3). This indicates an enhanced number fraction of particles smaller than 1.2 µm aerodynamic diameter in the Cairo 2 sample (Table 1).
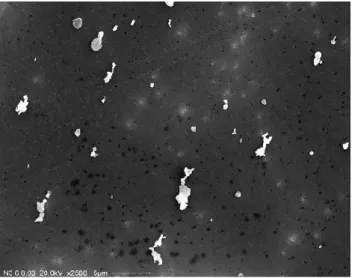
Since the SEM images revealed a non-spherical, irregu-lar, but compact shape of the dust particles (Figs. 5 to 8), the aerosol mass concentration was determined from the APS measurements by first calculating the volume equiva-lent sphere diameter dst (Stokes diameter) of the irregularly
shaped mineral dust particles
dst =
r χ ρp
dae (1)
from the measured aerodynamic diameter dae. The particle
density ρp=2.5 g cm−3was determined by pycnometric
anal-ysis of the mineral dust sample. To account for the irregular particle shape we used a dynamic shape factor χ =1.5 which is typical for minerals like quartz (Baron and Willeke, 2001). Figure 2 shows a representative size distribution of our four dust samples as function of dst. A lognormal size
distribu-tion was then fitted to the resulting aerosol size distribudistribu-tions. Good representations of the measured size distributions were achieved by this approach especially for the larger particles which represent the main contribution to the total aerosol vol-ume. The moments of the fit result, i.e. the count median diameter (CMD), the geometric standard deviation, and the total particle number concentration, were used to calculate the mass concentration of the aerosol taking the particle den-sity given above. During an experiment both the CMD and geometric standard deviation remained almost constant. For the interpretation of the measured aerosol optical properties it is important to note that comparable CMDs and standard deviations were found for the four investigated mineral dust types (Table 1).
4 Mineralogical composition and analysis
The desert dust samples were characterised in cooperation with the Institute for Materials Research (IMF I) at FZK, the division of Water Technology and Geotechnology, Institute for Technical Chemistry (ITC-WGT) of FZK and the Astro-physical Institute of the University of Jena.
Fig. 5. SEM picture of mineral dust Agadez.
Fig. 6. SEM picture of mineral dust Cairo 2.
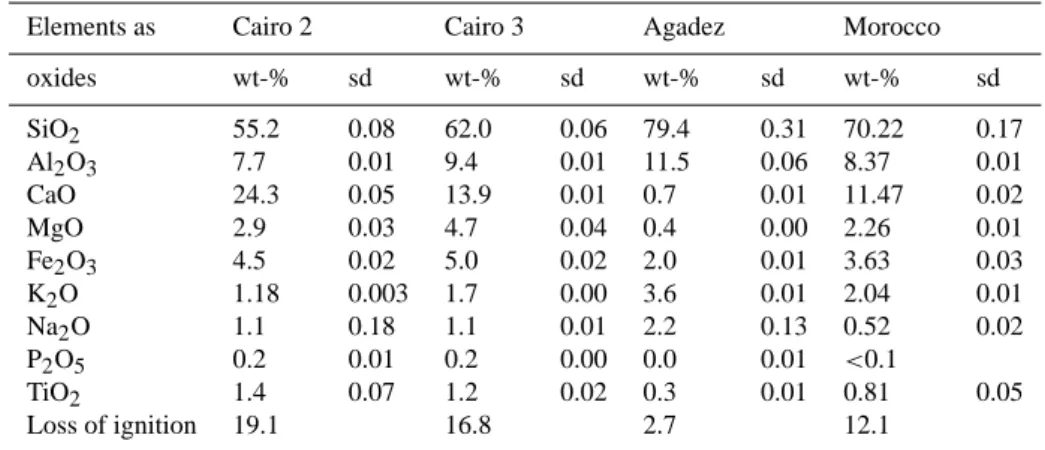
The elemental composition of each mineral sample was determined for the dust fraction <20 µm by X-Ray Fluores-cence Analysis (XRF, Bruker AXS, SRS 303AS). The sam-ples were ignited for one hour at 1000◦C prior to the analysis. For each dust type a sample of 200 mg was analyzed. For the measured elements weight percentages of oxides were cal-culated (Table 3). Thus, the samples yielded total iron oxide content, which mainly contributes to the absorption coeffi-cient of the dust aerosol, and ranged between 2.0 to 5.0 wt-%.
In addition to the chemical analysis the mineral composi-tion was investigated by IR spectroscopy and X-ray-powder-diffractometry with Rietveld phase analysis (XRD, Bruker AXS, D8 diffractometer). For IR spectroscopy the dust frac-tion <20 µm was mixed with KBr powder before the mix-ture was pressed to a pellet. The pellet was then analysed by
Fig. 7. SEM picture of mineral dust Cairo 3.
Fig. 8. SEM picture of mineral dust Morocco (note the lower
mag-nification compared to the other pictures). The inserted magnified image gives an impression of the diversity of the dust grains in terms of size and surface structure.
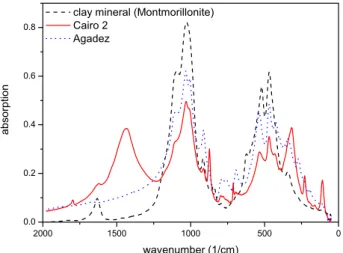
IR transmission spectroscopy in the 50 cm−1 to 2000 cm−1 spectral range. The XRD analysis was performed directly on a granular sample of the dust fraction < 20 µm. Figure 9 shows the IR-spectra of Cairo 2 and Agadez in comparison to the spectrum of the pure clay mineral Montmorillonite. Corresponding absorption bands of sample- and reference-spectra at 500 and 1000 cm−1indicate the presence of related
clay minerals in both Saharan samples. In Fig. 10 the spec-tra of Cairo 2 and Agadez are compared with the spectrum of the pure calcite. While Cairo 2 shows several absorption bands consistent with the spectrum of calcite at 1500 cm−1, 800 cm−1and below 500 cm−1the Agadez sample displays no significant absorption bands at these wavenumbers.
Fig. 9. IR-spectra of mineral dust Cairo 2, Agadez and of the clay
mineral Montmorillonite.
Fig. 10. IR-spectra of mineral dust Cairo 2, Agadez and of calcite.
Both methods, IR spectroscopy and XRD analysis, show that all investigated samples contain quartz, feldspars and clay minerals in different compositions. In addition, the sam-ples from Cairo and Morocco contain significant amounts of calcite, dolomite and gypsum.
In our case the XRD method was applied to identify the iron oxide phases hematite or goethite. Depending on the crystal phase of interest the method has a detection limit of 0.1 to 0.5 wt-% for iron oxides. While the Cairo 2 and Cairo 3 samples showed no detectable iron oxide phases, there are indications for goethite in the Agadez sample in a very low concentration of ∼0.2 wt-% which is at the detection limit of the method.
Only for the Morrocco sample the XRD method yielded, after careful analysis, a detectable amount of 0.6 ±0.1 wt-% of hematite However, due to a possible enrichment of hematite in the fine aersol fraction, the hematite concentra-tion in the chamber aerosol could be significantly higher than the concentrations found in the XRD analysis of the granular samples.
Fig. 11. Extinction spectra of the investigated mineral dust samples
and hematite.
5 Results
UV-VIS extinction spectra are shown in Fig. 11 for the four mineral dusts and pure hematite. As expected from the wavelength-dependent complex refractive index of pure hematite (Sokolik and Toon, 1999) the extinction spectrum of synthetic hematite aerosol differs significantly from that of the investigated natural mineral dusts. The hematite sample consists of a narrow size distribution of pseudo-cubic hematite particles (Sugimoto et al., 1993). Probably the hematite spectrum shows a Mie-type resonance struc-ture around 600 nm, but this does not affect the general absorption-induced flat spectral behaviour in the wavelength range below 600 nm, which is obviously a specific spectral feature of hematite.
For calculating σext the aerosol mass concentration was
derived from the measured size distributions. The total un-certainty in the mass determination of 20% resulted from er-rors of total number concentration, density and shape factor of the dust. By error propagation these uncertainties were considered in the calculation of the specific optical cross sec-tions given in Table 1 and Table 2.
Table 1 gives σext at λ=450, 550 and 700 nm and the
corresponding Angstr¨om exponent of extinction in the 450 to 700 nm spectral region. It is obvious from Table 1 and Fig. 11 that σextand its wavelength-dependence is not very
sensitive to the type of dust. Since in case of weakly ab-sorbing mineral dust aerosol the extinction is dominated by scattering, this result reflects the comparable size distribu-tions of the different dust types in the chamber (Table 1). The wavelength-dependent specific absorption cross-section
σabsof the mineral dust aerosols were deduced from the PAS
measurements. The resulting values are given in Table 2 together with the corresponding values of the single scat-tering albedo (SSA) deduced from the PAS absorption and
Table 2. Specific absorption cross sections and single scattering albedos.
sample σabsm2g−1 SSA
266 nm 532 nm 1064 nm 266 nm 532 nm 1064 nm
Cairo 2 0.81±0.16 0.02±0.004 0.03±0.005 0.76±0.02 0.99±0.001 0.99±0.01 Morocco 1.10±0.26 0.06±0.014 0.63±0.04 0.98±0.002
SSA – single scattering albedo; σabs– specific absorption cross section
Table 3. Element analysis of desert sand samples by X-ray fluorescence analysis calculated as oxides (sd = standard deviation).
Elements as Cairo 2 Cairo 3 Agadez Morocco
oxides wt-% sd wt-% sd wt-% sd wt-% sd SiO2 55.2 0.08 62.0 0.06 79.4 0.31 70.22 0.17 Al2O3 7.7 0.01 9.4 0.01 11.5 0.06 8.37 0.01 CaO 24.3 0.05 13.9 0.01 0.7 0.01 11.47 0.02 MgO 2.9 0.03 4.7 0.04 0.4 0.00 2.26 0.01 Fe2O3 4.5 0.02 5.0 0.02 2.0 0.01 3.63 0.03 K2O 1.18 0.003 1.7 0.00 3.6 0.01 2.04 0.01 Na2O 1.1 0.18 1.1 0.01 2.2 0.13 0.52 0.02 P2O5 0.2 0.01 0.2 0.00 0.0 0.01 <0.1 TiO2 1.4 0.07 1.2 0.02 0.3 0.01 0.81 0.05 Loss of ignition 19.1 16.8 2.7 12.1
the LOPES extinction coefficients. The PAS instrument was only available for measurements with the light-coloured dust sample Cairo 2 and the reddish dust sample from Morocco. At the visible wavelength of λ=532 nm SSAs of 0.99±0.001 and 0.98±0.002 were deduced for the Cairo 2 and Morocco samples. In contrast to these relatively high SSA values in the visible, quite low values of 0.76 ±0.02 and 0.63±0.04 were found for the Cairo 2 and Morocco sample, respec-tively in the near-UV at λ=266 nm (Table 2). This strong wavelength dependence of the SSA reflects the strong wave-length dependence of the absorption coefficient resulting in Angstr¨om exponents as large as 5.3 and 4.2 for the Cairo 2 and Morocco samples, respectively. When comparing ab-sorption Angstr¨om exponents of mineral dusts which are based on a few sampling wavelengths, one has to keep in mind that the corresponding absorption spectra might have significant band structures (e.g. in case of hematite), which is in contrast to the absorption spectra of soot aerosols. For Cairo 2 σabsincreases from 0.02±0.004 m2g−1at λ=532 nm
to 0.81±0.16 m2g−1 at λ=266 nm and for Morocco from 0.06 ± 0.014 m2g−1 at λ=532 nm to 1.1±0.26 m2g−1 at
λ=266 nm. Additionally for Cairo 2 σabs was determined
at the IR-wavelength λ=1064 nm to be 0.03±0.005 m2g−1, with a SSA of 0.99±0.01.
6 Discussion
Although the elemental analysis yielded total iron oxide con-tents between 2.0 and 5.0 wt-% for all mineral dust sam-ples studied in this work, cf. Table 3, neither hematite nor goethite could be detected by XRD in the Cairo 2 and Cairo 3 samples. In case of the Agadez sample goethite is proba-bly present in a low concentration of about 0.2 wt-%. The Morocco sample is the only sample which contained a de-tectable hematite mass fraction of 0.6±0.1 wt-%. Differ-ences between the quantified total iron content detected by XRF (Table 3) and the hematite or goethite contents deter-mined by XRD could be due to difficulties of the Rietveld method associated with poor crystallographic ordering in mineral dusts. Discrepancies may also be attributed to dif-ferent sample preparation, i.e. mechanically versus manually ground samples (Weidler et al., 1998), and extraction proce-dures.
While Alfaro et al. (2004) found in their dust samples comparable total iron contents in the range of 3.0 to 6.5 wt-%, they assigned the significant amount of 2.8 to 5.8 wt-% of this iron to be present in iron oxide phases. However their iron oxide content was determined with the method by Lafon et al. (2004) as the difference between total iron and its struc-tural fraction. Strucstruc-tural fraction in this case quantifies the remaining iron content after applying an adapted reductive extraction method as commonly used in soil science (Lafon
et al., 2004). This method provides no structural information about the extractable iron and therefore cannot distinguish between the presence of goethite or hematite in the samples. For calculating SSAs and specific absorption cross sec-tions Alfaro et al. (2004) determined scattering and absorp-tion coefficients by an integrating nephelometer and a dual wavelength aethalometer. Due to light scattering by particles deposited in the filter matrix of the aethalometer the mea-sured attenuation over-estimates the particle absorption and, therefore, has to be corrected. Alfaro et al. (2004) applied a correction method by Bond et al. (1999) with two exper-imentally determined correction terms, while using the un-corrected scattering cross sections of the nephelometer. They investigated one Sahelian dust from Niger, one Saharan dust from Tunisia and one dust from China and found SSAs at
λ=660 nm of 0.95±0.01, 0.97±0.01 and 0.97±0.01 for these dusts. These values are slightly lower compared to our re-sults (Sect. 5). However, since the SSA is strongly size-dependent (Tegen et al., 1996), this difference might be due to their bimodal dust size distributions with a second mode in the super-micron size range (2.0 to 5.0 µm) in addition to the sub-micron particle mode. The values for σabsof Alfaro
et al. (2004) range between 0.12 and 0.07 m2g−1at 325 nm and between 0.02 and 0.01 m2g−1at 660 nm which is in the same order of magnitude as our results.
Retrievals of remote sensing data by Cattrall et al. (2003) from Saharan dust passages at Dry Tortugas, Florida revealed SSA values across the visible spectral range. At λ=530 nm the SSA specified by Cattrall et al. (2003) is about 0.96±0.2 in good agreement with our results. By comparing their and others retrieval results with SSA model results based on labo-ratory data of the complex refractive indices of bulk minerals they found that the remotely sensed values result in a signif-icantly weaker dust absorption than model predictions.
At the high-altitude aerosol station Jungfraujoch Coen et al. (2004) measured scattering coefficients with an in-tegrating nephelometer and absorption coefficients with an aethalometer. During Saharan dust events (SDE) they found Angstr¨om exponents of absorption of 1.5 to 1.8 between
λ=370 nm and λ=590 nm which were significantly larger than the usual Angstr¨om exponents of 1.0 to 1.2 from non-Saharan background aerosol. Reflections on the filter were corrected by an empirical correction factor, which was calcu-lated for different aerosol types by Weingartner et al. (2003). As already mentioned in the previous section the determina-tion of Angstr¨om exponents of absorpdetermina-tion for our dust sam-ples based on the PAS absorption measurements at λ=532 nm and λ=266 nm results in relatively high values between 4.2 (Morocco) and 5.3 (Cairo 2). These results indicate that there exists a significant wavelength-dependence in the UV-VIS light absorption by mineral dusts.
7 Conclusions
For the quantification of the spectral optical properties of weakly absorbing aerosols, in particular mineral dust, the presented combination of extinction spectroscopy with LOPES and absorption measurements with the multiple-wavelength PAS proved to be very useful. For two mineral aerosols we found SSA values which are comparable to val-ues observed in recent laboratory and field studies. More-over, the SSA values determined in the present study show a strong wavelength-dependence with a steep decrease from the visible to the near-UV.
The chemical and mineralogical composition of the dust samples were analysed with special regard to the iron oxide phases hematite and goethite. Although we have measured the absorption coefficients of only two mineral dust samples, these first investigations indicate that the presence of iron ox-ide phases in the dust significantly increases the absorption cross section of the mineral dust aerosol in the visible and especially in the UV. Further laboratory investigations with pure hematite and clay minerals as well as with external mix-tures of both will reveal the dependence of σabsand SSA on
iron oxide content more clearly.
The comparison of optical measurements to the chemi-cal/mineralogical analysis implies investigations on the simi-lar grain fractions. Therefore sufficient sample for the chemi-cal and mineralogichemi-cal analysis from the resuspended fraction have to be obtained. Besides the chemical and mineralogical analysis presented here, we will focus more on single particle analysis by SEM/EDX in future investigations. It will also be important to address in more detail the issue of mineralogical composition as function of the particle size.
Additionally, the PAS instrument will be improved by including another wavelength in the near-UV at λ=355 nm which allows a more reliable determination of the Angstr¨om exponent and a better comparison of our absorption data with other laboratory and field results.
Acknowledgements. This research was funded by the Helmholtz-Gemeinschaft Deutscher Forschungszentren as part of the program “Atmosphere and Climate”. The development of the PAS in-strument is partly funded by the EU project EUROCHAMP. Partial funding of the work by the Hungarian OTKA Founda-tion (TS 49872) and by the Hungarian Ministry of Economy and Transport (GVOP-3.1.1.-2004-05-0302/3.0) is gratefully acknowledged. We thank C. J¨ager and H. Mutschke (Astrophysical Institute, University of Jena), who provide the IR-Spectra of the dust samples. At Forschungszentrum Karlsruhe we thank G. Beuchle and H. Bernotat (ITC-WGT) for the XRD-analysis, C. Adelhelm (IMF I) for elemental analysis and G. Scheurig (IMK-AAF) for the SEM pictures. A special thank is addressed to K. Megahed (IMK-AAF) and L. Sch¨utz (Institute for Atmospheric Physics, University of Mainz) for providing the desert dust samples. Edited by: N. Lovejoy
References
Alfaro, S. C., Lafon, S., Rajot, J. L., Formenti, P., Gaudichet, A. and Maille, M.: Iron oxides and light absorption by pure desert dust: An experimental study, J. Geophys. Res.-Atmos., 109(D8), D08208, doi:10.1029/2003JD004374, 2004.
Andreae, M. O.: Climate effects of changing atmospheric aerosol levels, in: World Survey of Climatology, 16, Future Climate of the World, edited by: Hendersson-Sellers, A., 341–392, Elsevier Sci, New York, 1995.
Baron, P. A. and Willeke, K.: Aerosol Measurement, Wiley, New York, 2001.
Bond, T. C., Anderson, T. L., and Campbell, D.: Calibration and intercomparison of filter-based measurements of visible light ab-sorption by aerosols, Aerosol Sci. Technol., 30 (6), 582–600, 1999.
Cattrall, C., Carder, K. L., and Gordon, H. R.: Columnar aerosol single-scattering albedo and phase function retrieved from sky radiance over the ocean: Measurements of Saharan dust, J. Geo-phys. Res.-Atmos., 108(D9), 4287, doi:10.1029/2002JD002497, 2003.
Coen, M. C., Weingartner, E., Schaub, D., Hueglin, C., Corrigan, C., Henning, S., Schwikowski, M., and Baltensperger, U.: Sa-haran dust events at the Jungfraujoch: detection by wavelength dependence of the single scattering albedo and first climatology analysis, Atmos. Chem. Phys., 4, 2465–2480, 2004,
http://www.atmos-chem-phys.net/4/2465/2004/.
Lafon, S., Rajot, J. L., Alfaro, S. C., and Gaudichet, A.: Quantifi-cation of iron oxides in desert aerosol, Atmos Environ, 38(8), 1211–1218, 2004.
Schnaiter, M., Gimmler, M., Llamas, I., Linke, C., J¨ager, C., and Mutschke, H.: Strong spectral dependence of light absorption by organic carbon particles formed by propane combustion, Atmos. Chem. Phys., 6, 2981–2990, 2006,
http://www.atmos-chem-phys.net/6/2981/2006/.
Schnaiter, M., Schmid, O., Petzold, A., Fritzsche, L., Klein, K. F., Andreae, M. O., Helas, G., Thielmann, A., Gimmler, M., Mohler, O. M., Linke, C., and Schurath, U.: Measurement of wavelength-resolved light absorption by aerosols utilizing a UV-VIS extinc-tion cell, Aerosol Sci. Tech., 39(3), 249–260, 2005.
Sokolik, I. N. and Toon, O. B.: Incorporation of mineralogical com-position into models of the radiative properties of mineral aerosol from UV to IR wavelengths, J. Geophys. Res.-Atmos., 104. (D8), 9423–9444, 1999.
Sugimoto, T., Muramatsu, A., Sakata, K., and Shindo, D.: Char-acterization of Hematite Particles of Different Shapes, J. Colloid Interface Sci., 158(2), 420–428, 1993.
Tegen, I., Lacis, A. A., and Fung, I.: The influence on climate forc-ing of mineral aerosols from disturbed soils, Nature, 380(6573), 419–422, 1996.
Veres, A. H., Sarlos, F., Varga, A., Szabo, G., Bozoki, Z., Motika, G., and Gyapjas, J.: Nd : YAG laser-based photoacoustic detec-tion of ozone: Comparison of pulsed and quasicontinuous wave operation and field tests, Spectroscopy Letters, 38(3), 377–388, 2005.
Voigt, S., Orphal, J., Bogumil, K, and Burrows, J. P.: The temper-ature dependence (203-293 K) of the absorption cross sections of O-3 in the 230-850 nm region measured by Fourier-transform spectroscopy, J. Photochem. Photobiol. A, 143(1), 1–9, 2001. Voigt, S., Orphal, J., and Burrows, J. P.: The temperature and
pressure dependence of the absorption cross-sections of NO2 in the 250–800 nm region measured by Fourier-transform spec-troscopy, J. Photochem. Photobiol. A, 149 (1–3), 1–7, 2002. Weidler, P. G., Luster, J., Schneider, J., Sticher, H., and Gehring, A.
U.: The Rietveld method applied to the quantitative mineralog-ical and chemmineralog-ical analysis of a ferralitic soil, Eur. J. Soil Sci., 49(1), 95–105, 1998.
Weingartner, E., Saathoff, H., Schnaiter, M., Streit, N., Bitnar, B., and Baltensperger, U.: Absorption of light by soot particles: de-termination of the absorption coefficient by means of aethalome-ters, J. Aerosol Sci., 34(10), 1445–1463, 2003.