HAL Id: hal-00300993
https://hal.archives-ouvertes.fr/hal-00300993
Submitted on 20 Nov 2002HAL is a multi-disciplinary open access
archive for the deposit and dissemination of sci-entific research documents, whether they are pub-lished or not. The documents may come from teaching and research institutions in France or abroad, or from public or private research centers.
L’archive ouverte pluridisciplinaire HAL, est destinée au dépôt et à la diffusion de documents scientifiques de niveau recherche, publiés ou non, émanant des établissements d’enseignement et de recherche français ou étrangers, des laboratoires publics ou privés.
Chemical mass balance of size-segregated atmospheric
aerosol in an urban area of the Po Valley, Italy
E. Matta, M. C. Facchini, S. Decesari, M. Mircea, F. Cavalli, S. Fuzzi, J.-P.
Putaud, A. Dell’Acqua
To cite this version:
E. Matta, M. C. Facchini, S. Decesari, M. Mircea, F. Cavalli, et al.. Chemical mass balance of size-segregated atmospheric aerosol in an urban area of the Po Valley, Italy. Atmospheric Chemistry and Physics Discussions, European Geosciences Union, 2002, 2 (6), pp.2167-2208. �hal-00300993�
ACPD
2, 2167–2208, 2002 Chemical mass balance of size-segregated aerosol E. Matta et al. Title Page Abstract Introduction Conclusions References Tables Figures J I J I Back Close Full Screen / EscPrint Version Interactive Discussion
c
EGU 2002
Atmos. Chem. Phys. Discuss., 2, 2167–2208, 2002 www.atmos-chem-phys.org/acpd/2/2167/
c
European Geosciences Union 2002
Atmospheric Chemistry and Physics Discussions
Chemical mass balance of
size-segregated atmospheric aerosol in
an urban area of the Po Valley, Italy
E. Matta1, M. C. Facchini1, S. Decesari1, M. Mircea1, F. Cavalli1, S. Fuzzi1, J.-P. Putaud2, and A. Dell’Acqua2
1
Istituto di Scienze dell’Atmosfera e del Clima – Consiglio Nazionale delle Ricerche – Via Gobetti 101, 40129 Bologna, Italy
2
European Commission, Joint Research Centre – Institute of Environment and Sustainability, Climate Change Unit – 21020 Ispra, Italy
Received: 18 July 2002 – Accepted: 23 August 2002 – Published: 20 November 2002 Correspondence to: S. Fuzzi (s.fuzzi@isac.cnr.it)
ACPD
2, 2167–2208, 2002 Chemical mass balance of size-segregated aerosol E. Matta et al. Title Page Abstract Introduction Conclusions References Tables Figures J I J I Back Close Full Screen / EscPrint Version Interactive Discussion
c
EGU 2002
Abstract
A complete size segregated chemical characterisation was carried out for aerosol sam-ples collected in the urban area of Bologna over a period of one year, using five-stage low pressure Berner impactors. An original dual-substrate technique was adopted to obtain samples suitable for a complete chemical characterisation. Total mass, inor-5
ganic, and organic components were analysed as a function of size, and a detailed characterisation of the water soluble organic compounds was also performed by means of a previously developed methodology, based on HPLC separation of organic com-pounds according to their acid character and functional group analysis by Proton Nu-clear Magnetic Resonance. Chemical mass closure of the collected samples was 10
reached to within a few percent on average in the submicron aerosol range, while a higher unknown fraction in the coarse aerosol range was attributed to soil-derived species not analysed in this experiment. Comparison of the functional group analysis results with model results simulating water soluble organic compound production by gas-to-particle conversion of anthropogenic VOCs showed that this pathway provides 15
a minor contribution to the organic composition of the aerosol samples in the urban area of Bologna.
1. Introduction
Atmospheric aerosol particles play an important role in the atmosphere for several reasons. They transport material through the atmosphere, affect the optical properties 20
of the atmosphere, serve as condensation nuclei for the formation of clouds, and also take part in chemical reactions in the atmosphere.
All these processes involving atmospheric aerosols depend on the size and chemical composition of the particles themselves. Thus, efforts have been made over the years to elucidate the chemical composition of atmospheric aerosols as a function of size, 25
ACPD
2, 2167–2208, 2002 Chemical mass balance of size-segregated aerosol E. Matta et al. Title Page Abstract Introduction Conclusions References Tables Figures J I J I Back Close Full Screen / EscPrint Version Interactive Discussion
c
EGU 2002
of chemical composition, for the whole mass of aerosol collected. This is by no means a trivial task, as can be seen from the results of the few investigations reported in literature on the issue (Heintzenberg, 1998; Neususs et al., 2000; Putaud et al., 2000; Temesi et al., 2001). The elucidation of the organic component of the aerosol has been the most difficult task so far in achieving chemical mass closure.
5
Until recently, knowledge on the chemical composition of aerosols was restricted to the inorganic component, while little was known on the composition of their organic fraction (see Jacobson et al., 2000, for a review on organic atmospheric aerosols). To date, we know that organic compounds constitute a substantial fraction of the aerosol mass, up to 70%, especially in the submicron size range (Saxena and Hildemann, 10
1996; Jacobson et al., 2000). The total amount of organic carbon (OC) within aerosol is usually determined by Evolved Gas Analysis (EGA) whereby heating the sample causes the evolution of the organic compounds, oxidised to CO2, which is then mea-sured (Cadle et al., 1980; Huntzicker et al., 1982; Novakov et al., 1997; Cachier et al., 1989; Chow et al., 1993; Putaud et al., 2000). After quantification of aerosol OC, the 15
traditional analytical approach to OC speciation has usually been the solvent extraction of collected aerosol particles, followed by Gas Chromatography-Mass Spectroscopy (GC-MS) analysis for individual compound speciation. In spite of the large number of compounds detected (sometime several hundreds), on average less than 10% of fine aerosol OC mass has been attributed to specific compounds by this procedure (see 20
e.g. Rogge et al., 1993).
In a previous work (Decesari et al., 2001), we specifically addressed the seasonal trend of water soluble organic aerosol in the Po Valley, an area in northern Italy affected by strong anthropogenic activities, employing a new procedure based on functional group analysis which is able to account for 80–90% of the water soluble organic com-25
pound mass (Decesari et al., 2000). In the present paper, we extend our study to the size segregated composition of aerosols, and to the possibility of closing the chemical mass balance of the aerosol in the different size fractions.
ACPD
2, 2167–2208, 2002 Chemical mass balance of size-segregated aerosol E. Matta et al. Title Page Abstract Introduction Conclusions References Tables Figures J I J I Back Close Full Screen / EscPrint Version Interactive Discussion c EGU 2002 2. Experimental part 2.1. Aerosol sampling
The sampling was carried out on the roof of the ISAC Institute building at ca. 18 m height above the ground. The Institute is located in the northern outskirts of the city of Bologna, ca. 3.5 km from the city centre.
5
Sampling was performed using an 80 l min−1 five-stage Berner cascade impactor (LPI 80/0.05) in the following size ranges: (1) 0.05–0.14 µm; (2) 0.14–0.42 µm; (3) 0.42–1.2 µm; (4) 1.2–3.5 µm; (5) 3.5–10 µm. The sampling period lasted for the whole the year 2000. Thirty-four 8-hour samples were collected during this period.
Since the different analytical techniques employed for the aerosol characterisation 10
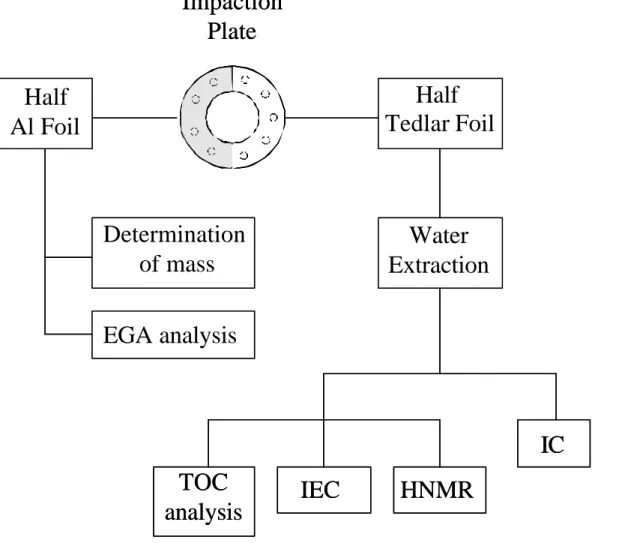
are not compatible with any individual sampling substrate, two impactors would nor-mally have been required for this experiment. Instead, we employed a single impactor with a double tedlar/aluminium sampling substrate (Fig. 1). The impactor plate sub-strate consisted of half a tedlar foil on top of an aluminium foil. On the (half) minium substrate, total aerosol mass was measured by weighing. In fact, the alu-15
minium substrate can be easily conditioned and weighed with an accuracy of 2 µg, which is not possible with the tedlar substrate due to electrostatic charges. Aerosol to-tal carbon/organic carbon (TC/OC) can also be measured by EGA using the aluminium substrate. On the (half) tedlar substrate, the whole water-soluble aerosol material, inorganic ions and water soluble organic carbon (WSOC), was analysed. The tedlar 20
substrate, in fact, can easily be pre-cleaned, and exhibits very low blank values for both inorganic and organic analyses.
2.2. Sample handling
Prior to sampling, aluminium foils were pre-fired at 500◦C for 4 h. Tedlar foils were cleaned several times with Milli-Q water, sonicated for 30 min, rinsed again with Milli-Q 25
reduc-ACPD
2, 2167–2208, 2002 Chemical mass balance of size-segregated aerosol E. Matta et al. Title Page Abstract Introduction Conclusions References Tables Figures J I J I Back Close Full Screen / EscPrint Version Interactive Discussion
c
EGU 2002
tion of the blank values for both inorganic and organic analyses. For a mean sample volume of 40 m3, blank values lower than 5 ng m−3were reached for all inorganic ions, except for Ca2+ (30 ng m−3), NO−3 and SO2−4 (20 ng m−3); blanks for TC and OC were ca. 280 ngC m−3, whereas WSOC blanks were ca. 120 ngC m−3. After sampling the foils were stored at 0◦C in Petri dishes until the analysis.
5
Aluminium foils were weighed with a microbalance (Sartorius, MC5) at 23 ± 1◦C and 19 ± 3% RH before and after sampling. The weighing precision was ±2 µg and the standard variation of the aluminium blank foils was ±10 µg (n= 5).
Extraction of tedlar foils was performed with 6 mL of Milli-Q Organex water in an ultrasonic bath. Aliquots of the extracts were used to perform the following analyses: 10
inorganic ions, total dissolved organic carbon and speciation of water-soluble organic compound into its main classes of species (Fig. 1).
2.3. Total carbon and organic carbon analysis
TC/OC analyses of the aerosol samples were performed on a small portion of the alu-minium foil by evolved gas analysis (EGA). With this technique, samples are subjected 15
to five increasing temperature plateaus up to 650◦C in an oxygen-free carrier gas, and then in an oxygen-rich carrier gas at 650–750◦C (Putaud et al., 2000). The evolved carbon-containing gases are converted to CO2 and measured by a non-dispersive in-frared (NDIR) analyser. The carbon evolving at T < 650◦C in the oxygen-free carrier gas is defined as OC, while the fraction evolving at T > 650◦C in the oxidizing car-20
rier gas is expected to be black carbon (BC). Artefacts due to charring occurred when analysing the samples collected on aluminium foils using the above routine method. Previous intercomparisons showed that the accuracy in TC determination is better than 20%. Due to basic differences among thermal methods adopted by different authors to split OC and BC, and to prevent or correct charring, the accuracy in BC determina-25
tion was estimated to be ca. 60%. The charring effect was assessed for 33 samples, representative of all size ranges and seasons, by comparing the BC amount obtained
ACPD
2, 2167–2208, 2002 Chemical mass balance of size-segregated aerosol E. Matta et al. Title Page Abstract Introduction Conclusions References Tables Figures J I J I Back Close Full Screen / EscPrint Version Interactive Discussion
c
EGU 2002
with the above method with the values obtained from analysis of an aliquot of sam-ple exposed to an oxidising carrier gas at 340◦C for 2 h, which eliminates OC com-pounds responsible for charring (Cachier et al., 1989). Over these 33 samples, the ratio BCtreated/BCroutine was 0.69 ± 0.07 (95% confidence level). This regression was used to correct for charring artefacts the amount of BC in the samples analysed within 5
the present work.
2.4. Analysis of inorganic ions
The concentration of inorganic ions (NH+4, Na+, K+, Ca2+, Mg2+, Cl−, NO−3, SO2−4 ) was determined by ion chromatography (IC) in an aliquot of the tedlar foil water extract (Fuzzi et al., 1998). The detection limits of the IC analyses are well below the blank 10
values of the filter substrates reported above, and should therefore be considered as the operational detection limits within this study. The accuracy of IC measurements was better than 5%.
2.5. Total water soluble organic carbon content
Another aliquot of the tedlar foil water extract was used to determine the water soluble 15
organic carbon content of the samples, using a Shimadzu TOC-5000A liquid analyser. The detector response was calibrated with standard solutions of potassium hydrogen phthalate. Also in this case, the operational detection limit of the measurements should coincide with the blank values of the sampling substrate. The accuracy of the mea-surements ranges from 7% for 1 ppmC solution to 3% for concentrations higher than 2 20
ppmC. Since no distinction between water soluble organic carbon and inorganic carbon has been made in our measurements, carbonate is included in the total water soluble organic carbon content.
ACPD
2, 2167–2208, 2002 Chemical mass balance of size-segregated aerosol E. Matta et al. Title Page Abstract Introduction Conclusions References Tables Figures J I J I Back Close Full Screen / EscPrint Version Interactive Discussion
c
EGU 2002
2.6. Water soluble organic compounds characterisation
Aerosol water soluble organic compounds were characterised by adopting the pro-cedure proposed by Decesari et al. (2000), based on a combination of ion exchange chromatography (IEC), functional group investigation by Proton Nuclear Magnetic Res-onance (HNMR) and total organic carbon (TOC) determination. According to this pro-5
cedure, the complex mixture of water soluble organic compounds was separated by IEC into three main classes of compounds: (a) neutral compounds; (b) mono- and di-carboxylic acids; (c) polycarboxylic acids. HNMR spectroscopy was employed to analyse a single size-segregated aerosol sample, collected on 29 November. Spectra of the extracts of the five stage samples in D2O solution were acquired in a 5 mm probe 10
using a Varian Mercury 400 spectrometer. Details on the experimental conditions can be found in Decesari et al. (2000).
3. Results and discussion
Figure 2 reports the total aerosol mass concentration, obtained by adding the mea-sured mass of the 5 stages, for the whole sample set, superimposed on the daily-15
averaged PM10 measurements performed by the Regional Environmental Agency at a measuring site located in the town centre, ca. 3 km from our sampling site and at street level. The two sets of measurements follow the same temporal pattern, with higher concentrations in the fall-winter period and lower ones during spring-summer. In principle, given the upper size cut of the impactor, the two sets of data should coin-20
cide, but the impactor mass concentration values are on average 40% lower than the PM10 network measurements. This difference could be explained by the more periph-eral location of our sampling site and the different sampling heights above ground. In addition, the PM10network measurements represent daily samples, while our samples are collected over an 8-hour period during the day.
25
ACPD
2, 2167–2208, 2002 Chemical mass balance of size-segregated aerosol E. Matta et al. Title Page Abstract Introduction Conclusions References Tables Figures J I J I Back Close Full Screen / EscPrint Version Interactive Discussion
c
EGU 2002
and that of the 1998–99 period examined in our previous study, albeit in a different location of the Po Valley (Decesari et al., 2001). Therefore, for the purpose of the present data analysis, we divided the acquired data set into two sub-sets: (i) fall-winter period (hereinafter FW, January–March and 15 October–31 December, 25 samples), when PM10concentrations are higher, mostly above 50 µg m−3, and (ii) spring-summer 5
period (hereinafter SS, 1 April–14 October, 9 samples), when PM10concentrations are generally lower than this value. Four FW samples had a much lower mass concentra-tion with respect to the average of the period, due to a rain event before sampling, and were excluded from the statistical analysis below. Unfortunately, for technical reasons, no samples were collected during the present experiment over the warmest period of 10
June to mid-August. 3.1. Bulk results
In order to provide a general insight into the aerosol composition and its temporal trend, we present bulk results obtained by summing the air concentration data from each impactor stage. Minimum, median and maximum bulk concentrations for the analysed 15
species and total aerosol weighed mass are reported in Table 1.
Carbon analyses performed on both aluminium and tedlar foils, as described in de-tail in the experimental part, provided total carbon concentrations (TC), apportioned between OC (organic carbon), BC (black carbon) and WSOC concentrations.
Insoluble organic carbon concentrations were determined in previous studies by sub-20
tracting WSOC from OC, under the assumption of completely insoluble BC. However, there is now evidence that a portion of BC is water-extractable and therefore can be included in the WSOC fraction (Mayol-Bracero et al., 2002; Gelencs ´er et al., 2000). The observed partial solubility of BC would lead to an underestimation of the insoluble organic carbon following the above calculation. Here, we determine a water-insoluble 25
carbon fraction (WINC) by subtracting WSOC directly from TC (WINC= TC − WSOC). In order to include the carbonaceous species in the aerosol mass budget, conver-sion factors for deriving molecular mass from carbon mass are required (Turpin et al.,
ACPD
2, 2167–2208, 2002 Chemical mass balance of size-segregated aerosol E. Matta et al. Title Page Abstract Introduction Conclusions References Tables Figures J I J I Back Close Full Screen / EscPrint Version Interactive Discussion
c
EGU 2002
2000). Here we propose two distinct factors for WINC and WSOC, respectively 1.2 and 1.8, to take into account the strict dependence of molecular formulas on the polarity of substances. The value adopted for WINC is derived from literature data for insol-uble organic compounds (Zappoli et al., 1999). Conversely, the conversion factor for WSOC is based on their chemical characterisation in the real samples (see Sect. 3.4). 5
Indeed, the chemical procedure for WSOC employed in this study allowed us to obtain an average composition of the water-soluble organic fraction, providing quantitative information on the concentrations of carbon, hydrogen and (indirectly) heteroatoms.
Total aerosol mass ranges from 10 to 142 µg m−3, with the highest values observed during the FW period. The maximum aerosol mass concentrations are observed on 1 10
and 15 February in stable weather conditions. Weather charts confirm that on those days the air mass did not change for more than 48 h.
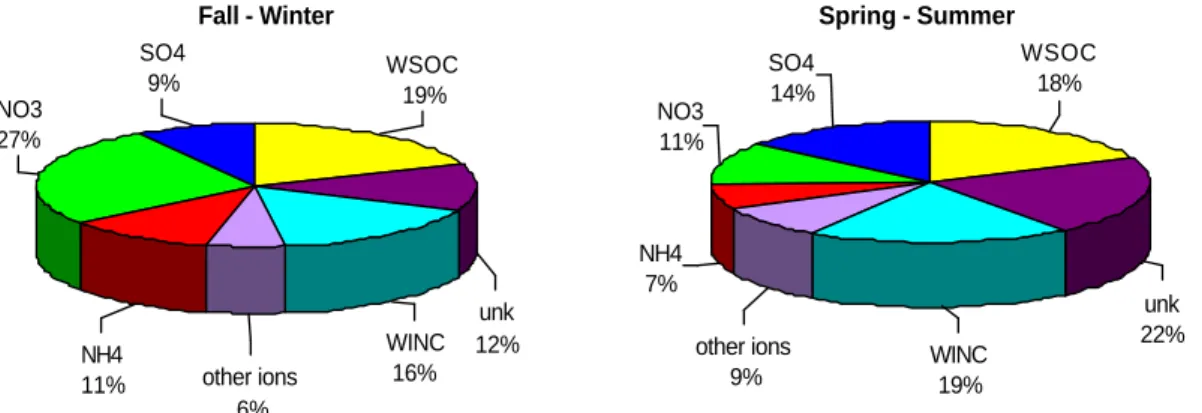
The main fraction of the aerosol mass is comprised of inorganic species (53% in FW and 41% in SS), with ammonium, nitrate and sulphate together accounting for more than 80% (81% in SS and 91% in FW, on average) of the ionic content. The 15
percentage amount of TC is similar in the two periods (35% in FW, 37% in SS) and a significant fraction of it is represented by WSOC (on average 50% of TC). The non-analysed mass (“unknown”), calculated as the difference between the weighed aerosol mass and the total mass of the analysed species, represents a relatively small fraction of the total weighed mass: 12% in FW and 22% in SS (Fig. 3).
20
3.2. Size-segregated results 3.2.1. Mass concentration
A statistical summary of mass concentration in the different size ranges is reported in Table 2a. Aerosol median mass concentrations are higher in FW than in SS in all size ranges. In both periods, the maximum value is observed at stage 3 (23.45 µg m−3 – 25
FW; 5.80 µg m−3 – SS) and the minimum at stage 1 (3.40 µg,m−3 – FW; 1.76 µg m−3 - SS). In all samples, the greater part of total aerosol mass (62%) is distributed in the
ACPD
2, 2167–2208, 2002 Chemical mass balance of size-segregated aerosol E. Matta et al. Title Page Abstract Introduction Conclusions References Tables Figures J I J I Back Close Full Screen / EscPrint Version Interactive Discussion
c
EGU 2002
fine size range (stages 1–3). Aerosol size distributions observed during the FW period were bimodal or monomodal centred on the 3rd stage. This difference in mass size distribution is apparently dependent on the aerosol air concentration: a distinct coarse mode is observed at PM10 concentrations up to 40 µg m−3, whereas size distributions showing the accumulation mode alone are encountered at higher aerosol loads (Fig. 4). 5
It follows that pollution events tend to increase the fine particle mass with respect to that of coarse particles. By contrast, the relative contribution of the coarse particles to the total aerosol mass is higher under cleaner conditions. Samples collected during the SS season showed more heterogeneous size distributions: bimodal and monomodal centred either at the 3rd or 5th stage. On average, the fraction of coarse particles mass 10
to total mass (0.44 ± 0.08) is higher than in the cold period (0.30 ± 0.08). Moreover, the coarse mode is dominant on the accumulation mode, even at the highest aerosol air concentrations measured for the period (36 µg m−3; 22 August).
A bimodal distribution has already been determined in the European boundary layer at a rural site in Hungary, with a 13 stage low-pressure impactor (Temesi et al., 2001). 15
However, Neus ¨uss et al. (2000) measured a monomodal distribution in the Leipzig Basin, Germany, using a five-stage Berner impactor. In the same region, Heintzenberg et al. (1998) measured the aerosol mass distribution with a high-resolution apparatus (TDMPS and APS spectrometers), finding a bimodal distribution with a prevalent mode at 0.36 µm (accumulation mode), and a smaller coarse mode at 2.5 µm. It is doubtful 20
that the five stage Berner impactor may resolve the coarse mode under these con-ditions (small geometric mean diameter and low concentration), thus resulting in an apparent monomodal mass distribution. Therefore, also the monomodal distribution observed in Bologna by means of the five-stage impactor cannot exclude the occur-rence of a small coarse mode.
25
The studies cited above also tentatively established a relationship between the mass size distribution and the origin of the air masses. In the present study, the different meteorological conditions encountered during the SS period could not be well repre-sented by the 8 samples for which a complete mass size distribution was obtained.
ACPD
2, 2167–2208, 2002 Chemical mass balance of size-segregated aerosol E. Matta et al. Title Page Abstract Introduction Conclusions References Tables Figures J I J I Back Close Full Screen / EscPrint Version Interactive Discussion
c
EGU 2002
On the contrary, the samples from the FW season discussed above are representative for stable conditions associated with weak surface circulation or short-range transport from central Europe.
3.2.2. Chemical composition
Minimum, median and maximum air concentrations for the analysed species as a func-5
tion of impactor stages are presented in Tables 2b–d.
As depicted in Figs. 5 and 6, inorganic species show quite a different trend of median mass concentration in the two periods. In FW, their concentration greatly increases from stage 1 (1.12 µg m−3) to stage 3 (13.16 µg m−3), when inorganic species account for 60% of the total mass, and then decreases to a minimum at stage 5 (1.94 µg m−3). 10
In SS, inorganic median concentrations show a more homogeneous distribution among the different stages, with very low values (0.57 µg m−3) at stage 1 and comparable values at stages 2–3 and 4–5. As for the distribution of inorganic species, WSOC and WINC median mass concentrations exhibit in FW a pronounced peak at stage 3 (4.40 µg m−3– WSOC; 3.25 µg m−3WINC), while in SS comparable concentrations are 15
found at stages 2–3 and 4–5 (Figs. 5 and 6).
A larger contribution of carbonaceous species to the aerosol mass is observed in the submicron size range. In fact, as shown in Figs. 5 and 6, the percentage of WSOC and WINC decreases linearly from stage 1 to stage 5. On the contrary, inorganic compounds do not exhibit such a linear trend and their contribution to the total mass 20
reaches the maximum value at stages 2 and 3.
Figures 5 and 6 also show that the unknown fraction has a similar trend in both periods, strongly dependent on particle size. The unknown fraction accounts for a few percent of the total mass in the fine aerosol size range (stages 1–3), where mass balance is practically achieved (0.62 µg m−3 in both periods, corresponding to 2% of 25
the total mass in FW and 6% in SS); higher percentages of unknown species are found in the coarse aerosol fraction (5.89 µg m−3, ca. 32% of the total mass in FW and 3.51 µg m−3, ca. 49% in SS). The increase of the unknown fraction with particle size is
ACPD
2, 2167–2208, 2002 Chemical mass balance of size-segregated aerosol E. Matta et al. Title Page Abstract Introduction Conclusions References Tables Figures J I J I Back Close Full Screen / EscPrint Version Interactive Discussion
c
EGU 2002
due to soil-derived insoluble species not determined in this study. A similar trend has already been reported in other continental areas by Neus ¨uss et al. (2000), Temesi et al. (2001) and Kerminen et al. (2001).
For each impactor stage, the ion balance was also evaluated (Fig. 7). Cation-to-anion ratios, calculated in µeq m−3, can be used to test the acidity of aerosol particles. The 5
ion balance does not take into account the H+ concentration, since pH was not mea-sured in our samples. Therefore, cation-to-anion ratios below unity are indicative of an acidic nature of the collected particles, while cation-to-anion ratios above unity indicate the presence of anions not revealed by our analysis. Values around unity (0.99–1.07) were generally found for particles in the fine size range, regardless of season. Val-10
ues above unity (1.2–1.55) were instead observed for particles in the supermicron size range, which can be related to the presence of carbonates and other soil-derived al-kaline compounds (Fig. 7). This is consistent with the mass closure results and with the higher contribution of the unknown species to the coarse aerosol fraction. In the following discussion, the trend of inorganic ions and carbonaceous compounds will be 15
reported, with reference to their median concentrations.
In both periods, inorganic ions represent a substantial part of the total mass, ranging between 30% and 60%, depending on the stage. The main inorganic species are NH+4, NO−3 and SO2−4 (Fig. 8 and Table 2b), which together account for more than 90% of the total inorganic ionic content of the fine aerosol fraction and ca. 65% of the coarse 20
fraction. The median concentrations of inorganic species are higher during the FW period at all stages. Minima are observed at stages 1 and 5, and maxima at stage 3. However, concentrations at stages 2 and 3 are comparable in the SS period. Nitrate is the main inorganic component in FW and is preferentially distributed in the fine size range (77%). However, nitrate shows lower concentrations in SS and is mainly found 25
(70%) in the coarse fraction (stages 4 and 5).
Minor inorganic components are Na+, K+, Mg2+, Ca2+ and Cl− (Fig. 9 – Table 2d). Their contribution to total mass is lower than 5%. Na+, Mg2+and Ca2+are preferentially distributed in the coarse size range and show similar concentration at all stages in both
ACPD
2, 2167–2208, 2002 Chemical mass balance of size-segregated aerosol E. Matta et al. Title Page Abstract Introduction Conclusions References Tables Figures J I J I Back Close Full Screen / EscPrint Version Interactive Discussion
c
EGU 2002
periods. The Cl− concentrations are higher in the FW period, with maxima at stage 3 and minima at stage 1, while in the SS period most of the Cl− mass is found in the coarse fraction. K+ shows higher concentrations in the fine fraction in the FW period, indicating possible biomass combustion sources.
Table 2c reports TC, BC, WINC and WSOC minimum, median and maximum concen-5
trations. As already observed, all carbonaceous species are preferentially distributed in the fine aerosol fraction. Figure 10 shows that TC, BC, WINC and water-soluble OC have a similar trend, with minima at stage 5, maxima at stage 3 in FW, and comparable concentration at stages 2 and 3 in SS. The contribution of all carbonaceous species to the total mass decreases as particle size increases, especially for WINC (from 40% to 10
10%) and BC (from 20% to 1%).
Similar mass distributions of the main organic and inorganic compounds in the fine and coarse size ranges and similar seasonal trends have already been observed in other polluted continental areas, such as the industrialised Leipzig basin, Germany (Heintzenberg et al., 1998), Hong Kong (Zhuang et al., 1999) and Chicago (Offenberg 15
et al., 2000).
It should also be noted that the composition of fine particles in Bologna, in terms of air concentrations and seasonal trends is consistent with that observed at S. Pietro Capofi-ume, a rural site ca. 40 km from the city (Zappoli et al., 1999; Decesari et al., 2000). This observation suggests that formation, growth, processing and removal mechanism 20
of aerosol particles occur on a regional scale in the Po Valley, due to homogeneous meteorological conditions and diffuse pollutant sources.
HPLC analysis of the aerosol extracts (Decesari et al., 2001) allowed the determina-tion of the relative composidetermina-tion of water soluble organic compounds at each impactor stage. Table 3 summarises the measured air concentrations of neutral compounds, 25
mono-/di-acids and polyacids for both FW and SS seasons. Due to the smaller amount of samples collected during the SS period, only three samples could be analysed by the HPLC technique (samples collected on 16 May, 22 and 24 August). The three separated chromatographic fractions follow the same size distribution as total WSOC
ACPD
2, 2167–2208, 2002 Chemical mass balance of size-segregated aerosol E. Matta et al. Title Page Abstract Introduction Conclusions References Tables Figures J I J I Back Close Full Screen / EscPrint Version Interactive Discussion
c
EGU 2002
(Fig. 11). Neutral compounds usually occur at lower concentrations compared to acidic ones, accounting for 15 to 40% of the sum of the three fractions. The percentage is higher during the FW season (26 to 36% on average, depending on the stages), com-pared to the three SS samples (15 to 25%). However, it should be noted that higher relative concentrations of neutral compounds are encountered only from October to 5
December, whereas from January to March concentrations of neutral compound do not differ significantly from the SS case. This is in agreement with the unique pat-tern observed during the fall season at the San Pietro Capofiume station (Decesari et al., 2001). The acidic compounds contain mono/di-acids and polyacids in comparable amounts, but the former are systematically dominant throughout the year, accounting 10
for 60 to 70% of the total acidic compounds, with the higher percent contribution in the coarse stages.
3.3. Functional group analysis of the water soluble organic compounds
Figure 12 shows the HNMR spectra of the five impactor stages of a sample collected in November 2000 in polluted conditions (total mass = 55 µg m−3). Individual water 15
soluble organic compounds were identified, based on their chemical shift (Decesari et al., 2000, 2001). The most important compound identified is levoglucosan, accounting for the sharp peaks between 3.3 and 5.4 ppm as marked in the figure. Levoglucosan is detectable for particle sizes up to 3.5 µm, and is enriched in the 0.42–1.2 µm in-terval. Levoglucosan is an unambiguous tracer of cellulose combustion and, due to 20
its chemical stability, can accumulate onto fine particles and be transported over long distances (Simoneit et al., 1999). Biogenic WSOC were identified in all size-fractions on the basis of the chemical shifts (δH) reported by Suzuki et al. (2001) and Decesari et al. (2001): trimethylamine (δH = 2.90); methansulfonate (δH = 2.81) and dimethy-lamine (δH = 2.72). A number of sources, both natural and anthropogenic, may pro-25
duce other identified WSOC (acetic acid, formic acid, succinic acid). Most HNMR signals could not be resolved and attributed to individual compounds, allowing only for a more general characterization based on functional group analyses. The main
ACPD
2, 2167–2208, 2002 Chemical mass balance of size-segregated aerosol E. Matta et al. Title Page Abstract Introduction Conclusions References Tables Figures J I J I Back Close Full Screen / EscPrint Version Interactive Discussion
c
EGU 2002
functional groups identified can be divided into four categories: H-Ar, aromatic rings; H-C-O, aliphatic alcohols and ethers; H-C-C=, aliphatic groups bound to unsaturated structures; H-C, purely aliphatic groups. The relative composition of WSOC with re-spect to the above functional groups shows minor variations for particle sizes up to 3.5 µm, whereas the coarsest size-interval is enriched in purely aliphatic moieties and 5
is less aromatic. This is in agreement with the HNMR data from the size-segregated urban aerosol samples from Kobe City (Suzuki et al., 2001).
3.4. Functional group analysis and structural properties of water soluble organic com-pounds
Fuzzi et al. (2001) showed that functional group analysis performed by HNMR can be 10
used to determine the general structural properties of aerosol organic compounds. Following the same approach, the concentration of functional groups determined by HNMR in the test sample was used to convert their hydrogen content, quantitatively determined by the HNMR analysis, into the corresponding carbon content, based on specific theoretical C/H molar ratios. Table 4 summarises the functional group air con-15
centration of H and C, where the aromatic moieties were calculated by difference (Fuzzi et al., 2001). Ketones and carboxylic acids, unlike what was done in Fuzzi et al. (2001), were estimated here as a whole, considering a C/H molar ratio of 0.38 (0.2–1.0) be-tween the carbon atoms of C=O groups and their alpha hydrogen atoms. It is notice-able that the aromatic moieties account for only a few percentages of the total hydro-20
gen content, but up to 50% of TOC, indicating that aromatic rings are highly condensed and/or substituted.
The representation of the composition of water soluble organic compounds as a simple budget of functional groups, each characterised by an average structure and molar mass, allows us to derive general structural properties for these compounds, 25
such as the mass/carbon ratio. The assumptions made to assign an average mo-lar mass to each functional group are the same used for estimating the C/H ratios (Fuzzi et al., 2001). In addition, carboxylic and hydroxyl substituents are considered
ACPD
2, 2167–2208, 2002 Chemical mass balance of size-segregated aerosol E. Matta et al. Title Page Abstract Introduction Conclusions References Tables Figures J I J I Back Close Full Screen / EscPrint Version Interactive Discussion
c
EGU 2002
to occur on aromatic rings, as expected by the observed range of chemical shifts for Ar-H (Decesari et al., 2000). Residual uncertainty associated with the molar mass of aromatic groups and carbonyls (comprising ketons and carboxylic groups) makes the mass/carbon ratio for WSOC vary from 1.7 to 2.3. An average organic mass vs. carbon ratio of 1.8 was used to transform the WSOC carbon content into the corresponding 5
mass (see Sect. 3.1). The same ratio was used by Temesi et al. (2001), whereas Turpin et al. (2000) proposed higher values for the water soluble organic compounds, implying a more pronounced polar character of the constituents. On the other hand, the HNMR analysis of sample 291100 clearly indicates that compounds bearing purely aliphatic moieties (H-C groups) account for a significant fraction of total water soluble organic 10
compounds, even if more polar compounds, such as C2-C5- dicarboxylic acids, are the most common species identified in the aerosol soluble fraction and reported in litera-ture (see e.g. Kerminen et al., 2000).
As mentioned above, water soluble organic compounds are not characterised at the molecular level in this paper. Thus no information is available on their possible 15
sources and transformations in the atmosphere. However, the average chemical fea-tures provided by HNMR can be compared with the predictions of models of water solu-ble organic compound formation in a polluted industrialized area. Aumont et al. (2000) modelled the water soluble organic compound production by gas-to-particle conver-sion in urban and rural environments, resulting in mean air concentrations of about 1-20
4 µgC m−3. According to the expected reaction pathways, these authors provided the functional group composition of the final mixtures of water soluble organic compounds, which can be compared directly with those derived from the present work. The mod-elled (Aumont et al., 2000) and measured (this work) water soluble organic compound functional group compositions are reported in Table 5. Organic functional group con-25
centrations are normalised to the total carbon amount (ROF/C). The data reported for the real samples only refer to aliphatic functional groups and to the total aliphatic carbon content, since an accurate aromatic functional group characterisation is not provided by HNMR. On the other hand, Aumont et al. (2000) reported only aliphatic compounds as
ACPD
2, 2167–2208, 2002 Chemical mass balance of size-segregated aerosol E. Matta et al. Title Page Abstract Introduction Conclusions References Tables Figures J I J I Back Close Full Screen / EscPrint Version Interactive Discussion
c
EGU 2002
representative for the products of gas-to-particle conversion. Moreover, aliphatic car-bonyls from HNMR (see Table 5) were split into keto- and carboxylic- groups, according to the relative concentrations of neutral versus acidic compounds for the test sample as determined by the HPLC analysis. Compared to the composition modelled by Aumont et al. (2000), the HNMR results indicate a lower degree of substitution of water soluble 5
organic compounds, and thus a lower level of oxidation. Aumont et al. (2000) reported mainly oxygenated functional groups, in agreement with our findings. The measured hydroxyl content is comparable to the modelled one; on the other hand, aldehydes are not found in the aerosols we analysed in significant concentrations (see also Dece-sari et al., 2000, 2001). Moreover, carboxylic groups, which are the main functional 10
groups present in the real aerosol sample, account for less than 1% carbon atoms in the modelled products of gas-to-particle conversion. Aumont et al. (2000) suggested that a much higher concentration of carboxylic groups (ROF/C up to 20–30%) can be expected, if further oxidation processes in wet aerosols are taken into account. The same processes would lead to the consumption of aldehydic moieties via reaction with 15
the OH radical. Unfortunately, the actual chemical composition of the end products of this reaction scheme is highly uncertain, due to the poor information available on the reactivity of water soluble organic compounds in wet aerosols. In conclusion, we can only report that the observed chemical composition of water soluble organic com-pounds in the aerosol samples from Bologna is not consistent with the hypothesis of 20
a major contribution to their concentration from gas-to-particle conversion of anthro-pogenic VOCs, unless extensive oxidative reactions in the aqueous phase of aerosols is considered, for which information is not available.
4. Conclusions
A complete size segregated chemical characterisation was carried out for aerosol sam-25
ples collected in the urban area of Bologna over a period of one year. Total mass, inorganic, and organic components were analysed and a detailed characterisation of
ACPD
2, 2167–2208, 2002 Chemical mass balance of size-segregated aerosol E. Matta et al. Title Page Abstract Introduction Conclusions References Tables Figures J I J I Back Close Full Screen / EscPrint Version Interactive Discussion
c
EGU 2002
WSOC was performed. The mass closure of the chemical species was reached with respect to the weighed mass in the submicron aerosol fraction, while a higher unknown fraction in the coarse aerosol range was attributed to soil-derived species not analysed in this experiment. The main inorganic components were ammonium, sulfate and ni-trate, the former two exhibiting concentration maxima in the FW and SS periods in the 5
fine aerosol fraction, the latter, nitrate, showing lower concentrations in SS and being mainly found (70%) in the coarse fraction (stages 4 and 5).
Carbonaceous species were preferentially distributed in the fine aerosol fraction, with relative concentrations decreasing with increasing particle size. WSOC repre-sents on average 50% of the total aerosol OC. The three main classes of compounds 10
that constitute the total WSOC (neutral species, mono- and di-carboxylic acids) follow the same size distribution as total WSOC. Neutral compounds occur at lower concen-trations compared to acidic ones in all size ranges. Mono- and di-carboxylic acids are the main organic acidic fraction, accounting for 60–70% of the total acidic compounds, with an higher percentage contribution in the coarse aerosol fraction. Full functional 15
group analysis of WSOC by HNMR for one size segregated sample allowed the de-termination of an average mass to carbon ratio of 1.8. Comparison of the functional group analysis results by HNMR to model results simulating water soluble organic com-pound production by gas-to-particle conversion of anthropogenic VOCs (Aumont et al., 2000) showed that this pathway provides a minor contribution to water soluble organic 20
compounds in the aerosol samples from the urban area of Bologna, unless oxidation in aqueous aerosol is taken into account to justify the higher carboxylic group content observed in real samples.
The procedure reported in this paper allowed a full chemical characterisation of size-segregated aerosol samples which is, to our knowledge, the most complete reported 25
in literature to date.
Acknowledgements. The Regional Environmental Agency (ARPA-ER, Sezione Provinciale di
Bologna) is acknowledged for providing the PM10data for the City of Bologna. M. Mircea was supported by ICTP Programme for Training and Research in Italian Laboratories, Trieste, Italy.
ACPD
2, 2167–2208, 2002 Chemical mass balance of size-segregated aerosol E. Matta et al. Title Page Abstract Introduction Conclusions References Tables Figures J I J I Back Close Full Screen / EscPrint Version Interactive Discussion
c
EGU 2002
References
Aumont, B., Madronich, S., Bey, I., and Tyndall, G. S.: Contribution of secondary VOC to the composition of aqueous atmospheric particles: A modelling approach. J. Atmos. Chem., 35, 59–75, 2000.
Cachier, H., Bremond, M. P., and Buat-Menard, P.: Determination of atmospheric soot carbon
5
with a simple thermal method, Tellus, 41B, 379–390, 1989.
Cadle, S., Groblicki, P. J., and Stroup, D. P.: Automated carbon analyser for particulate samples, Anal. Chem., 52, 2201–2206, 1980.
Chow, J. C., Watson, J. G., Pritchett, L. C., Pierson, W. R., Frazier, C. A., and Purcell, R. G.: The DRI thermal/optical reflectance carbon analysis system: Description, evaluation and
10
applications in U.S. air quality studies, Atmos. Environ., 27A, 1185–1201, 1993.
Decesari, S., Facchini, M. C., Fuzzi, S., and Tagliavini, E.: Characterization of water-soluble organic compounds in atmospheric aerosol: A new approach, J. Geophys. Res., 105, 1481– 1489, 2000.
Decesari, S., Facchini, M. C., Matta, E., Lettini, F., Mircea, M., Fuzzi, S., Tagliavini, E., and
15
Putaud, J.-P.: Chemical features and seasonal trend of water soluble organic compounds in the Po Valley fine aerosol, Atmos. Environ., 35, 3691–3699, 2001.
Fuzzi, S., Laj, P., Ricci, L., Orsi, G., Heintzenberg, J., Wendisch, M., Yuskiewicz, B., Orsini, D., Schwanz, M., Wiedensohler, A., Stratmann, F., Berg, O. H., Swietlicki, E., Frank, G., Martinsson, B. G., G ¨unther, A., Dierssen, J., Schell, D., Jaeschke, W., Berner, A., Dusek,
20
U., Galambos, Z., Kruisz, C., Mesfin, S. N., Wobrock, W., Arends, B., and ten Brink, H.: Overview of the Po valley fog experiment 1994 (CHEMDROP), Contrib. Atmos. Phys., 71, 3–19, 1998.
Fuzzi, S., Decesari, S., Facchini, M. C., Matta, E., Mircea, M., and Tagliavini, E.: A simplified model of the water soluble organic component of atmospheric aerosols, Geophys. Res. Lett.,
25
28, 4079–4082, 2001.
Gelencs ´er, A., Hoffer, A., Molnar, A., Krivacsy, Z., Kiss, G., and Meszaros, E.: Thermal be-haviour of carbonaceous aerosol from continental background site, Atmos. Environ., 34, 823–831, 2000.
Heintzenberg, J., M ¨uller, K., Birmili, W., Spindler, G., and Wiedensohler, A.: Mass-related
30
aerosol properties over the Leipzig basin, J. Geophys. Res., 103, D11, 13 125–13 135, 1998. Huntzicker, J. J., Johnson, R. L., Shah, J. J., and Cary, R. A.: Analysis of organic and elemental
ACPD
2, 2167–2208, 2002 Chemical mass balance of size-segregated aerosol E. Matta et al. Title Page Abstract Introduction Conclusions References Tables Figures J I J I Back Close Full Screen / EscPrint Version Interactive Discussion
c
EGU 2002
carbon in ambient aerosols by a thermal-optical method, in: Particulate Carbon: Atmospheric Life Cycle, (Eds) Wolff, G. T. and Klimisch, R. L., pp. 79–88, Plenum, New York, 1982. Jacobson, M. C., Hansson, H.-C., Noone, K. J., and Charlson, R. J.: Organic atmospheric
aerosols: Review and state of the science, Rev. Geophys., 38, 267–294, 2000.
Kerminen, V.-M., Hillamo, R., Teinila, K., Pakkanen, T., Allegrini, I., and Sparapani, R.: Ion
5
balances of size-resolved tropospheric aerosol samples: implications for the acidity and at-mospheric processing of aerosols, Atmos. Environ., 35, 5255–5265, 2001.
Mayol-Bracero, O. L., Guyon, P., Graham, B., Andreae, M. O., Decesari, S., Facchini, M. C., and Artaxo, P.: Black carbon, Organic carbon and Water-Soluble Organic Compounds in Biomass smoke particles over the Amazon Basin, J. Geophys. Res., 107, 8091, doi.:
10
10.1029/2001JD000522, 2002.
Neus ¨uss, C., Pelzing, M., Plewka, A., and Herrmann, H.: A new analytical approach for size-resolved speciation of organic compounds in atmospheric aerosol particles: methods and first results, J. Geophys. Res., 105, 4513–4527, 2000.
Novakov, T., Hegg, D. A., and Hobbs, P. V.: Airborne measurements of carbonaceous aerosols
15
on the East Coast of the United States, J. Geophys. Res., 102, D25, 30 023–30 030, 1997. Offenberg, J. H. and Baker, J. E.: Aerosol size distribution of elemental and organic carbon in
urban and over-water atmospheres, Atmos. Environ., 34, 1509–1517, 2000.
Putaud, J.-P., van Dingenen, R., Mangoni, M., Virkkula, A., Raes, F., Maring, H., Prospero, J. M., Swietlicki, E., Berg, O. H., Hillamo, R., and M ¨akel ¨a, T.: Chemical mass closure and
20
assessment of the origin of the submicron aerosol in the marine boundary layer and the free troposphere at Tenerife during ACE-2, Tellus, 52B, 141–168, 2000.
Rogge, W. F., Mazurek, M. A., Hildemann, L. M., Cass, G. R., and Simoneit, B. R. T.: Quantifi-cation of urban organic aerosols at a molecular level: IdentifiQuantifi-cation, abundance and seasonal variation, Atmos. Environ., 27A, 1309–1330, 1993.
25
Saxena, P. and Hildemann, L. M.: Water-soluble organics in atmospheric particles: A critical review of the literature and application of thermodynamics to identify candidate compounds, J. Atmos. Chem., 24, 57–109, 1996.
Simoneit, B. R. T., Schauer, J. J., Nolte, C. G., Oros, D. R., Elias, V. O., Fraser, M. P., Rogge, W. F., and Cass G. R.: Levoglucosan, a tracer for cellulose in biomass burning and atmospheric
30
particles, Atmos. Environ., 33, 173–182, 1999.
Suzuki, Y., Kawakami, M., and Akasaka, K.: 1H NMR application for characterizing water-soluble organic compounds in urban atmospheric particles, Environ. Sci. Technol., 35, 2656–
ACPD
2, 2167–2208, 2002 Chemical mass balance of size-segregated aerosol E. Matta et al. Title Page Abstract Introduction Conclusions References Tables Figures J I J I Back Close Full Screen / EscPrint Version Interactive Discussion
c
EGU 2002
2664, 2001.
Temesi D., Molnar, A., Meszaros, E., Feczko, T., Gelencser, A., Kiss, G., and Krivacsy, Z.: Size resolved chemical mass balance of aerosol particles over rural Hungary, Atmos. Environ., 35, 4347–4355, 2001.
Turpin, B. J., Saxena, P., and Andrews, E.: Measuring and simulating particulate organics in
5
the atmosphere: problems and prospects, Atmos. Environ., 34, 2983–3013, 2000.
Zappoli, S., Andracchio, A., Fuzzi, S., Facchini, M. C. A., Gelencs ´er, A., Kiss, G., Kriv ´acsy, Z., Moln ´ar, A., M ´esz ´aros, E., Hansson, H. C., Rosman, K., and Zeb ¨uhr, Y.: Inorganic, organic and macromolecular components of fine aerosol in different areas of Europe in relation to their water solubility, Atmos. Environ., 33, 2733–2743, 1999.
10
Zhuang, H., Chan, C. K., Fang, M., and Wexler, A.: Size distributions of particulate sulphate, nitrate and ammonium at a coastal site in Hong Kong, Atmos. Environ., 33, 843–853, 1999.
ACPD
2, 2167–2208, 2002 Chemical mass balance of size-segregated aerosol E. Matta et al. Title Page Abstract Introduction Conclusions References Tables Figures J I J I Back Close Full Screen / EscPrint Version Interactive Discussion
c
EGU 2002 Table 1. Minimum, median and maximum bulk concentrations for the analysed species and
total aerosol weighed mass. Data were obtained by summing the air concentration from each impactor stage. As explained in the text, the data are divided in two periods: fall-winter (FW) and spring-summer (SS). Total carbon (TC) was apportioned between organic carbon (OC) and black carbon (BC); water insoluble carbon (WINC) was obtained subtracting water soluble organic carbon (WSOC) directly from TC (see text). All concentration are reported in µg m−3, except for the case of organic species (*) whose concentrations are reported in µgC m−3
Min Med Max
FW SS FW SS FW SS NH+4 0.10 0.27 0.31 1.26 1.31 2.23 NO−3 4.27 0.92 13.29 2.04 39.04 4.20 SO2−4 1.54 0.91 4.55 2.60 17.04 5.84 Na+ 0.10 0.03 0.31 0.18 1.31 0.61 K+ 0.14 0.05 0.33 0.10 0.79 0.23 Mg2+ 0.01 0.01 0.05 0.04 0.12 0.08 Ca2+ 0.30 0.35 1.16 0.76 1.75 1.82 Cl− 0.15 0.03 0.79 0.07 4.90 0.55 TC* 6.10 2.62 12.87 4.52 34.20 12.57 OC* 4.06 1.48 8.41 2.96 24.25 8.12 BC* 1.86 1.07 4.13 1.77 10.49 4.45 WSOC* 1.85 0.83 5.36 1.84 15.01 3.57 WINC* 2.78 1.64 6.97 2.93 19.18 11.52 Mass 23.11 9.92 53.24 19.33 142.36 36.32
ACPD
2, 2167–2208, 2002 Chemical mass balance of size-segregated aerosol E. Matta et al. Title Page Abstract Introduction Conclusions References Tables Figures J I J I Back Close Full Screen / EscPrint Version Interactive Discussion
c
EGU 2002 Table 2a. Minimum, median and maximum concentrations as a function of impactor stage and
for the two periods FW and SS of total weighed mass (µg m−3) Total Weighed Mass (µg m−3)
St. Min Med Max
FW 1 1.59 3.40 8.21 2 4.86 8.85 20.52 3 7.43 23.45 88.51 4 1.29 9.82 26.66 5 2.34 6.52 16.10 SS 1 1.12 1.76 2.73 2 1.68 3.34 7.17 3 2.06 5.80 9.15 4 1.91 3.93 7.14 5 2.17 3.79 11.05
ACPD
2, 2167–2208, 2002 Chemical mass balance of size-segregated aerosol E. Matta et al. Title Page Abstract Introduction Conclusions References Tables Figures J I J I Back Close Full Screen / EscPrint Version Interactive Discussion
c
EGU 2002 Table 2b. Minimum, median and maximum concentrations as a function of impactor stage and
for the two periods FW and SS of major inorganic compounds (µg m−3)
NH+4 (µg m−3) NO−3 (µg m−3) SO2−4 (µg m−3)
St. Min Med Max Min Med Max Min Med Max
FW 1 0.04 0.21 0.41 0.09 0.43 1.15 0.06 0.22 0.40 2 0.41 0.95 2.54 0.96 2.43 6.55 0.38 0.83 1.31 3 0.44 2.92 11.83 1.09 8.18 21.60 0.45 2.89 10.95 4 0.04 0.37 3.61 0.38 1.77 9.16 0.09 0.43 4.34 5 0.03 0.07 0.49 0.28 0.57 3.19 0.07 0.20 0.59 SS 1 0.05 0.09 0.20 0.02 0.05 0.19 0.10 0.20 0.52 2 0.11 0.44 0.84 0.03 0.15 0.79 0.29 1.18 2.31 3 0.10 0.45 1.07 0.11 0.22 2.08 0.27 1.14 2.71 4 0.01 0.04 0.07 0.17 0.60 1.34 0.05 0.15 0.40 5 0.01 0.03 0.10 0.14 0.54 1.63 0.06 0.82 0.16
ACPD
2, 2167–2208, 2002 Chemical mass balance of size-segregated aerosol E. Matta et al. Title Page Abstract Introduction Conclusions References Tables Figures J I J I Back Close Full Screen / EscPrint Version Interactive Discussion
c
EGU 2002 Table 2c. Minimum, median and maximum concentrations as a function of impactor stage and
for the two periods FW and SS of carbonaceous species (µgC m−3)
TC (µgC m−3) BC (µgC m−3) OC (µgC m−3) WSOC (µgC m−3) WINC (µgC m−3)
St. Min Med Max Min Med Max Min Med Max Min Med Max Min Med Max
FW 1 0.83 2.03 6.15 0.35 0.82 3.93 0.36 0.99 3.29 0.17 0.46 1.73 0.37 1.51 4.42 2 0.87 2.88 6.35 0.21 1.19 2.74 0.41 1.52 4.84 0.66 1.21 2.80 0.58 1.73 4.81 3 0.55 5.22 22.33 0.13 1.16 6.31 0.42 3.34 16.01 0.36 2.44 9.83 0.21 2.71 12.50 4 0.33 1.93 4.83 0.44 0.60 1.52 0.27 1.24 3.91 0.07 0.73 1.86 0.08 1.17 4.16 5 0.25 0.96 2.15 0.00 0.18 0.42 0.21 0.69 1.85 0.20 0.30 0.57 0.14 0.72 1.87 SS 1 0.44 0.70 1.09 0.13 0.35 0.54 0.20 0.31 0.76 0.08 0.18 0.41 0.31 0.60 0.92 2 0.74 1.89 10.15 0.21 0.57 3.30 0.27 0.74 6.85 0.23 0.46 1.24 0.29 1.38 9.86 3 0.52 1.13 1.94 0.11 0.53 0.67 0.41 0.66 1.64 0.09 0.50 1.06 0.38 0.70 1.21 4 0.27 0.54 0.86 0.00 0.07 0.15 0.25 0.45 0.80 0.03 0.22 0.37 0.05 0.29 0.60 5 0.35 0.48 0.90 0.03 0.05 0.15 0.31 0.42 0.85 0.06 0.24 0.82 0.07 0.21 0.58
ACPD
2, 2167–2208, 2002 Chemical mass balance of size-segregated aerosol E. Matta et al. Title Page Abstract Introduction Conclusions References Tables Figures J I J I Back Close Full Screen / EscPrint Version Interactive Discussion
c
EGU 2002 Table 2d. Minimum, median and maximum concentrations as a function of impactor stage and
for the two periods FW and SS of minor inorganic compounds (ng m−3)
Na+(ng m−3) K+(ng m−3) Mg2+(ng m−3) Ca2+(ng m−3) Cl−(ng m−3)
St. Min Med Max Min Med Max Min Med Max Min Med Max Min Med Max
FW 1 0 16 75 9 30 151 0.5 2 4 9 37 190 7 31 145 2 8 34 103 26 96 172 1 3 8 2 56 388 31 130 659 3 16 81 151 32 144 344 1 6 26 35 137 400 32 403 2 297 4 16 100 360 10 51 208 2 19 46 44 415 843 18 205 810 5 22 104 846 11 24 150 3 17 60 203 398 956 24 124 1 125 SS 1 2 7 17 3 14 33 1 2 4 13 43 97 5 10 29 2 3 13 34 8 34 65 2 3 4 6 45 143 5 8 54 3 7 22 204 7 29 74 2 4 21 12 81 161 5 9 71 4 9 78 959 8 19 74 4 20 117 86 218 453 6 15 801 5 7 85 281 9 17 30 4 20 42 114 334 998 6 20 246
ACPD
2, 2167–2208, 2002 Chemical mass balance of size-segregated aerosol E. Matta et al. Title Page Abstract Introduction Conclusions References Tables Figures J I J I Back Close Full Screen / EscPrint Version Interactive Discussion
c
EGU 2002 Table 3. Minimum, median and maximum concentrations of neutral compounds (NC),
mono-/di-acids (MDA) and polyacids for the five size intervals in the cold (FW) and the hot (SS) season. Statistics of the WSOC content of the samples are also reported in the first column. The range of variation is not reported for the SS period since a complete HPLC analysis was performed for three samples only (see text). All concentrations are reported in µgC m−3
WSOC (µgC m−3) NC (µgC m−3) MDA (µgC m−3) PA (µgC m−3)
St. Min Med Max Min Med Max Min Med Max Min Med Max
FW 1 0.17 0.46 1.73 0.05 0.13 0.42 0.05 0.14 0.28 0.03 0.07 0.14 2 0.73 1.30 2.41 0.12 0.27 0.44 0.12 0.36 0.60 0.09 0.24 0.47 3 0.76 2.87 9.83 0.09 0.52 1.28 0.20 0.86 1.65 0.19 0.55 1.79 4 0.22 0.96 1.86 0.04 0.15 0.43 0.06 0.27 0.42 0.03 0.14 0.26 5 0.20 0.30 0.57 0.03 0.04 0.08 0.04 0.06 0.13 0.01 0.02 0.04 SS 1 0.24 0.06 0.08 0.06 2 1.08 0.15 0.34 0.25 3 0.66 0.12 0.18 0.15 4 0.25 0.04 0.10 0.04 5 0.37 0.04 0.13 0.03
ACPD
2, 2167–2208, 2002 Chemical mass balance of size-segregated aerosol E. Matta et al. Title Page Abstract Introduction Conclusions References Tables Figures J I J I Back Close Full Screen / EscPrint Version Interactive Discussion
c
EGU 2002 Table 4. Functional group air concentrations of water soluble organic compounds of sample
291100 for the five size-intervals. Molar hydrogen concentrations are determined by HNMR analysis, whereas carbon concentration were calculated assuming C/H ratios specific for each category (Fuzzi et al., 2001). The range of variation of carbon concentrations was estimated according to the uncertainties on the C/H values. Carbonyls (keto and carboxylic groups) and their alpha carbon atoms are included here in a single category (H-C-C=O)
WSOC Ar H-C-O H-C-C=O H-C
St. µgC m−3 µmolH m−3 µgC m−3 µmolH m−3 µgC m−3 µmolH m−3 µgC m−3 µmolH m−3 µgC m−3
1 0.38 0.002 0.20 (0.14–0.25) 0.004 0.04 (0.02–0.05) 0.007 0.07 (0.05–0.13) 0.011 0.07 (0.05–0.07) 2 1.20 0.007 0.64 (0.46–0.81) 0.013 0.14 (0.08–0.16) 0.020 0.21 (0.14–0.36) 0.036 0.22 (0.17–0.22) 3 2.01 0.017 0.70 (0.28–1.11) 0.035 0.38 (0.21–0.42) 0.046 0.49 (0.33–0.84) 0.074 0.44 (0.35–0.46) 4 0.58 0.004 0.29 (0.19–0.38) 0.007 0.08 (0.04–0.08) 0.011 0.11 (0.08–0.19) 0.018 0.11 (0.08–0.11) 5 0.12 0.001 0.00 (0.00–0.04) 0.004 0.04 (0.02–0.04) 0.003 0.04 (0.02–0.06) 0.008 0.05 (0.04–0.05)
ACPD
2, 2167–2208, 2002 Chemical mass balance of size-segregated aerosol E. Matta et al. Title Page Abstract Introduction Conclusions References Tables Figures J I J I Back Close Full Screen / EscPrint Version Interactive Discussion
c
EGU 2002 Table 5. Organic functional group concentrations normalized to the total carbon amount
(ROF/C) derived for sample 291100 from HNMR data. The modelled composition of water soluble organic compounds for a typical urban area is also reported based on data from Au-mont et al. (2000). Explanation of the symbols: -C(O)OH carboxylic groups; >C=O keto groups; -CHO aldehydes; -OH alcohols
ROF/C Functional groups
This study Aumont et al.
Total 34 – 54% 50 – 70%
-C(O)OH 8 – 20% < 1%
>C=O 4 – 11% 5 – 20%
-CHO < d.l. ∼ 10%
-OH 22 – 27% 20 – 30%
ACPD
2, 2167–2208, 2002 Chemical mass balance of size-segregated aerosol E. Matta et al. Title Page Abstract Introduction Conclusions References Tables Figures J I J I Back Close Full Screen / EscPrint Version Interactive Discussion c EGU 2002 Fig. 1.
Impaction
Plate
EGA analysis
Determination
of mass
Water
Extraction
IEC
TOC
analysis
Half
Al Foil
IC
HNMR
Half
Tedlar Foil
Impaction
Plate
EGA analysis
Determination
of mass
Water
Extraction
IEC
TOC
analysis
Half
Al Foil
IC
HNMR
Half
Tedlar Foil
Fig. 1. Scheme of the dual-substrate technique employed for the impactor samplings and of
the sample handling and analysis.
ACPD
2, 2167–2208, 2002 Chemical mass balance of size-segregated aerosol E. Matta et al. Title Page Abstract Introduction Conclusions References Tables Figures J I J I Back Close Full Screen / EscPrint Version Interactive Discussion c EGU 2002
Fig. 2.
0 50 100 150 200 250 31/12/99 29/02/00 29/04/00 28/06/00 27/08/00 26/10/00 25/12/00 mass concentration ( µ g m -3 )Fig. 2. Annual trend of PM10concentration measured by the Regional Environmental Agency in the Bologna city centre (solid blue line) and the mass concentration of the impactor samples collected in this work (red dots).
ACPD
2, 2167–2208, 2002 Chemical mass balance of size-segregated aerosol E. Matta et al. Title Page Abstract Introduction Conclusions References Tables Figures J I J I Back Close Full Screen / EscPrint Version Interactive Discussion c EGU 2002 Fig. 3 Fall - Winter unk 12% NO3 27% NH4 11% other ions 6% WINC 16% WSOC 19% SO4 9% Spring - Summer SO4 14% other ions 9% NO3 11% NH4 7% WSOC 18% WINC 19% unk 22%
Fig. 3. Percentage contribution of inorganic compounds (SO2−4 , NO−3, NH+4), other ions, water soluble (WSOC) and insoluble (WINC) organic species to the aerosol mass in bulk samples for the two periods fall-winter (FW) and spring-summer (SS). Unk represents percent difference between total mass measured by gravimetry and total analysed mass.
ACPD
2, 2167–2208, 2002 Chemical mass balance of size-segregated aerosol E. Matta et al. Title Page Abstract Introduction Conclusions References Tables Figures J I J I Back Close Full Screen / EscPrint Version Interactive Discussion c EGU 2002 Fig. 4. 0 10 20 30 40 1 2 3 4 5 impactor stage mass concentration ( µ g m -3 )
Fig. 4. Aerosol mass size distribution for the FW season. Average concentrations for samples
ACPD
2, 2167–2208, 2002 Chemical mass balance of size-segregated aerosol E. Matta et al. Title Page Abstract Introduction Conclusions References Tables Figures J I J I Back Close Full Screen / EscPrint Version Interactive Discussion c EGU 2002 Fig. 5. 0 5 10 15 20 25 1 2 3 4 5 impactor stage mass concentration ( µ g m -3 ) unk other ions NH4 SO4 NO3 WSOC WINC 0% 25% 50% 75% 100% 1 2 3 4 5 impactor stage
Fig. 5. Size segregated aerosol chemical composition: median concentrations (µg m−3) and percentage contribution of inorganic compounds (SO2−4 , NO−3, NH+4), other ions, water soluble (WSOC) and insoluble (WINC) organic species to the aerosol mass in the FW period. Unk represents the difference between total mass, measured by gravimetry, and total analysed mass.
ACPD
2, 2167–2208, 2002 Chemical mass balance of size-segregated aerosol E. Matta et al. Title Page Abstract Introduction Conclusions References Tables Figures J I J I Back Close Full Screen / EscPrint Version Interactive Discussion c EGU 2002 Fig. 6. 0 1 2 3 4 5 1 2 3 4 5 impactor stage mass concentratrion ( µ g m -3 ) unk other ions NH4 SO4 NO3 WSOC WINC 0% 25% 50% 75% 100% 1 2 3 4 5 impactor stage
Fig. 6. Size segregated aerosol composition: median concentration (µg m−3) and percentage contribution of inorganic compounds (SO2−4 , NO−3, NH+4), other ions, water soluble (WSOC) and insoluble (WINC) organic species to the aerosol mass in the SS period. Unk represents the difference between total mass, measured by gravimetry, and total analysed mass.
ACPD
2, 2167–2208, 2002 Chemical mass balance of size-segregated aerosol E. Matta et al. Title Page Abstract Introduction Conclusions References Tables Figures J I J I Back Close Full Screen / EscPrint Version Interactive Discussion c EGU 2002 Fig. 7. Fall - Winter 0.0 0.4 0.8 1.2 1.6 1 2 3 4 5 impactor stage Cation/Anion Spring - Summer 0.0 0.4 0.8 1.2 1.6 1 2 3 4 5 impactor stage Cation/Anion
Fig. 7. Aerosol cation-to-anion ratios as a function of particle size in the FW and SS periods.
ACPD
2, 2167–2208, 2002 Chemical mass balance of size-segregated aerosol E. Matta et al. Title Page Abstract Introduction Conclusions References Tables Figures J I J I Back Close Full Screen / EscPrint Version Interactive Discussion c EGU 2002 Fig. 8. Fall - Winter 0 3 6 9 1 2 3 4 5 impactor stage mass conc. ( µ g m -3 ) NH4 NO3 SO4 Spring - Summer 0 1 2 3 1 2 3 4 5 impactor stage mass conc. ( µ g m -3 ) NH4 NO3 SO4
Fig. 8. Median concentration of aerosol main inorganic ions as a function of particles size in
the FW and SS periods.
ACPD
2, 2167–2208, 2002 Chemical mass balance of size-segregated aerosol E. Matta et al. Title Page Abstract Introduction Conclusions References Tables Figures J I J I Back Close Full Screen / EscPrint Version Interactive Discussion c EGU 2002 Fig. 9. Fall - Winter 0.00 0.15 0.30 0.45 1 2 3 4 5 impactor stage mass conc. ( µ g m -3) Na K Mg Ca Cl Spring - Summer 0.00 0.15 0.30 0.45 1 2 3 4 5 impactor stage Ca ( µ g m -3 ) 0.00 0.03 0.06 0.09 mass conc. ( µg m -3 ) Ca Na K Mg Cl
Fig. 9. Median concentration of aerosol minor inorganic ions as a function of particles size in
the FW and SS periods.
ACPD
2, 2167–2208, 2002 Chemical mass balance of size-segregated aerosol E. Matta et al. Title Page Abstract Introduction Conclusions References Tables Figures J I J I Back Close Full Screen / EscPrint Version Interactive Discussion c EGU 2002 Fig. 10. Fall - Winter 0 3 6 9 1 2 3 4 5 impactor stage mass conc. ( µ g m -3 ) WINC TC EC WSOC Spring - Summer 0 1 2 3 1 2 3 4 5 impactor stage mass conc. ( µ g m -3 ) WINC TC EC WSOC
Fig. 10. Median concentrations of carbonaceous aerosol species as a function of particles size:
in the FW and SS periods.
ACPD
2, 2167–2208, 2002 Chemical mass balance of size-segregated aerosol E. Matta et al. Title Page Abstract Introduction Conclusions References Tables Figures J I J I Back Close Full Screen / EscPrint Version Interactive Discussion c EGU 2002 Fig. 11. Fall - Winter 0% 20% 40% 60% 80% 100% 1 2 3 4 5 impactor stage Spring - Summer 0% 20% 40% 60% 80% 100% 1 2 3 4 5 impactor stage
Fig. 11. Size segregated WSOC composition during the FW and SS seasons determined by
HPLC analysis. The figure reports average and standard deviations for the ratio between neu-tral compounds and the sum of the three fractions (red line) and for the percentage of mono/di-acids with respect to the total acidic fraction (blue line).
ACPD
2, 2167–2208, 2002 Chemical mass balance of size-segregated aerosol E. Matta et al. Title Page Abstract Introduction Conclusions References Tables Figures J I J I Back Close Full Screen / EscPrint Version Interactive Discussion c EGU 2002 Fig 12. H-Ar H-C-O H-C-C= H-C Stage 1 Stage 2 Stage 3 Stage 4 Stage 5 Chemical shift (ppm) F L L L L A F L L L L A L D M D M D F L L L L A L F L L L L A L F A 10 9 8 7 6 5 4 3 2 1 0
ACPD
2, 2167–2208, 2002 Chemical mass balance of size-segregated aerosol E. Matta et al. Title Page Abstract Introduction Conclusions References Tables Figures J I J I Back Close Full Screen / EscPrint Version Interactive Discussion
c
EGU 2002 Fig. 12. HNMR spectra of the water extracts of the test sample collected in November (five
impactor stages). Extracts were dried and re-dissolved in deuterated water and an internal standard (Tspd4) was added before analysis. The horizontal scale is the chemical shift (δH) referred to the internal standard. The peaks attributed to individual compounds are marked in the figure (“F”: formate; “L”: levoglucosan; “M”: methansulfonate; “D”: dimethylamine; “A”: acetate). Four specific spectral regions are also identified at the bottom of the spectra. “H-C”: purely alkylic protons; “H-C-C=”: protons bound to aliphatic carbon atoms adjacent to unsaturated groups; “H-C-O”: protons bound to oxygenated aliphatic carbon atoms; “Ar-H”: aromatic protons. The region between 4.4 and 5.0 ppm is disturbed by instrumental noise due to a residual signal of HDO. Spectra were recorded at 400 MHz. Details on the experimental conditions are provided in Decesari et al. (2000).