3 9080 00032 7558
THE DEVELOPMENT OF ASSEMBLY SQUARE: A STUDY OF ECONOMIC PLANNING IN SOMERVILLE, MASSACHUSETTS
by
STEVEN RICHARD LANDAU
B.A., University of Massachusetts (1976)
Submitted to the Department of Urban Studies and Planning in Partial Fulfillment of the Requirements of the Degree of
MASTER OF CITY PLANNING at the
MASSACHUSETTS INSTITUTE OF TECHNOLOGY
June, 1984
@ Steven R. Landau 1984
The author hereby grants to J.I.T. permission to reproduce and to distribute copies of this thesis documqW/in whole or in
Signature of Author: Certified by: Accepted by: Thesis Supervisor
7
-A OP T S T!ETAUG
1
1984
L! PjrA Chairperson, Department of2
ABSTRACT
Assembly Square emerged out of the contraction of Somerville's manufacturing base and the growth of the Northeast service economy. Formerly called the Mystic River Area, the site once hosted both a Ford Motor Company Assembly Plant and the food processing and warehousing
operations of First National Stores. Ford closed its Somerville operations in 1958, and First National announced it would move in 1977.
Developers immediately began eyeing the River Area for commercial use. The newly constructed Interstate 93 placed the site ten minutes from Boston's Central Business District by automobile; and made it a potential
retail location easily accessible to suburban cities in the vicinity. By 1978, the Urban Development Action Grant program was available to fund the local access and internal circulation improvements necessary to facilitate commercial development.
Somerville officials wanted to balance commercial growth with reindustrialization. However, traditional manufacturing was declining in the region. Promotion of industrial development countered prevailing economic trends, and reliable investors could not be secured.
The Assembly Square Mall and Office Park, named after the Ford Plant, opened toward the end of 1980, aided by a package of public-private development instruments. Benefits to Somerville, defined by employment; property taxes; effects on city commerce and development, to date are fair but not exceptional. Above all else, Assembly Square is important to Somerville because it was the first modern development built in the city, and is the potential foundation of a diversified local economy.
ACKNOWLEDGEMENTS
I would like to acknowledge the many people who supported my efforts. A special thanks to my advisor Lisa Peattie who kept me from deviating into dead ends, and gave strong support when I thought this
project would disintegrate into dust. Also, a warm thanks to the many DUSP faculty members whom I often consulted for guidance. The reference staff at Rotch Library helped me unearth many of the sources used in this study. I also owe a large debt to the students of Lisa, Marty Rein, and Stephen Cornell who interviewed Somerville residents and city officials in 1982. I
particularly wish to acknowledge Celine Sachs and Joseph Soley, who preceded me in investigating the development of Assembly Square, and provided a lot of the interview material used in this report.
This thesis would not have been possible without the help and generous time provided by former and current officials of the City of
Somerville, especially John Matthews and Gerald McCue. The resources of the Somerville Public Library and the help of its director, Paul D'Angelis, proved invaluable.
Finally, a big-thank you goes to my pals in the MCP program. Their reinforcement made these last two years possible.
4 TABLE OF CONTENTS Page Chapter I Chapter II Chapter III Chapter IV Chapter V Chapter VI Chapter VII Appendix Introduction ... 5
The Economic Background of Somerville: 1947-1977... 12
The Evolution of the Mystic River Area...
Roots of Office and Retail Development...
Commercial Development Plans for the Mystic River Area...
Assembly Square in Somerville...
... 24
... 33
... 39
61
Development in Somerville... 74
Value of Real Property and the
INTRODUCTION
In November, 1982, planners who served three diverse Somerville mayors praised the office and retail complex developed at Assembly Square as an outstanding achievement for the city. Like many traditional
manufacturing cities in Massachusetts, the industries which underscore the Somerville economy have been declining for a generation. Since 1969 a public policy goal of the current and previous two mayors of Somerville--S. Lester Ralph, Thomas August, and Eugene Brune--has been to foster
commercial development, and integrate the city into the new regional
economy. In this regard the Assembly Square Mall and Office Park, developed between 1978 and 1981, is the showcase of Somerville, and represents six years of work by city planners to promote the image of Somerville as a
forward-looking city. Assembly Square proved that Somerville can attract major investors and build ambitious projects; it was a positive step towards burying the lingering reputation of a seedy "Slumerville."
The efforts to make Somerville an attractive environment for first-class investors and developers are being threatened by scandal too reminiscent of the history of corruption in the city. From February, 1984, Assembly Square has been the focus of a United States Grand Jury
investigation, including publicized subpoenas; and rumors of bribery,
extortion, and kickbacks. Officials of the current administration of Mayor Eugene Brune fear that quality developers will shy away from doing business
6
in the city, leaving Somerville to "bottom of the barrel" investors.1
To date neither officials nor activities of Brune's government have been implicated by the probe. If corrupt institutions in the city are uprooted by the investigation, Somerville may overcome this latest tarnish
to its image. Then, the development strategy which began with Assembly Square can succeed or fail on the objective locational factors and development opportunities found in Somerville.
Assembly Square as a Product of The National Economy
To understand why Assembly Square was developed it is necessary to examine Somerville in the context of general industrial decline. The retail and office development is a product of contemporary trends in the national and regional economies, including the shifting relationship between central cities and their suburban rings. The story of Assembly Square begins in the mid-1920's, when the site was called the Mystic River Area of Somerville. Ford Motor Company built an automobile assembly plant by the river, and First National Stores established its corporate headquarters, food
processing operations, and warehousing center on a parcel adjacent to Ford. Anchored by the Mystic River Area, Somerville became a major
industrial center in New England. The city retained its manufacturing base into the 1950's. However, the national economy began to change in that decade. Manufacturing employment has become a progressively smaller part of the United States's economy and Northeast industries are an increasingly smaller proportion of domestic manufacturing.
1
Telephone interview with Thomas Pelham, Director of the Office of Planning and Community Development, Somerville; March 9, 1984.
In 1946 41% of private sector employment in the United States was in manufactures, and an equal 41% was in service related industries. As a share of the private economy, manufacturing employment fell to 38% in 1957;
29% in 1977, the year Assembly Square was proposed; and preliminary 1983
data pegs the manufacturing at 25%. During the same period service
employment has ballooned to 61% of the private sector through 1983.2 Of the manufacturing sector retained in the United States, trends clearly show a job flow from the Northeast to other regions of the nation. Bureau of Labor
Statistics employment data reveal that the Northeast region (defined as New England and the Mid-Atlantic states) sustained a 10.8% decrease in
manufacturing jobs between 1950 and 1981. Further examination shows that this sector was stable into the middle 1960's before the decline began. All other broadly defined regions in the country--North Central, South, and West--have increased manufacturing employment. As might be expected, the overall growth in North Central states has been modest, 11.6% since 1950 and 7.4% from 1960-1981. However, since 1950 the West and South have more than doubled their manufacturing sectors.3
Aided by federal highway construction, dramatically increased population mobility, and the advent of national capital markets, the
Southern and Western economies have matured. Investment has been attracted
2
2
United States Department of Labor, Bureau of Labor Statistics, Employment and Earnings, February, 1984, p. 45.
3
George Sternlieb, et al., Demographic Trends and Economic Reality: Planning and Markets in the 80's, (Rutgers University, 1982), p..116; and Bernard L. Weinstein and Robert E. Firestone, Regional Growth and Decline in the United States: The Rise of the Sunbelt and the Decline of the
8
to these regions generally by lowers costs of land, energy, and (much less unionized) labor at the expense of the developed Northeast. The growing industrial base, in turn, has fueled additional infrastructure investment and population migration from northern states.
Regional differences are equally clear when the rings of Standard Metropolitan Statistical Areas (SMSAs) are examined. By excluding central cities, we are able to form a precise regional and national economic context for urban suburbs such as Somerville. H. J. Brown, Ruby Phillips, and Avis Vidal analyzed the economies of the 50 largest SMSA's in the United States between 1967 and 1977.4 Their study is unique because they both stratified SMSA's by central city and rings (also done in studies by John Kain and Arthur Soloman), and they cross-stratified their analysis by regions.
Employment trends show significant gains in all parts of this country in the ten-year period, 38% in the Northeast; 57% in the North Central; 97% in the South; and 61% in the West. The study also shows a clear flow of jobs from central cities to surrounding rings in all regions. However, the only economic sector in any ring to show a net employment loss is manufacturing in the Northeast. The rings of Northeast SMSAs sustained a net decline of 85,000 manufacturing jobs between 1967 and 1977, or 6%. In 1967 48% of
employment in Northeast SMSA rings was in manufacturing, ten years later the proportion fell under 33%.
4
H. J. Brown, Ruby Phillips, and Avis Vidal, Growth and
Restructuring of Metropolitan Economies: Decentralization and Industrial Change During the 1970's, Unofficial Working Paper of the MIT-Ha'rvard Joint Center for Urban Studies (Cambridge, MA: October, 1983).
The study of Brown, et al., shows that growth in all sectors of the private economy has been much larger in rings thanin central cities in the Northeast. Services are being generated in the suburbs which traditionally were provided in urban centers. For example, Finance, Insurance and Real
Estate (FIRE) services increased 153% in the rings, and declined 2% in central cities. Similar patterns are found in the sectors of services, retail trade, and wholesale trade. Two related reasons can be assigned to these trends. First, as people have moved out of central cities, services have located in the new population pockets. Second, the role urban rings as
the outlying manufacturing areas of central cities has been changing as national and regional economies are restructuring. Ring areas are diversifying their economies as a means of economic development.
The economic trends of the Northeast can be focussed onto the metropolitan Boston region, comprised of five counties: Essex, Norfolk, Plymouth, Suffolk (including Boston), and Middlesex (including Somerville). This region is not the SMSA but, according to the Research Department of the Boston Redevelopment Authority, is a fairer representation of the Greater
5
Boston labor market. Examining "low-tech" manufacturing in industries traditional to the Boston area leads to the conclusion that the old
metropolitan manufacturing base is dying. During the 1969 to 1980 period, food and kindred products lost 36% of its employment; apparel fell 28%; and losses are observed of 24% in rubber and plastics, and 54% in leather. In the overall metro economy, this trend has been counterbalanced by high
5
Conversation with Jeffrey P. Brown, Research Department, Boston Redevelopment Authority.
10
technology industries, including computers; optical instruments; and many other technological goods.6
In sum, the metro economy expanded 22.5% between 1969 and 1980. Economic growth was paced by services, particularly business and health services, which grew by 64%, while employment in retail trade and FIRE each increased 21%. As the economy has evolved, services and manufacturing have been running on opposite tracks. In 1969, services accounted for 22% of the Greater Boston economy and manufacturing for 34%. By 1980 the manufacturing share--including high tech industries--fell to a 22% share and services captured 31%.
The national and regional growth of service industries set off an office and retail boom in downtown Boston. Between 1960 and 1983 $3.1 billion was spent on commercial construction in the Central Business District, including 45 new office buildings, 14 new hotels, Faneuil
Hall/Quincy Market, and Copley Place. Furthermore, demand will exist for an additional one million square feet of office space in Boston for the next five years.8
The development of Assembly Square in Somerville is a product of the above described trends. Named for the former Ford plant, it is an explicit attempt to create an export commercial sector to replace the city's
6
Brown, Jeffrey P., Boston Business Trends: Suffolk County, the Metro Area, and the United States, Boston Redevelopment Authority, Boston, MA, December, 1982; p. 51.
7 Ibid.
8The Boston Conference:
declining manufacturing base. The 210,000 square foot office building
competes with the nearby Central Business District (CBD) for firms which may be enticed by lower rents. The retail mall is aimed at capturing trade immediately north of the CBD from potential customers who are inconvenienced by shopping downtown. In effect, Assembly Square is a trail blazer as
Somerville's first modern retail and office complex, and its most important public-private venture to date. This report will examine the economic and political changes in Somerville which created both the need and opportunity to build this mixed-use complex. It also will explore the evolving nature of economic development in the city, concentrating on planning for Assembly Square. Finally, the economic impacts of the development will be surveyed and evaluated.
CHAPTER II
THE ECONOMIC BACKGROUND OF SOMERVILLE: 1947-1977
In the decade after World War Two, manufacturing was the backbone of a strong Somerville economy. Manufactures comprised 38% of employment in Somerville in 1947 and 35% in 1955.9 Manufactures are "primary" or "export" industries which produce goods for markets beyond city boundaries or local areas. These industries create an inflow of income, and stimulate demands for goods and services among primary industries and their employees. This demand, in turn, sparks economic activities within secondary and service industries. In the first decade following the war, Somerville's key primary manufacturing industries were Food and Kindred Products, and Transportation Equipment. With the advantage of excellent railroad connections and
relatively low cost freight charges, fine roadway connections, and proximity to Boston, secondary industries in the city included warehousing and
distribution, transportation, and wholesale trade.
In December, 1926 when Ford opened its automobile assembly plant, the Mystic River was the major locational lure. The Company used water transportation for incoming raw materials and outgoing shipments of
9
Community Renewal Program, Economic Analysis: Plan of Development, Somerville, MA; The Planning Services Group, Inc.; Cambridge, MA; May 19, 1968, p. 16.
vehicles.10 Satisfied with its Somerville location, Ford invested $500,000 to expand its factory during the depression in 1937.11 In addition, the rail and road connections at the Mystic River Area lured First National Stores to the site. Between 1926 and 1930, First National invested roughly $5,000,000 in the River Area.1 2
The changes in the Somerville economy are fully consistent with post-war national and regional trends. Table 1 illustrates Somerville's declining manufacturing base between 1947 and 1966, while Table 2 presents
an overview of the city economy from 1967 through 1982. It is easy to
observe the downward spiral of manufacturing in Somerville. In 1947
manufactures provided 39% of private sector employment in the city. By 1982 the manufacturing share was 21%, and it had dipped as low as 19% in 1976 and
1977.
The disinvestment in Somerville's industrial plant is seen more sharply by studying the de-evolution of Food and Kindred Products and Transport Equipment manufacturing in the city. In 1947 and 1955 they accounted for 21% of Somerville's employment base and 55% and 59% respectively of manufacturing jobs in the city. Food processing firms employed 2753 people in 1947, and this level has declined steadily to under
1,000 by 1966.13 In the early 1950's, First National, the largest single
1 0
Somerville Journal, February 27, 1958; p. 11. 1 1
Ibid. 1 2
Somerville Journal; April 18, 1930; p. 1.
1 3
The Census of Manufactures, published by United States Census (Footnote Continued)
14
TABLE 1
Manufacturing and Key Industries as a Percentage of Private Sector Employment in Somerville
Total Private Employment Manufacturing Employment % of Total
Food and Kindred Products 2,753 % of Total Transportation Equipment % of Total 1947 20,444 7,742 37.9 2,660 13.5 1,518 7.4 1955 21,861 7, 734 35.4 1,653 12.2 1,898 8.7 1963 17,688 4,763 26.9 973 9.3 148 0.8 1966 1947-1966 17,350 4,319 24.9 -64.7% 5.6 183 1.1 -11.2% -44.2% -87.9%
Source: Community Renewal Program, Economic Analysis: Plan of
Development, Somerville, MA; The Planning Services Group, Inc.
(Footnote Continued)
Bureau, lists 1,400 Food and Kindred Products employees in 1967; and 1,000 in 1972. By 1977, the sector had less than 450 employees in Somerville, and therefore was not listed in the Census of that year.
0oa 4J T
a)
1LML
'
'.4 MARSMASTER PLAN
0Csf.
MYSTic NivER~ ~h~e.
IUI.1IAUI L BCw'EN AND AssoCIATES iNaTABLE 2
Jobs in Somerville Average Annual Employment
Contract Construc-tion 1119 1131 1141 1155 1188 1226 1158 1150 1131 1287 1368 1376 844 917 812 795 Mfg. 4381 4330 4621 4304 3954 3692 3654 3524 3395 3112 3017 3099 3235 3483 3351 3301 6 7 6 6 7 7 7 6 7 8 9 9 6 6 5 5 Trans. Comm. 25 25 25 24 22 20 21 20 21 19 19 20 22 22 22 21
Source: Massachusetts Department of Employment Security
Year 1967 1968 1969 1970 1971 1972 1973 1974 1975 1976 1977 1978 1979 1980 1981 1982 Total Employ-ment 17458 17237 18184 17801 17651 18447 17399 17814 16332 16280 15968 15513 14963 15647 15368 15950 Util. 1686 1692 1565 1500 1356 1476 1863 1738 1474 1399 992 943 1110 1223 1018 1043 Retail Trade 7189 6843 7290 7638 7958 8007 6702 7100 6080 6230 6290 5779 5351 5147 5160 5512 %o 10 9 8 8 8 11 10 9 9 6 6 7 8 7 7 FIRE 508 390 339 342 317 323 447 691 464 497 518 441 517 524 551 524 41 40 40 43 45 43 39 40 37 38 39 37 36 33 34 35 Ser-vices 2535 2814 3189 2832 2853 3694 3550 3585 3770 3726 3755 3861 3894 4334 4461 4758 3 2 2 2 2 2 3 4 3 3 3 3 3 3 4 3 15 16 18 16 16 20 20 20 23 23 24 25 26 28 29 30
employer and taxpayer in Somerville, was the industry's leader in the city. Other major firms included the Great Atlantic and Pacific Tea Company; John P. Squires Company; North Packing and Provision; and New England Dresses, Meat, and Wall Company.14 By the mid-1950's, Swift and Co. acquired and operated the production facilities of the latter three meatpacking firms.15 In the mid-1970s, first Swift, then First National closed their Somerville operations. When First National left Mystic River in 1977, it symbolized the end of Somerville as a major food processing center.
Ford, the second largest employer and taxpaying establishment in Somerville during the mid-1950's, in effect was the Transport Equipment sector of the Somerville economy. Direct employment at the assembly plant ranged from 1400 to 2600 depending on the cyclical health of the automobile industry. In addition, the ripple effects of auto manufacturing on the metro economy were significant. In the years following the war, Ford purchased $2,500,000 of local goods and services annually.16 The assembly plant closed down and was sold in 1958. Between 1955 and 1963 Transport Equipment Manufacturing in Somerville fell from 1898 employees to 148, and ceased to be a major factor in the city. (Table I)
Somerville's image as "blue collar town" grew out of both its industrial base and the manufacturing employment of its residential
14
1 4
Cheney, Isobel, Brief History of Somerville: 1630-1956, Book Two, Publication Date Unknown, p. 89.
1 5
Real Estate Tax Commitment Books, City of Somerville, 1957. 1 6
18
workforce. Approximately half of the jobs available in Somerville are taken by residents, but that covers only one quarter of working Somervillians. In
fact, more residents work in Boston than in their home city.17 Jobs within Somerville that are especially desirable, such as automobile assembly line worker, may spark competition which crowds out residents. The Somerville Journal estimated that less than 20% of Ford's employees were from
Somerville.18 However, as wages are lower in other types of manufacturing, secondary services, and other sectors, potential workers are less inclined to travel for them, and therefore residents hold a higher ratio of these jobs.
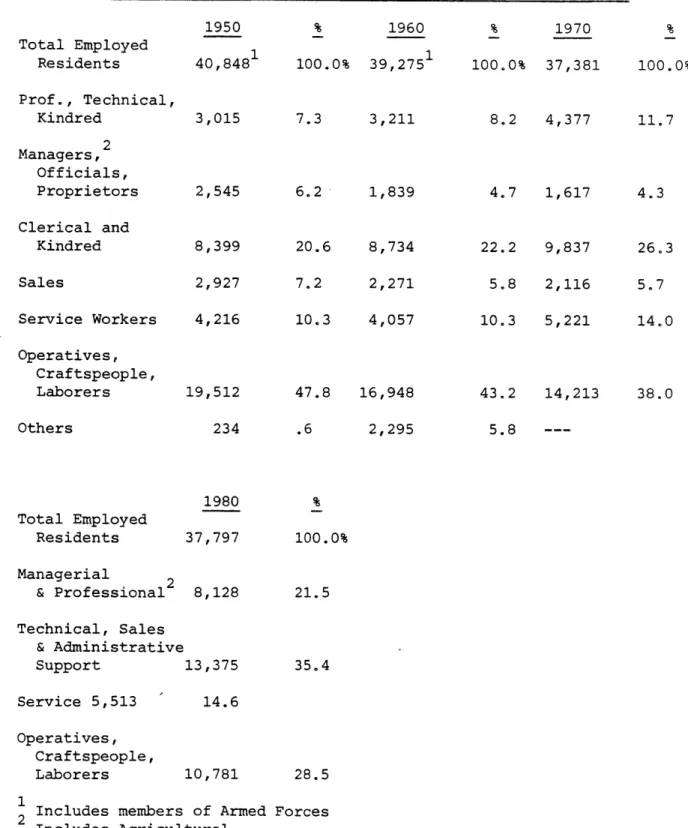
Table 3 describes the employment composition of Somervillians. In 1950, nearly half of employed city residents were "blue-collar" workers.
Over the following 20 years, to 1970, the goods producing sector of the residential workforce fell to 38%; by 1980 it was 28.5%. During this 30-year period the percentage of employed residents who worked as
professionals or clericals rose rapidly. Due to changes in census data formatting in 1980, exact comparisons of service type jobs among
Somervillians are not possible. However, it seems clear from available data
17
1 7United States Census:
Characteristics of the Population, 1960; Journey to Work, 1970; General Social and Economic Characteristics, 1980. Data are based on samples.
1 8
Somerville Journal, February 20, 1958. The 20% was constant. A Ford Company public relations magazine, Ford Somerville News, September, 1948, reported approximately 300 or 1500 employees lived in Somerville.
TABLE 3 Occupat Total Employed Residents Prof., Technical, Kindred Managers,2 Officials, Proprietors Clerical and Kindred Sales Service Workers Operatives, Craftspeople, Laborers Others
ions of Employed Somerville Residents: 1950-1980
1950 % 1960 % 1970 40,848 100.0% 39,275 100.0% 37,381 3,015 2,545 8,399 2,927 4,216 19,512 234 7.3 6.2 20.6 7.2 10.3 47.8 .6 3,211 1,839 8,734 2,271 4,057 16,948 2,295 8.2 4,377 4.7 1,617 22.2 5.8 10.3 43.2 5.8 9,837 2,116 5,221 14,213 1980 Total Employed Residents 37,797 100. Managerial 2 & Professional 8,128 21.5 Technical, Sales & Administrative Support 13,375 35.4 Service 5,513 14.6 Operatives, Craftspeople, Laborers 10,781 28.5
1 Includes members of Armed Forces 2 Includes Agricultural 0% 100.0% 11.7 4.3 26.3 5.7 14.0 38.0 %
20
that city residents are becoming more oriented towards office work, and that this trend has accelerated since 1970.
Regarding employment of Somerville residents within specific industrial classifications, examining the number of Somervillians working within Food and Kindred Products over time is particularly interesting. In
1950 and 1960, when food processing was the largest manufacturing sector in
the city, 2657 and 2628 residents respectively worked in the industry. By 1970, as the sector began its decline, 1132 residents were employed; and in
1980 the number was 720. Note that this trend is correlated closely with
the life and decline of Food and Kindred Products firms in Somerville. This suggests strongly that Somervillians filled many of the food processing jobs in the city. By 1980 more residents worked in the industry than the number of such jobs in the city.1 9
The parallel trends of the employed residential labor force and the city's job market are related as are the explanations of these economic changes. Clearly, composition of the workforce is shaped in part by obtainable jobs. Secondly, the proportion of service related jobs has
increased while the city's population has fallen from 102,351 in 1950 to 77,372 in 1980.20 Less services are needed for Somervillians, suggesting
that Somerville is becoming an attractive address for people who work outside of the city. At the same time, selected service industries in
1 9
United States Census: Characteristics of the Population, 1950; 1960; 1970; General Social and Economic Characteristics, 1980. Data are based on samples.
2 0 Ibid.
Somerville are being used for economic export to clients beyond city lines. Perhaps most importantly, the increases of service- related employment in Somerville and among its residents are occurring as women become a growing proportion of the city's workforce (33.7% in 1950, 37.9% in 1960, 41.6% in
1970, and 48.1% in 1980). Nationally and locally women make up a
disproportionate share of -"white collar" labor. In 1980 86% of employed Somerville women worked in service, clerical, or professional jobs.2 1
As Somerville has deindustrialized, the city has become poorer relative to the Boston SMSA. Median incomes and minimum income levels were examined from 1950 to 1980 in Table 4. In 1950 Somerville's median income was 109% of the SMSA; as the city's economy has shifted, Somerville's income
has fallen dramatically to 77% of the SMSA median by 1980. Similarly, selected family income and poverty statistics reveal that Somerville had a smaller percentage of lower income families than the SMSA in 1950. By 1960 it had a slightly higher rate of minimal income families, and the gap has become wider in 1970 and 1980.
Employment levels within cities, distinct from residents' occupations, measure the vitality of industry and commerce within city limits. In turn, the health of these sectors determine the strength of municipal tax bases where citizens' incomes generally are in low to moderate
strata. Usually residential property value, and hence residential tax bases, reflect income levels. When a municipal tax base is supported by
2
22 TABLE 4
Median Household Income and Percent Below Selected Minimum Family Income Levels: Somerville and Boston
SMSA, 1950-1980 A. Median Income Somerville $ 3,168 6,024 9,594 14,401 Boston SMSA Somerville as a percen-tage of Boston SMSA $ 2,909 6,622 11,449 18,694 109% 91 84 77
B. Minimum Family Income Level
Somerville 1 19502 19603 19703 1980 24.7% 11.9 7.5 9.6 Boston SMSA 30.4% 11.3 6.1 7.5 1
2 Less than $2000 per year Less than $3000 per year Federal Poverty Level
Note: The minimum levels of 1950 and 1960 are not comparable with each other or with the 1970 and 1980 poverty level. Percentages should be used to compare Somerville with Boston SMSA within single years only.
Source: United States Census: Characteristics of the Population, 1950; 1960; 1970; Social and Economic Characteristics, 1980.
1950 1960 1970 1980
export industries, a city effectively has people from outside its borders supporting its public services.
The number of households in Somerville has increased since 1950 from 27,955 to 29,687 in 1980.22 Despite the broader residential base,
Somerville's property tax assessments have declined between the 1950's and the present. In 1958 the year the Ford plant closed down, real estate in Somerville was assessed at $126,166,400;23 in Fiscal Year 1983-84, assessed value is at $115,780,838.24 Unfortunately, real property assessments by classification are not available prior to 1967. As expected, from 1967 to 1981 the burden of carrying the tax base has progressively shifted to
residential property. In 1967, homes and apartment buildings were valued at 63.5% of the Somerville tax base, but by 1981 residential property carried
72%.25
2 2 Ibid. 2 3
Annual Report; City of Somerville; 1958. 2 4
Tax Recapitulation of Somerville; Fiscal 1984.
2 5
The Planning Service Group, Inc., p. 96; Property Classification Report, Massachusetts Department of Revenue, Bureau of Local Assessment. Somerville's property tax valuations by the Board of Assessors are
notoriously ad-hoc. Gerald McCue, Treasurer of Somerville, said that the city does not have a logical tax assessment formula that can be traced over past years. The Commonwealth of Massachusetts has set Somerville's
equalized valuation at $330,000,000. However, a market analysis conducted by OPCD places Somerville's 100% property valuation at about $1,100,000,000.
CHAPTER III
THE EVOLUTION OF THE MYSTIC RIVER AREA
The transformation of Somerville's Mystic River Area into Assembly Square is pivotal in the overall changes of the city economy. First the river, then a railyard, thirdly the intersection of Routes 1 and 28, and finally an adjacent interstate highway, historically has made the site an enticing location for manufacturing and warehousing firms. With the establishment of Ford and First National, the River Area became a major industrial pocket in Somerville and the metropolitan region. By the late 1950s, the assembly plant supplied automobiles to 323 New England Ford dealers, and employed well over 1,000 hourly and salaried people.26 First National, at its operating peak, had nearly 2,000 employees. The
supermarket's Somerville complex was a distribution center for 214 stores in its "Somerville Division," and processed foods for 572 stores in New England and New York.2 7
On the afternoon of February 19, 1958, the Ford Motor Company
announced its plans to close the Somerville assembly facility by the coming March 14th, and sell the shell of the plant and its 32 acre site within
2 6 o 2
6Somerville Journal, February 27, 1958; p. 11. 27Somerville Journal, May 29., 1959; p. 1.
thirty days after the shutdown.28 The closing was part of the ten-year consolidation program which was to include laying off 40,000 employees.29 The Mystic River plant had three drawbacks in Ford's national perspective. First, it was tooled to produce the discontinued Edsel line. Second, a company spokesperson argued that the high cost of machinery required at least a two shift operation for economic efficiency. However, two shifts were not possible in Somerville because the plant did not have room to expand for required storage space.30 Finally, the original locational factor that attracted Ford to Somerville was the River; but by 1958 cars were no longer being transported by water.31
The Ford closing had been rumored for many years before the fact.3 2 When it was announced, judging from the written record, the news was
digested calmly. Perhaps it was because less than 20% of Ford employees were Somervillians, some 300 out of 40,000 employed city residents. In addition, food processing, not automobile manufacturing, was the city's major industry. The city government and Chamber of Commerce appeared
concerned over the adverse impact the closing would have on the municipal tax base. Ford was Somerville's third, sometimes second, largest tax payer accounting for about 2% of the city's assessed real estate and revenues (see
2 8Somer( ille Journal, February 20, 1958; p. 1. 29
Somerville Journal, March 6, 1958; p. 10. 3 0Somerville Journal, February 20, 1958, p. 1. 3 1
Somerville Journal, February 27, 1958, p. 1. 3 2
26
Table 5). In context of the tax base, Mayor William J. Donovan referred to the closing as a "near-tragedy."3 3
To maintain the tax base, and secondarily to preserve jobs in the city, official Somerville quickly mobilized to find a buyer for the Ford facility. Before the era of Community Development Departments, City Hall did not have an in-house organ to market the property and city to
prospective investors. The Chamber of Commerce assumed the initiative, and took charge of finding a purchaser through its Industrial Development
Committee (IDC). The Mayor formally confirmed the Chamber's role, and directed Somerville's Urban Renewal Authority to assist the Committee.34
The Ford disinvestment operation was efficient. By April 2, only 100 salaried and 125 hourly paid workers remained on the payroll. At that
date, Ford publicly set the sale price of the property at $1,750,000,35 some $700,000 below its tax assessed valuation (Table 5).
The IDC reported receiving several inquiries regarding the Ford plant. Ironically, one such feeler came on behalf of Volkswagen. However,
33
Mayor William J. Donovan's Midterm Address, January 5, 1959. The Boston and Main Railroad, which then owned 29 parcels of land in Somerville,
including five in the Mystic River Area, was Somerville's largest taxpayer. For one example, in FY 1977 its property value was assessed in excess of
$5,000,000. Also, Swift and Co. paid roughly the same amount of taxes as Ford in 1955, 1957 and 1958. In 1959 its property was valued at $2,455,612; however by 1967 the valuation of Swift and Co.'s property fell to $953,200.
3 4
Somerville Journal, February 27, 1958; p. 2. 3 5
Tax Payments and Impact on Somerville Tax Base by Ford Motor Company and First National Stores in Selected Years
Ford First National
Tax Rate per $1000 of Assessed Value $ 63.20 71.20 79.20 83.40 96.20 126.80 181.80 237.60 Valuation of Real Property (000's) $2,091 2,433 2,433 Gross R.E. Taxes Before Abatements (000's) $132 173 193 % of Somerville Tax Base 1.7% 1.9 1.9 Valuation of Real Property (000's) $3,727 4,227 4,227 5,766 5,558 5,526 3,525 3,336 Gross R.E. Taxes Before Abatements (000's) $236 301 335 481 535 701 641 792
Note: First National received a tax
year was $469,000 (rounded).
abatement of $231,740 in 1967. Net taxes paid that
Sources: Annual Report, City of Somerville; Real Estate Tax Commitment Books, City of
Somerville Year 1955 1957 1958 1959 1962 1967 1972 FY1977 % of Somer-ville Tax Base 3.0% 3.4 3.4 4.7 4.4 3.5 1.6 2.7
28
the German car manufacturer lost interest when it found that the site did not have a tidewater dock.3 6
In the last week of May, First National Stores, with the IDC acting as an intermediary, purchased the former assembly plant. First National thus coupled Ford's 32 acres with its adjacent 20 acre site, and took
possession of the plant in September. First National remained "bullish" on the Mystic River Area due to easy access to railroad facilities, low freight charges, good roadway connections for the time, and ambitious highway
construction proposals including an urban innerbelt slated for Somerville.3 7 Mayor Brennan hailed First National's acquisition of the Ford plant. He stated that the new use of the site "heralds a reinforcement of the
prosperity of this city based on the stability inherent in the food industry which is so predominant locally."38
Somerville's economy sustained a substantial job loss due to the Ford-First National change. First National used the former assembly plant as a shipping-receiving center, and to augment its warehouse space. 39The labor required for these functions is a fraction of a one shift automobile factory. Furthermore, Somerville lost about $900,000 in its tax base as a result of the changed land use. In 1958, Ford was assessed at a value of
36
Somerville Journal, February 27, 1958; p. 1. 3
Somerville Journal, May 29, 1958; p. 1. 38Donovan, January 5, 1959.
3 9
Sachs, Celine, Assembly Square Mall and the Role of Planners as Catalysts in the Renaissance of Somerville; Unpublished Paper, May 19, 1982, p. 4; Assembly Square'Mobile Workshop, Background Papers for American
$2,433,397 for its two Mystic River parcels. One year later, the same
parcels, then owned by First National, were valued at $1,538,537--a drop of 36.8%. Applying the 1959 tax rate of $83.40 per assessed $1,000 reveals
that Somerville lost $74,631 in tax revenue in 1959 due to Ford's disinvestment.40
In the 1960's First National began to contract. In 1963 the corporation employed 1186 at its Somerville center, less than one-half of
41
the combined Ford-First National employment level of the 1950's. By 1976,
First National had 800 employees at Mystic River. Moreover, the 1970's was a period of "shakeout" in the supermarket industry. By 1976, First
National was reduced to 260 retail outlets in New England, New York, and New Jersey.43 Also, at the same time, the WT Grant department store chain went out of business, and was selling its warehouse in Windsor Locks,
Connecticut.4 4
In August, 1976 First National management (the corporation had been renamed Finast) sent a letter to Teamsters Local 829 informing the union that the company was "considering the feasibility of relocating certain operations now being handled at our Somerville warehouse." However, public relations director, Robert Nolan, denied that First National was leaving
4 0Real Estate Tax Commitment Books, City of Somerville, 1958; 1959. 4 1The Planning Services Group, Inc., p. 30.
4 2
Somerville Journal, August 22, 1976; p. 1. 43
Interview of John Matthews by Celine Sachs and Joseph Soley, March 31, 1982.
4 4
30
Somerville, saying, "As far as I'm concerned, it's just a rumor. We're not moving."45 One month later, the Griffin Report of New England, a grocery trade journal, reported: "After many months of planning and study, Finast is in the final stages of deciding where it will go when the warehouse in
Somerville, MA is closed. [Finast is] currently bidding for the W. T. Grant warehouse . . ." The article also reported that McCarthy Transport, a
contract carrier for First National, was planning to close its business. Instead of responding to the intensified rumors of disinvestment, First National management refused to comment.46
During the last week of September, 1976, First National confirmed that it would move to Connecticut by mid-1977. The move made sense from a corporate perspective. Connecticut was the center of the consolidated First National chain, and locating in Southern Connecticut considerably reduced
transportation costs. In addition, the W. T. Grant building was a modern one-level warehouse, and it was judged too expensive to attempt to modernize
the split-level buildings in Somerville.4 7
The announcement by First National was a blow to Somerville's job and tax bases and its status as a manufacturing center. First National was the largest manufacturing firm in Somerville--Swift and Company, the city's second largest manufacturing firm since Ford departed, had closed its
45
Somerville Journal, August 12, 1976; p. 1. 4 6
Somerville Journal, September 23, 1976; p. 6. 4 7
Somerville operation two years earlier.48 Compounding the city's problems, also in September, 1976, the MBTA purchased some of the property owned by Boston and Maine Railroads in Somerville, and leased it back to the B&M, allowing the Railroad to avoid part of its property taxes.49 The city's tax base appeared to be crumbling. Moreover, coming on the heels of Swift's closure, First National's move marked the end of Somerville as a major meatpacking city.
The Somerville government tried to have First National reconsider its decision. The Ralph administration explored lowering the company's property tax bill as an inducement to stay. However, at a meeting with Mayor Ralph, First National executives stated clearly that the supermarket
chain was not leaving because of Somerville's high tax rate. The move was influenced by the changes of the corporation.50
As with Ford's disinvestment, First National left Somerville due to its corporate considerations. In both cases, the city was a bystander as trends in the national economy and the availability of larger tracts of land elsewhere resulted in substantial city and regional job losses. When Ford closed its plant, the city's economy was firmly based in food processing industries. Somerville did not have a similarly strong industrial sector to shore up its economy in the mid-1970's. Somerville's valued real property tax base peaked at nearly $128,000,000 in 1965. On July 1, 1977, the base
4 8 e 4
8Somerville Journal, July 29, 1976; p. 1. 49Somerville Journal, September 23, 1976; p. 1. 50
Ferguson, Laura; Notes on Interviews in Somerville, MA; July 26, 1978; p. 6.
32
was valued at under $121,0000000, and Somerville faced the loss of its largest firm.5 1
5 1
ROOTS OF OFFICE AND RETAIL DEVELOPMENT
The Assembly Square Mall and Office Park, opened four years after First National closed its headquarters, but it can be traced to the 1960's. As was observed earlier, trends indicate that the economies of Northeast urban rings were shifting away from a manufacturing concentration and towards "white-collar" sectors. Extending Interstate 93 north of Boston opened up Somerville's Mystic River Area for commercial development as an export factor in the Somerville economy.
The politics behind urban highway building are complex, justifiably emotional, and beyond the scope of this report. In simple terms, proponents of development often tout highways as needed infrastructure for long-term local and regional economic growth, and short-term public works jobs.
Opposition is varied. The core usually are residents and businesspeople who are threatened with displacement or a lower quality of life by the proposed construction. Opposition is also created because seizure of urban land for public roads removes valuable acres from a city's tax base. Moreover
residential neighborhoods sliced into wedges next to large highways often become undesirable, property values fall, and more tax revenue is lost.
Somerville's economic development planning in the mid-1960's
centered on proposals to build 1-93, and 1-695, an innerbelt highway which in Somerville would have connected 1-93 with Routes 1 and 28. The proposed construction would have created a trapezoid shaped circumferential roadway
34
network around East Somerville and the Mystic River area. Within the
trapezoid, the Somerville Redevelopment Authority envisioned an "Inner Belt Industrial Center" (IBIC). Though Somerville historically has been among the most densely populated cities in the United States, and East Somerville is the most densely settled area in the city, the proposed highway and development program would have forceably changed the neighborhood into a commercial/industrial zone.52
The administration of Mayor Lawrence F. Bretta avidly supported the highway program as an economic development strategy for Somerville. City Hall published pamphlets, newspaper supplements, and "Developing the Inner Belt Urban Renewal Area: A Guide for Prospective Developers." Use of phrases regarding Somerville such as "forward looking city," and "modern
development" were used for the first time in the post-war era as the Bretta government tried to lure investors into Somerville's "planned industrial environment."53
The fight in Somerville during the 1960's over the extension of 1-93 has had profound implications. The struggle in opposition marked the
beginnings of organized reform and progressive politics in the city.
Community mobilization against construction begat: the coalition that soon afterwards instituted rent control; the political career of Sal Albano, considered the most progressive of the city's Board of Aldermen who now
5 2
Boston Sunday Globe, October 17, 1965; Twelve-page color pullout section published by City of Somerville.
5 3
Ibid. Also untitled, undated pamphlet published by the Somerville Redevelopment Authority.
chairs the Board's Housing and Community Development Committee; and the foundation of Lester Ralph's first mayoral campaign in 1969.54 1-93 was extended through Somerville, but sustained opposition in the city and Cambridge prevented the construction of the proposed Inner Belt.
A detailed cost benefit analysis of 1-93 also lies beyond the scope
of this study. However, it is important to note the major impacts brought by the highway. Land taken for 1-93 removed over $2,000,000 in assessed
value from the Somerville tax rolls; loss of this taxable land has cost Somerville $250,000 to $600,000 per year in revenues depending on the tax rate per thousand dollar valuation (see appendix for annual tax rates).55 While the gross economic impact of forced removals and relocations of homes and businesses is measurable, the social costs on East Somerville--both on evictees and the residents who remained--are incalculable. Yet 1-93 has created a commercial/industrial park corridor in the metro-Boston area which now is being mined. John Matthews, currently the Director of Community Development in Medford, and formerly the project manager for the Assembly Square development in Somerville's OPCD, believes that 1-93 has created excellent office, retail and industrial park locations in the north
metro-region. Matthews specifically cited Assembly Square and a multi-use development planned in Medford. He observed: "The office market is being
5 4
Interview with James Kaplan, December 26, 1982. 5 5
Inaugural address of Mayor James F. Brennan; January, 1968. Brennan put the amount of assessed property taken at $2,059,000.
36
established late on 93 because it was the last interstate built. It was only five or six years ago that 1-93 was looked at as an asset."5 6
As a bittersweet footnote, the construction of 1-93 isolated an enclave of eleven homes and eight "mom and pop" businesses near the Mystic River Area. Years later when the city proposed to develop Assembly Square,
its plan required building local roadway infrastructure in place of this handful of buildings. The proposal cited the blighted living conditions and
stagnant small businesses of the dying neighborhood isolated by 1-93 as a justification for the use of eminent domain.57
In 1969, Lester Ralph was elected Mayor of Somerville as part of a city-wide reform movement. Ralph served four tumultuous terms as Mayor, from January, 1970 to January, 1978. His mandate was to promote human services, education, and housing policies on behalf of the city's low to moderate income residents. Under his administration, human services in Somerville expanded widely; a Community School System was established, and long delayed capital improvements were made. Also during the Ralph years, Somerville's funded debt grew from $5,510,000 in 1969 to $29,500,000 in Fiscal Year 1977-78; and the City's tax rate rose from $143.80 in 1969 to $268.10 in FY 1977-78 ($268.10 in 1977 equaled $162.19 in 1969 dollars).
5 6
Interview with John Matthews, March 28, 1984. 5 7
Urban Development Action Grant Proposal, City of Somerville to United States Department of Housing and Urban Development; October 31, 1978; p. 25.
During this period Somerville's assessed tax base fell from $124,000,000 to $121,000,000.58
During the tenure of the Ralph administration, and in the succeeding years, Ralph has been criticized for ignoring the need to expand
Somerville's tax base. Matthews voiced the common criticism of Ralph.
After praising the Mayor's accomplishments in human service fields, he said: Ralph's policies were all short-term oriented. They concentrated on social programs, schools, and public investments . . . and didn't try to attract development dollars to change the [city's] economig base.
Somerville was losing industry, but nobody was coming in.
Though Ralph was not successful in attracting major private
investment, he was concerned about new development in Somerville. In his first inaugural speech, he said:
I am conferring almost daily with businesspeople from within and without he city to encourage them to come into Somerville and build high rise office [buildings]. I shall be touring the city by helicopter with the presidents of two of Boston's largest developing firms in the hgges that they might invest some of their huge capital funds in the city.
Federal policies of the time encouraged planning, but gave scant support to implementation. However, with the availability of federal dollars, Ralph presided over Somerville's first modern development
department. At a forum on planning in Somerville held November 19, 1982 at the MIT-Harvard Joint Center for Urban Studies, Carla Johnston--the first Director of the Office of Planning and Community Development (OPCD)--recalled only one planner worked for the city when Ralph came into office.
5 8
Annual Report, City of Somerville, 1969; FY 1978. 59
Sachs and Soley, March 31, 1982. 6 0
38
This planner advocated far sweeping urban renewal in East Somerville as part of the innerbelt strategy; other forms of economic development were not being considered.
The planners in Ralph's Community Development Department did not have the necessary tools to develop modern office and retail centers in Somerville. First, the office market was bubbling in the CBD of Boston, but had not yet spilled northward; 1-93 was an unknown asset. Secondly, the investment climate in the city was not good. The reform administration was alienated sharply from the "old-guard" that controlled non-mayoral
institutions in Somerville. Moreover highly publicized scandals rocked the city during Ralph's later years as Mayor. During the early-to-middle 1970's the idea of public-private development partnership was a new concept. The volatility within Somerville's "establishment", and the poor public image reinforced by scandal, were not conducive to attracting major private investors who would have to work with the city government. With regard to the Assembly Square development, First National Stores, then Somerville's largest employer and second largest taxpayer, occupied the site where the mall and office park now stand until the final months of Ralph's mayoralty.
COMMERCIAL DEVELOPMENT PLANS FOR THE MYSTIC RIVER AREA
Soon after First National's plans to disinvest from Somerville were confirmed, commercial developers began eyeing the Mystic River Area. The site's proximity to Boston's Commercial Business District, and a heavily populated potential consumer market north of the central city, made it a viable office and retail location. Though First National would not be completely out of Somerville until mid-1978, rumors regarding the sale of its 52 acres began circulating in May, 1977. On May 19th the Somerville Journal reported that the site might be sold to a developer for a "housing, commercial, and industrial complex."6 1
A week later, the Journal described a pair of meetings which
appeared to confirm the rumors of new development. The first meeting was held on May 17th at the offices of Glaser-de Castro-Vitols, architects for the real estate developing firm of Stackhouse Associates. Representing Somerville were Frank Sestito, then Director of OPCD under Ralph, and Mary Tomeo who chaired the City's Board of Assessors. Tentatively, Stackhouse representatives discussed building a shopping mall, two 26-story apartment buildings to house 496 low and moderate income families, and possible
industrial development. Participants at the meeting explored available city
61
40
incentives, including street and parking area construction, and a temporary tax abatement agreement. The second reported planning meeting took place the next day between unnamed "city officials" and John Marino, Commissioner
of Massachusetts Commerce and Development. According to Sestito, the
purpose of this conference was to discuss how the Commonwealth could help support the development. Overall, the projected private investment of the Stackhouse proposal roughly was $46,000,000; $6,000,000 for the First National property and $40,000,000 in development costs.6 2
The significance of these meetings is two-fold. First, they show the time was right for commercial development in the Mystic River area. The growth of suburban retail markets, the construction of 1-93, economic trends away from manufacturing and towards a service economy, and the availability of a pre-assembled 52-acre site presented a development opportunity to the private sector. In addition, because of the previous industrial uses, the existing sewer, water, and power lines on the site were more than adequate for commercial needs. The Ralph administration and other Somerville
institutions wanted the city's economy tied to growth sectors. On May 26th, the Journal hoped that the impending loss of First National could be turned
63
into "a shot in the arm for Somerville." Second, the meetings also outline the negative externalities of Mystic River for commercial
development. Namely, the local roadway network and internal circulation system was inadequate for retail use. Though located off 1-93 with
6 2
Somerville Journal, May 26, 1977, p. 1. 6 3
excellent visibility, access was difficult, and onsite transportation was oriented for railroad cars and trucking. Moreover, building a roadway access system required use of eminent domain powers. The meeting with
Marino clearly indicated that the expensive roadway improvements were beyond the city's means, and outside assistance was needed as a linchpin for the development project.
In July,-1977, the Stackhouse proposal appeared on its way to realization. A joint press conference was held by Ralph; Governor Michael Dukakis; Dennis Stackhouse; Victor Vitolis; and Alan Harberman, the
President of Finast. Finast agreed to sell its land to Stackhouse
Associates within 90 days for $6,000,000. Stackhouse and Vitolis formally revealed a $40,000,000 development plan which included high rise housing, and office and industrial space. The former Ford plant was to be renovated into a 426,000 square foot enclosed shopping mall.6 4
The Stackhouse plan collapsed in three months, and the 90-day option was not exercised.65 Although Stackhouse conducted a market study which
indicated the site was profitable, he could not secure financing for the project. The proposal called for a 150,000 square foot Ann and Hope anchor
store. According to Matthews, the anchor was too large for the planned mall
6 4
Somerville Journal, July 21, 1977, p. 1. 6 5
Somerville Journal, July 27, 1978, p. 1; also Somerville Journal February 23, 1984, p. 1.
42
space (which may have been reduced later to 350,000 square feet.)6 6
Literature on mall development refers to anchors as loss leaders subsidized by developers to attract retail volume to malls. Regional shopping centers,
such as this proposed project, often have at least two anchors. Developers profit by charging high rents to the small tenants which locate in the mall
67
to benefit from the customer flow lured by anchors. The Ann and Hope store was too large for a relatively small regional mall. It was feared that sufficient rentable space would not be available to make the mall profitable, particularly with a second anchor also consuming a large chunk of space. Moreover, Ann and Hope is considered an upscale department store.
Investors may have doubted if an upscale anchor in Somerville could attract volume necessary to sustain a mall, or if smaller outlets which cater to upscale clientele would rent space in Somerville; they often demand a quota of signed leases as proof of a shopping center's viability. The mall with a pre-selected anchor appears to have been the best developed idea of the Stackhouse package. When the retail concept proved unable to jell, the entire proposal fell apart.
The development failure presented City Hall and First National with problems. In FY 1978 (July 1, 1977 to June 30, 1978), First National's property was assessed at a value of $3,332,500 and its gross tax bill
6 6Sachs and Soley, March 31, 1982.
6 7See Urban Land Institute, Shopping Center Development Handbook,
amounted to $893,443, 2.8% of Somerville's tax base.68 It was also
Somerville's largest employer with about 800 jobs well-matched to the city's 69
resident workforce. After Stackhouse, it appeared that the city would be unable to replace those jobs. The job loss combined with the publicity of disinvestment emphasized the image of Somerville as a dying city. From the corporation's perspective, First National was about to be saddled with an unwanted facility, and be responsible for tax payments. It seems unlikely the First National would have defaulted on property it priced for sale at $6,000,000. As time passed the assessed value of the property would
decrease, but so would a commandable sales price. Thus, both the city government--Thomas August became mayor in January of 1978--and First National wanted to promote re-use of the Mystic River site.
In 1978, events crystalized which allowed First National's property to be redeveloped into office and retail space. The Federal government provided the means for infrastructure development through the new Urban Development Action Grant (UDAG) program. UDAG criteria perfectly matched the economic conditions of Somerville, and the program goal of leveraging maximum private with public monies was suited to commercial development projects. In addition, infrastructure development was specifically
6 8
Real Estate Tax Commitment Books, City of Somerville, Fiscal Year 1978.
6 9
44
mentioned as a valid use of the program. Enacted in 1977, the program began operations in 1978.70
Also in 1978, August assumed the Mayor's office. The new
administration hired John Matthews as Federal Funds Coordinator in OPCD. His job was to aggressively seek federal dollars for which Somerville
qualified. Matthews had just completed a Masters of Business Administration program at Carnegie-Mellon University where he analyzed the new UDAG program in depth.7 1
The final and most important piece of the redevelopment puzzle was that the site remained attractive to commercial developers if the roadway problem could be solved. In June, 1978, representatives of the East Bay Development Corporation came to Somerville City Hall with the idea of
creating "the Assembly Square Mall," a retail design based around the theme of the Ford plant in the 1920s.
Founded in.1973, East Bay had become a major retail development firm in its five-year corporate existence. At the time that East Bay expressed interest in the Mystic River area, it had developed or was developing malls in six states, including four in Massachusetts: Billerica, North Weymouth, Woburn, and Chelsea. East Bay built what it termed "community sized
regional malls" tied together with cohesive advertising packages, and
explicitly spurned "large, sprawling malls." In addition, East Bay and the
7 0
United States Housing and Community Development Act of 1977. 7 1
K-Mart chain had a working agreement that the department store would locate anywhere East Bay selected through market analysis. K-Mart has a moderate
income clientele. The dense populations of Somerville, Everett, Medford, and Charlestown, all within a few minutes drive of the proposed mall, made the site appear as an excellent location for K-Mart, far better than for Ann and Hope.7 2
The East Bay concept differed from the Stackhouse proposal in important factors other than the key anchor store. First, East Bay originally had a limited objective to build a shopping mall. It became interested in larger scale development when its New York office, later organized as the Assembly Square Trust, reasoned that the whole 52-acre First National site would have to be developed if a retail mall was to be attractively situated.73 Second, its line of financing was secure.74 Third, in 1978 Somerville had more tools available to help with access problems of the site. Aside from the untested UDAG program, the federal Community Development Block Grant (CDBG) program changed its funding formula
72
UDAG Proposal, October 31, 1978; also Sachs and Soley, March 31, 1982.
7 3
Peattie, Lisa, Rein, Martin; Interview with John Matthews, February 19, 1982.
74
Telephone interview with John Matthews, April 26, 1984. OPCD did not have a back-up plan for roadway development if the UDAG was not
approved. The total of the city's 1978 CDBG equaled the final UDAG. Yet during August's two years as mayor, Somerville received $18,000,000 in
federal aid, both for specific projects and discretionary use in the city within given guidelines. It is possible that alternatives to the UDAG could have paid for adequate roadway infrastructure.