Development of an Internet of Things enabled
manufacturing system for tool wear characterization
The MIT Faculty has made this article openly available.
Please share
how this access benefits you. Your story matters.
Citation
Kumaravel, Balasaravanan T., et al. “Development of an
Internet of Things Enabled Manufacturing System for Tool Wear
Characterization.” 2017 IEEE 3rd International Symposium in
Robotics and Manufacturing Automation (ROMA), 19-21 September,
Kuala Lumpur, Malaysia, 2016, IEEE, 2017, pp. 1–6.
As Published
http://dx.doi.org/10.1109/ROMA.2017.8231733
Publisher
Institute of Electrical and Electronics Engineers (IEEE)
Version
Author's final manuscript
Citable link
http://hdl.handle.net/1721.1/117397
Terms of Use
Creative Commons Attribution-Noncommercial-Share Alike
Development of an Internet of Things enabled Manufacturing system for
tool wear characterization
Balasaravanan T. Kumaravel*+, R. Bhattacharyya*, J. Siegel*, S.E. Sarma*, Arunachalam N.+ , + - Indian Institute of Technology Madras ; * - Massachusetts Institute of Technology
Abstract— The Internet of Things (IoT) can reduce
manufacturing cost, improve uptime, and help operators gain process insights. In this paper, we develop a system architecture for an IoT-enabled manufacturing system and demonstrate it on a bench-top milling machine. We explore on how we can build such a laboratory-scale system with commonly available, low-cost electronic sensors. Factors for designing such a system have been explored. The designed manufacturing system can take manufacturing inputs as G-Codes from the internet via a website as well as stream the data from several sensors to the internet. Engineering implementation of the system as well as its underlying ideology have been discussed. Micro Electro-Mechanical System (MEMS) sensors have low cost, smaller form factor as well as tend to work with a variety of IoT enabled systems. This work evaluates the feasibility of using them for condition monitoring in manufacturing. These systems embody a sort of primary unit for enabling the ‘Smart Factory’ revolution.
Keywords—IoT, Industry 4.0, Manufacturing automation, MEMS sensing, Industrial automation, Cyber Physical System
I.
I
NTRODUCTIONThe advent of Computer Numeric Control (CNC) and robot assisted manufacturing led to a significant amount of research in the fields of optimization and automation of manufacturing processes. One of the most prominent scientific advancements in this century is wireless networking [1] of factory machines, to obtain process data, analyzing their characteristics and monitoring the health of the machine. These recent developments coupled with a boom of various data analytics techniques, have recently driven the entire manufacturing industry towards the concept of Smart Factories[2]. This trend broadened the scope of research in these IoT enabled manufacturing systems. Such research has grown from analyzing the behavior of a single manufacturing machine towards analyzing a group of networked machines. An optimization exercise leading to even a small increase in productivity could mean significant cost savings to the industry. Automation of a factory like this requires the machines to talk [3] to each other, send and receive the data to various human and robotic agents working in the factory floor which can be facilitated through a well-designed network of IoT systems working in tandem with each other.
Industry 4.0 which is also known as the fourth industrial revolution is based on the pillars [4] of manufacturing automation, M2M communications, and data analytics. Having gone through the stages of Mechanization,
Mass Production, Computer and Automation the industry is now moving towards an era where the boundary between information technology and manufacturing is becoming thinner with the evolution of advanced cyber-physical systems. The aim of the concept is to achieve a ‘Smart Factory’. This involves the creation of a parallel ‘Virtual Factory’ [5] alongside the physical one. The future of manufacturing would involve allotting jobs, controlling machines, analyzing machining data, monitoring machines and adapting machining real-time through using remote cloud services on the world wide web. The advantages of such a system are limitless. Possible applications include optimizing tool usage, predicting failures, enabling industrial machines as well as stakeholders with more data. These features lead to cost savings [6] in implementing Smart Factories.
To enable research on these new kinds of factories, we have built a CNC milling system integrated with ‘makerspace-type’ sensors. A network of these sensors feeds data to a central microprocessor unit. The sensors’ data is then analyzed to check for correlation between their output measurement and tool wear. Since the microprocessor is connected to internet, it becomes possible to do the analysis and post-processing either locally or in cloud. Furthermore, the data available on cloud can be accessed remotely and processed rapidly. Such a platform allows us to carry out laboratory scale experiments and research, for developing the next generation factory machines. We are not aware of any prior attempts that has tried to achieve this kind of laboratory scale IoT enabled CNC machines using commonly available, low-cost sensors.
II. PREVIOUS WORK
A. Industry 4.0
Industry 4.0 is a common term to denote the next impending industrial revolution. This industrial revolution is based on an extensive implementation of cyber-physical systems in industries. Jay Lee [7] talks about five tiered CPS architecture for implementation of IoT in manufacturing systems. It structures the way in which smart factories can be brought about. This work incorporates the first two levels of the 5C architecture, ‘smart connection’ level: which forms the majority of the paper and ‘data to information’ level: which has been touched upon using a simple test case research. The smart connection level takes care of data acquisition from the different subsystems and streamlining it through a robust channel. This can be done in dfifferent ways. The architecture for data acquisition might be that data is directly obtained by
# - This work was done while Balasaravanan T. Kumaravel (tkbala.iitm@gmail.com) was a visiting student at MIT and subsequently continued as his bachelors’ thesis work at IITM
sensors or may be obtained from a micro controller, intermediate software and enterprise manufacturing systems.
There are two important factors at smart connection level that are important and have been considered in this work. First, due to the high diversity and quantity of the various types of data, an effortless and lag free method is required to manage data acquisition procedure and transferring data to the centralized node. The second consideration is that the centralized node should be able to handle several protocols such as serial, I2C, SPI and etc. Selecting proper sensors (type, sampling, operating range, protocols etc.,) .
Some key design principles [8] for a smart factory include: (1) Interoperability - which is a measure of how effectively a diverse set of devices can work in tandem with each other, (2) Virtualization – where every significant physical device has a virtual parallel which reflects all the parameters and characteristics of the physical device, (3) Decentralization - Every machine/stage has a fair amount of local health monitoring and management as opposed to a scheme where all the data is sent to centre and collectively processed there, (4) Modularity - Components of the entire factory are segregated into modules performing similar tasks and can be separately diagnosed and replaced, (5) Real-time - There is minimal delay in correspondence between the physical and virtual entity.
In this work the efforts have been made to design and construct the system so as to incorporate as many of these design principles in the various subsystems. These are discussed in section III.
B. Choice of sensors
The sensors used to monitor milling machines and tools have varied over time. A study of different sensors used in the past was carried out to choose the sensors necessary for building this platform. From 1996 [9], spindle power and current measurements have been used for estimating spindle torque and indirectly the tool wear. Cutting forces were measured using dynamometers, but these measurements were process dependent. This made generalization for in-process tool wear monitoring difficult. In 1998 [9], vibration characteristics measured by acoustic emission measurements were used for in-process tool wear monitoring. But, acoustic emissions are sensitive to ambient noise present in the machining environment. By this time, mass production using CNC machine started gaining prevalence. Production times were decreased significantly, but there is still potential to increase the efficiency further through reducing time spent checking quality, while costs can be reduced by eliminating unexpected tool failures. Tool condition was difficult to measure in process and surface roughness or surface finish measurement required the removal of work piece every time.
McBride et al. [10] used non-contacting optical fibre for tool condition monitoring. However, this method was not accurate enough for industrial usage. Young [11], used embedded thermocouples, optical pyrometers and altered radio isotopes for measuring tool temperatures. Though, the IR camera could not capture the temperature information of hidden surfaces, it proved sufficient to establish the presence of a strong correlation between cutting temperature and tool wear. In 1997, Chen and Black [12] used data from a dynamometer
and processed the data using a fuzzy network. This yielded close to 90 percent accuracy. As a part of future work they also suggested that, using an accelerometer in place of a dynamometer might yield similar results. Since accelerometers are significantly cheaper than dynamometers, this would potentially reduce the cost of our system. Further, dynamometers have a negative impact on system rigidity. This serves as a motivation to utilize accelerometer for machine condition monitoring in our developed system. In 1998, their system was tuned to achieve an accuracy of 94 percent. In 1999, Chen and Chen [13] used accelerometers instead of dynamometers. Though they were able to get accurate results, they noted that the accuracy of the result obtained could be affected by various factors like cutting parameters, tool and work piece material dependent thresholds, false tool breakage detection in the presence of chatter and vibration.
Based on the results of these studies in this work we decided to implement an accelerometer, spindle motor current sensor and temperature sensor. Information obtained from the parameters should be usable for developing prognostics model and current condition monitoring. With the help of these models, a real time adaptive input should be given to the physical system to optimize performance.
III. SYSTEM CONSTRUCTION
A. The Milling Machine
In this work, we used a Sherline 8020 series mini CNC milling machine to model the characteristics of an industry-grade CNC milling machine at a smaller scale. The machine houses a 90V, 60W spindle motor, which is capable of rotating the spindle from 70 – 2800 rpm. The feed drives are controlled by three 3.3V NEMA23 DC stepper motors with 9.7 Kg-cm of torque and step angle of 1.8 deg. The stepper drives are controlled by a Sherline stepper motor controller which is interfaced through a IEEE 1284 port from a computer. The computer consists of an operating system with a Linux kernel and runs the EMC2 open architecture controller to facilitate the control of the CNC machine.
B. Sensors and Other Hardware
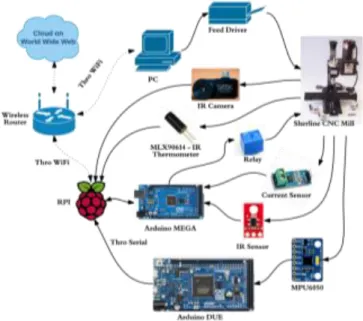
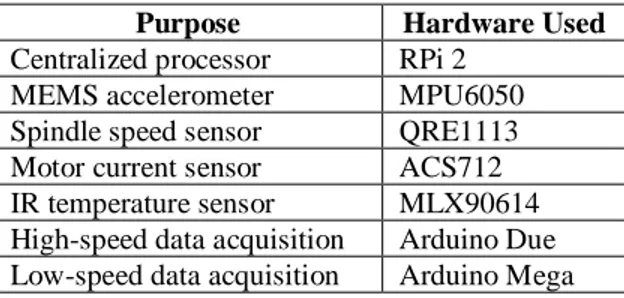
In this work, we have selected commonly available makerspace electronic sensors, to sense and monitor different parameters. The Table 1 shows the list of such electronics used in this work. These have the advantage of being low-cost, having small form factor as well as the capability to work with a variety of embedded system platforms. Hence, each of the sensor hardware is replaceable with any other making the system modular and interoperable. Figure 1 shows the system architecture and gives the flow of information and an idea of how these different sub-systems interact with each other. Table 1 – List of ‘Makerspace-type’ Electronics used
Purpose Hardware Used
Centralized processor RPi 2 MEMS accelerometer MPU6050 Spindle speed sensor QRE1113 Motor current sensor ACS712 IR temperature sensor MLX90614 High-speed data acquisition Arduino Due Low-speed data acquisition Arduino Mega
Accelerometer: A MPU6050 (MEMS accelerometer) and a
Dyatran 3145AG (Industry-grade accelerometer) were used to obtain the vibration data for our system. The idea was to see if it is possible to make similar inferences with the MEMS accelerometer compared to the industry-grade Dyatran accelerometer. To ensure tether-free and fast sampling, an Arduino Due (having a 32-bit ARM core) was used to sample the MPU6050 sensor at a 1kHz frequency. It is interfaced using the standard I2C protocol, meaning any other I2C accelerometer would work, thereby enhancing interoperability of the system. The Dyatran 3145AG was sampled at 20kHz using a PC with the help of Dewetron’s Dewe 43 Data Acquisition Device. The setup is shown in Figure 2.
Figure 2 – Accelerometers mounted on the spindle housing; MPU6050 (Left), Dyatran 3145AG (Right)
Spindle Motor Current: Spindle motor current during the
machining process was measured using an ACS712, which is a MEMS hall effect based current sensor. It was calibrated and its analog output varies linearly as a function of spindle motor current. It was then sampled and digitized using a 10-bit ADC in an Arduino Mega and subsequently sent to the RPi.
Spindle Speed: The spindle speed was measured using a IR
based encoder, which was used to detect any anomalous speed variation. The IR sensor used in this system is the SparkFun QRE1113. Black strips are mounted on top of the spindle, and the sensor counts the number of black strips per unit time in order to compute the speed of the spindle. A relay was used to toggle the spindle power.
Temperature and Temperature Profile: The temperature at the
tool-work interface was measured using the MLX90614-KSF-BAI-000-TU I2C infrared thermometer. We additionally captured images using a Seek Thermal IR camera triggered by the RPi. Both sensors were calibrated using a thermocouple and known reference temperatures. However, in our analysis we were unable to make get any useful inference on the tool wear data based on these obtained temperature data. Nevertheless, the system is useful for detecting any abnormal temperature spikes due to factors like a failed cutting edge or unsuitable machining parameters.
C. Sensor Interface and Gateway to the server
We used a Raspberry Pi 2 (RPi), running the Raspbian operating system as a gateway to our server This can be seen in Figure 1, where all sensor data has to pass through RPi in order to reach the cloud where it is processed. Since the RPi is capable of serving as a hub to interface with a variety of sensors, it serves a crucial role in enabling interoperability with the rest of our system. For this reason, if someone prefers to use/add another type of sensor than the ones shown in Figure 1, they can easily make this transition with minimal changes to the system. A large and growing user community for the RPi facilitates interfacing with different types of sensors. Since the RPi has 1GB of RAM and a 900 MHz processor as well as a native support for Ethernet connectivity, it can also be used to locally process the data as well as to perform data compression so as to achieve high data transfer rates to the Cloud server. In addition, many contemporary scientific data acquisition systems can be interfaced with a RPi. This enables our platform and applications to be scaled to larger industry grade manufacturing systems with minimal rework.
D. Software
The software consists of a Python program that controls the CNC milling machine using the EMC2/LinuxCNC controller. On the Raspberry Pi, there is another Python program which constantly acquires the data from the sensors, preprocesses them and sends them to an SQL database on a local server for further post-processing. The Python software developed in this work implements the aspects of multiprocessing, leveraging the quad-core ARM processor of the Raspberry Pi. The multiprocessing aspect of the software allows the Raspberry Pi to parallel processes four tasks. One thread each for data acquisition from MPU 6050, Arduino Mega, Arduino Due and one thread for data storage (local/to www) and display to the user. On the hardware side, the two Arduinos parallelize data acquisition and enable tether-free data management, as recommended by Jay Lee et al [13].
E. Web Interface
The web interface utilizes a HTML5 front end. All the backend queries are handled by PHP. The sensor data is fed to the website using Python’s urllib method in the Raspberry Pi.
This is processed by a PHP backend program which then stores and updates HTML parameters to display it in the website. For control of the machine, G-Codes are fed into HTML input of the website. A PHP backend program, processes this and updates it into a txt file. The txt file is then processed by the PC and is fed to the CNC milling machine. A web interface allows to create value opportunities through web services.
IV. EXPERIMENTAL WORK
In the experimental evaluation of the system, milling operations were selected and machining was done for three passes under the same spindle speed, feed and depth of cut. The experiment was carried out by machining a mild steel work piece of dimensions 114 mm x 48 mm x13 mm and high speed steel (HSS) tool. The tool was 7mm in diameter and had four cutting edges (flutes). The raw work piece was initially milled using the vertical milling machine to rough dimensions. To acquire the flatness of the work piece, the chevalier grinding machine was used to finish the work piece. Since the work piece is made of mild steel, it was clamped using an electromagnetic chuck. Ten passes of grinding with depth of cut = 0.01mm was done to achieve the required flatness. It was verified using a micrometer dial gauge.
For carrying out the experiments, Sherline 2010 CNC milling machine was used with a LinuxCNC Electronic Machine Controller. Spindle speed was varied manually to target 1500 rpm, 2000 rpm and 2500 rpm unloaded using the reference from the spindle speed measurement that was set up. Each milling tool was operated at one of the above spindle speeds and was machined with a feed rate of 40 mm/min and depth of cut of 0.05 mm for a length of 40mm. After every pass, images of all the edges in the milling tool were captured using a STEMI 2000 CS stereo microscope using a ring light illumination. Subsequent measurements in the captured image were made using the ImageJ software.
V. RESULTS AND DISCUSSION
The data collected from the sensors during the nine experiments were analyzed. A typical spindle speed vs spindle current plot is shown in Figure 3. It is observed that spindle speed remains almost constant with a maximum 10 % variation from expected value. There is a decreasing trend which is observed in the spindle motor current. This could be due to the presence of the 0.005 mm taper that was present across the machining direction in the work piece, though more rigorous analysis is required to actually confirm this. The raw data obtained from the MEMS accelerometer are compared with that obtained using the IEPE accelerometer to check for any similarities. The time domain signal of the accelerometer readings was then filtered and various time domain parameters like kurtosis, skewness, energy and entropy were extracted. Attempts were made to correlate the wear with the extracted parametric data from the accelerometer MPU6050. To show that the MEMS accelerometer is a feasible option to replace the currently used industry-grade accelerometers, it is required to extract the dominant frequencies from responses of both accelerometer and see how well they correlate with each other.
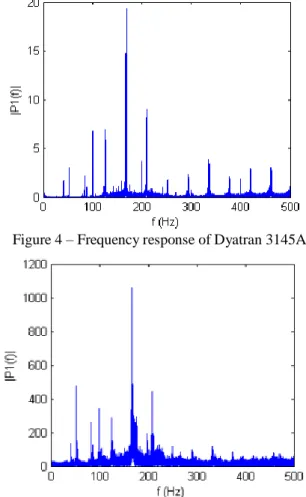
Figure 3 –Time series of a typical spindle speed current Typical frequency responses from a cutting pass are shown as measured using Dyatran 3145AG and MPU6050 in Figure 4 and Figure 5. It can be seen that most of the peaks present in the single-sided amplitude spectrum of Dyatran 3145AG are also present in MPU6050. However, the MPU6050 loses out on the 400-500 Hz region. This problem can be resolved by implementation of a circuit/sensor having a higher frequency bandwidth for acquisition of data from the MEMS accelerometer. In addition to the requirement of a better hardware, there is a need to refine the frequency response of the acceleration obtained using MPU6050 based accelerometer
Figure 4 – Frequency response of Dyatran 3145AG
Savitzky-Golay filter
It appears that the FFT response of the MPU6050 itself is embedded with some kind of noise. So, it seems like a good idea to do some kind of de-noising the signals in its Fourier spectrum domain itself. The filter implemented should obtain something like a trend line for the flat regions of the FFT as well as it should retain the significant peaks (or outliers) present in the FFT response. A filter which shows a similar response is the Golay smoothing filter. Savitzky-Golay filtering is a type of generalized moving average filter which are generally used for the smoothing the data, thereby reducing high frequency noises. But, if the peaks in a signal are quite narrow, the filter is not very effective for that particular region. In our case of applying the method to FFT response, this proves to be helpful. Therefore, to retain the narrow peaks, a quadratic Savitzky-Golay filtering method is used in this work. The filter enhances the Signal to Noise Ratio as well as sufficiently retaining the base trends of the signal. It works by performing a series of convolution operations on adjacent parts of the signal. The filter used for this work implements a window size of 447 that was obtained through scanning of performances for different window sizes, and a linear least squares loss function.
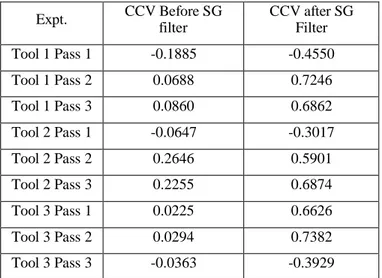
Table 2 - Cross-correlation values before and after SG filter Expt. CCV Before SG filter CCV after SG Filter Tool 1 Pass 1 -0.1885 -0.4550 Tool 1 Pass 2 0.0688 0.7246 Tool 1 Pass 3 0.0860 0.6862 Tool 2 Pass 1 -0.0647 -0.3017 Tool 2 Pass 2 0.2646 0.5901 Tool 2 Pass 3 0.2255 0.6874 Tool 3 Pass 1 0.0225 0.6626 Tool 3 Pass 2 0.0294 0.7382 Tool 3 Pass 3 -0.0363 -0.3929
The effectiveness of the Savitzky-Golay filter is evaluated by computing the cross-correlation of the FFT waveforms before and after the implementation. While it might not be appropriate to rely on correlation values (because cross-correlation checks for cross-correlations in all parts of the signal, whereas we require only cross-correlations near the peaks), this method can be used to evaluate the relative performance of the Savitzky-Golay filter and choice of window size. The window size giving maximum cross-correlation for most of the nine experiments is chosen. The optimal window size for the Savitzky-Golay filter is found to be 447 and the mean cross-correlation of the 9 experiments is 0.6815. The table of cross correlation values (CCV) of the signal obtained using MPU6050 and Dyatran 3145AG is given in Table 2. Though the optimal window size is seen to be very effective for most experiments, it fails in some cases. It can be seen that after the application of SG filtering, it becomes easier to extract the
dominant frequencies present in the system by using local maxima search algorithms.
Figure 6 – Frequency response of MPU6050 after SG filtering
Tool wear data
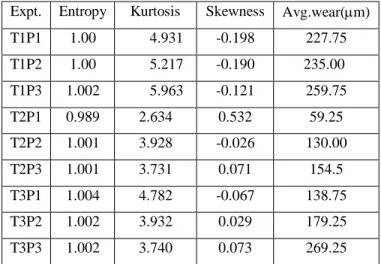
A STEMI 2000 CS stereo microscope was used to capture images of milling tool after each pass. This image was then processed in ImageJ software to obtain the value of tool wear. We check for any correlations between wear and time domain parameters of accelerometer signals such as skewness, kurtosis, entropy and energy. However, before any useful information can be extracted from the signal, it has to be first filtered for high frequency noises. This is done using a low pass butter worth filter. Typical images and wear measurement for a machine tool is shown in Figure 7. Wear measurement is done in each of the tool blades and their average is taken as the total tool wear. These wear measurements are then compared with entropy, skewness and Kurtosis parameters extracted from Dyatran 3145AG and MPU6050 (SG-Filter processed) time series data and tabulated in Table 3 and Table 4 (Note:- T1P2 refers to Tool 1 Pass 2).
Figure 7 – Tool 1 – before (top) and after (bottom) machining Though, it is observed that none of the time domain parameters show a direct correlation with tool wear. However, there is also a strikingly significant trend that time domain parameters of signals of both the accelerometer varies similarly
for most curves. This further provides support in favor that MEMS based accelerometer could be used for analysis of vibration modes in milling machine.
Table 3 - Entropy, Kurtosis and Skewness of accelerometer signal of MPU6050
Expt. Entropy Kurtosis Skewness Avg.wear(m) T1P1 1.00 4.931 -0.198 227.75 T1P2 1.00 5.217 -0.190 235.00 T1P3 1.002 5.963 -0.121 259.75 T2P1 0.989 2.634 0.532 59.25 T2P2 1.001 3.928 -0.026 130.00 T2P3 1.001 3.731 0.071 154.5 T3P1 1.004 4.782 -0.067 138.75 T3P2 1.002 3.932 0.029 179.25 T3P3 1.002 3.740 0.073 269.25
Table 4 - Entropy, Kurtosis and Skewness of acceleration signal of Dyatran 3145 AG
Expt. Entropy Kurtosis Skewness Avg.wear(m) T1P1 1.142 4.641 -0.119 227.75 T1P2 1.142 5.152 -0.176 235.00 T1P3 1.159 6.091 0.002 259.75 T2P1 1.423 3.052 0.188 59.25 T2P2 1.247 4.703 0.053 130.00 T2P3 1.259 3.775 0.074 154.5 T3P1 1.271 4.628 -0.076 138.75 T3P2 1.242 4.035 0.049 179.25 T3P3 1.281 3.928 0.071 269.25 VI. CONCLUSION
Industrial Internet of Things, Smart Factories, Industry 4.0 are some of the trending terms in the field of Intelligent Manufacturing today. Many techniques and systems are now being developed to make manufacturing systems more open to data exchange, process their data real-time and carry out adaptive machining. Very few systems have been developed so far to realize IoT enabled manufacturing systems. Some architectures, guidelines and design principles have been proposed in the literature for development of smart factories, but none very specific to a particular manufacturing system.
In this research, an IoT architecture for a table top CNC milling machine has been designed. It has been deployed
with necessary hardware, software and web interface. The sensors used in these system are low-cost, have small-size and interoperable with different IoT systems. A feasibility analysis of using low-cost, IoT-enabled embedded Micro-Electro-Mechanical System (MEMS) for milling process using a simple test case research was carried out on the developed platform. It is found that the MEMS accelerometer sensor has the scope for substituting for an industry grade sensor. Savitzky-Golay filtering method was used to refine the frequency domain response of the accelerometer and optimal window size was found for maximizing the cross-correlation between the responses of MEMS MPU6050 accelerometer and the IEPE Dyatran 3145AG.
ACKNOWLEDGEMENT
We would like to thank Dr. B. Ravindran who have been a constant support for the work by providing valuable advice towards data processing. We would also like to thank Department of Mechanical Engineering, IIT Madras for allowing us to purchase equipment in order to build the system to carry out the research.
REFERENCES
[1] Wright, Paul, et al. "Condition monitoring in end-milling using wireless sensor networks (WSNs)." Transactions of NAMRI/SME 36 (2008). [2] Lucke, Dominik, et al. "Smart factory-a step towards the next generation
of manufacturing." Manufacturing systems and technologies for the new
frontier (2008): 115-118.
[3] Kim, Bo Hyun, et al. "Application of M2M technology to manufacturing systems." In Information and Communication Technology Convergence
(ICTC), 2010 International Conference on, pp. 519-520. IEEE, 2010.
[4] Wang, Shiyong et al. "Towards smart factory for industry 4.0: a self-organized multi-agent system with big data based feedback and coordination." Computer Networks 101 (2016): 158-168.
[5] Jain, Sanjay, et al. "Virtual factory: an integrated approach to manufacturing systems modeling." International Journal of Operations &
Production Management 21.5/6 (2001): 594-608.
[6] Tao, Fei, et al. "Cloud manufacturing: a computing and service-oriented manufacturing model." Proceedings of the Institution of Mechanical
Engineers, Part B: Journal of Engineering Manufacture 225, no. 10
(2011): 1969-1976.
[7] Lee, Jay, et al. "A cyber-physical systems architecture for industry 4.0-based manufacturing systems." Manufacturing Letters 3 (2015): 18-23. [8] Hermann, Mario, et al. "Design principles for industrie 4.0 scenarios."
In System Sciences (HICSS), 2016 49th Hawaii International Conference
on, pp. 3928-3937. IEEE, 2016.
[9] Chen, Jacob Chi-Ming. "In-process tool wear prediction system development in end milling operations." (2003).
[10] McBride, R., et al. "Detection of acoustic emission in cutting processes by fibre optic interferometry." Measurement Science and Technology 4, no. 10 (1993): 1122.
[11] Young, Hong-Tsu. "Cutting temperature responses to flank wear. " Wear 201, no. 1 (1996): 117-120.
[12] Chen, J. C., and J. T. Black. "A fuzzy-nets in-process (FNIP) system for tool-breakage monitoring in end-milling operations." International
Journal of Machine Tools and Manufacture 37, no. 6 (1997): 783-800.
[13] Chen, Joseph C., and Wei-Liang Chen. "A tool breakage detection system using an accelerometer sensor." Journal of Intelligent