HAL Id: hal-00301182
https://hal.archives-ouvertes.fr/hal-00301182
Submitted on 20 Apr 2004HAL is a multi-disciplinary open access
archive for the deposit and dissemination of sci-entific research documents, whether they are pub-lished or not. The documents may come from teaching and research institutions in France or abroad, or from public or private research centers.
L’archive ouverte pluridisciplinaire HAL, est destinée au dépôt et à la diffusion de documents scientifiques de niveau recherche, publiés ou non, émanant des établissements d’enseignement et de recherche français ou étrangers, des laboratoires publics ou privés.
Release and dispersion of vegetation and peat fire
emissions in the atmosphere over Indonesia 1997/1998
B. Langmann, A. Heil
To cite this version:
B. Langmann, A. Heil. Release and dispersion of vegetation and peat fire emissions in the atmosphere over Indonesia 1997/1998. Atmospheric Chemistry and Physics Discussions, European Geosciences Union, 2004, 4 (2), pp.2117-2159. �hal-00301182�
ACPD
4, 2117–2159, 2004Release and dispersion of vegetation and peat
fire emissions
B. Langmann and A. Heil
Title Page Abstract Introduction Conclusions References Tables Figures J I J I Back Close Full Screen / Esc
Print Version Interactive Discussion
© EGU 2004 Atmos. Chem. Phys. Discuss., 4, 2117–2159, 2004
www.atmos-chem-phys.org/acpd/4/2117/ SRef-ID: 1680-7375/acpd/2004-4-2117 © European Geosciences Union 2004
Atmospheric Chemistry and Physics Discussions
Release and dispersion of vegetation and
peat fire emissions in the atmosphere
over Indonesia 1997/1998
B. Langmann and A. Heil
Max-Planck-Institut f ¨ur Meteorologie, Hamburg, Germany
Received: 6 February 2004 – Accepted: 31 March 2004 – Published: 20 April 2004 Correspondence to: B. Langmann ([email protected])
ACPD
4, 2117–2159, 2004Release and dispersion of vegetation and peat
fire emissions
B. Langmann and A. Heil
Title Page Abstract Introduction Conclusions References Tables Figures J I J I Back Close Full Screen / Esc
Print Version Interactive Discussion
© EGU 2004
Abstract
Smoke-haze episodes caused by vegetation and peat fires affect parts of Indonesia every year with significant impacts on human health and climate. Particularly fires in degenerated peat areas release huge amounts of trace gases and particles into the atmosphere, exceeding by far the emissions per unit area from fires in surface vege-5
tation. However, only limited information is available about the current distribution of pristine and degenerated peat areas in Indonesia, their depth, drainage condition and modification by fire. In this paper we study the contribution of peat fire emissions in Indonesia during the strong El Ni ˜no event in 1997/1998. A regional three-dimensional atmosphere-chemistry model is applied over Indonesia using two emission estimates, 10
which only differ in the size of the fire affected peat areas. We evaluate simulated rain-fall and particle concentrations by comparison with observations to draw conclusions on the peat area burned.
1. Introduction
Every year during the dry season, land clearing fires are set in Indonesia. Usually the 15
burning activities cease in October/November with the beginning of the northern mon-soon rains. The strong El Ni ˜no of 1997/1998, however, lead to severe drought con-ditions. Land-clearing fires became uncontrolled particularly on Kalimantan (Borneo) and Sumatra. Reduced convective activity during August until October 1997 favoured wide-spread dispersion of the vegetation fire emissions causing several episodes of 20
intense smoke-haze that affected also Malaysia and Singapore. Close to the vege-tation fires at Palangkaraya on Kalimantan and Jambi on Sumatra up to 4000 µg/m3 total particulate matter was measured, exceeding the Indonesian national ambient air quality standard by a factor of 15 (Heil and Goldammer, 2001).
Levine (1999) estimated the emissions released from the fires on Kalimantan and 25
ACPD
4, 2117–2159, 2004Release and dispersion of vegetation and peat
fire emissions
B. Langmann and A. Heil
Title Page Abstract Introduction Conclusions References Tables Figures J I J I Back Close Full Screen / Esc
Print Version Interactive Discussion
© EGU 2004 only 20% of the area burned to consist of peat areas, these regions contributed about
90% of the gaseous and particulate fire emissions. The reason is the huge storage of organic matter in the peat deposits that has accumulated over the last 5000 to 10 000 years (Rieley et al., 1995). The majority of the estimated 170 000 to 270 000 km2 of peat swamps in Indonesia is deeper than 1 m, frequently more than 15 m in depth 5
(Rieley et al., 1997). Peat areas have become increasingly susceptible to fire in the past decades due to an intensification of their drainage for land conversion purposes.
The amounts of gaseous and particulate matter emissions released from peat fires in Indonesia are still rather uncertain, as are their chemical composition (Langmann and Graf, 2003). Fires in peat areas may affect both the above-ground vegetation as well 10
as the below-ground organic soil which can burn repeatedly at different depths. Peat fires are typically low-temperature, smouldering fires which are difficult to detect from space. The determination of emissions released from peat fires is further complicated by the necessity to characterise additionally the soil and the depth of the soil burned. Generally, large uncertainties exist in the determination of the area burned during fire 15
episodes. These uncertainties are reflected in the estimated areas of fire damaged peat lands in 1997 in Indonesia which range from 14 500 to 68 047 km2 (Page et al., 2002) resulting in a calculated range of 480 to 2570 Mt of carbon released into the atmosphere.
Recently, global climatological biomass burning emission inventories have been im-20
proved by means of satellite data to include an interannual variability (e.g. Duncan et al., 2003). However, peat fires as a major source for gases and particles are not included in these inventories explicitly. In this paper we present a spatial-temporal resolved vegetation and peat fire emission estimate for Indonesia during 1997/1998. We applied the three-dimensional regional atmospheric-chemistry model REMO (RE-25
gional MOdel) introduced in Sect. 2 over the region of Indonesia with two different fire emissions estimates described in Sect. 3. The emission estimates are evaluated by comparing the modelled atmospheric aerosol load with measurements (Sect. 4). Sec-tion 5 draws conclusions and gives an outlook.
ACPD
4, 2117–2159, 2004Release and dispersion of vegetation and peat
fire emissions
B. Langmann and A. Heil
Title Page Abstract Introduction Conclusions References Tables Figures J I J I Back Close Full Screen / Esc
Print Version Interactive Discussion
© EGU 2004
2. Model description
The regional three-dimensional on-line atmosphere-chemistry model REMO (Lang-mann, 2000) determines at every model time step the physical and chemical state of the model atmosphere. The dynamical part of the model is based on the regional weather forecast model system EM/DM of the German Weather Service (Majewski, 5
1991). Beside the German Weather Service physical parameterisations, those of the global ECHAM-4 model (Roeckner et al., 1996) have been implemented in REMO (Ja-cob, 2001) and are used for the current study. The prognostic equations for surface pressure, temperature, specific humidity, cloud water, horizontal wind components and aerosol mass mixing ratios are written on an Arakawa-C-grid (Mesinger and Arakawa, 10
1976).
In the current model set-up, one prognostic species is included, representing the atmospheric aerosol without further differentiation according to the chemical composi-tion and size distribucomposi-tion. Particle emissions are assumed to be released into the first model layer, because smouldering fires which are typical for fires in peat areas gener-15
ally do not cause strong convective lifting. Although secondary aerosol formation may play an important role, it is not included in the present study. The particle transport is determined by horizontal and vertical advection according to the algorithm of Smo-larkiewitz (1983), convective up- and downdraft by a modified scheme of Tiedtke (1989) and vertical diffusion after Mellor and Yamada (1974). Due to the elevated sulfur con-20
tent and hygroscopicity of Indonesian vegetation and peat fire aerosols (Langmann and Graf, 2003) particle deposition is calculated as for sulfate. Dry deposition velocities are determined as described by Walcek et al. (1986) dependent on the friction velocities and stability of the lowest model layer. Wet deposition is computed according to Wal-cek and Taylor (1986) by integrating the product of the grid-averaged precipitation rate 25
and the mean cloud water concentration, assuming 100% solubility of the particles. For this study the REMO model was applied with 20 vertical layers of increasing thickness between the Earth’s surface and the 10 hPa pressure level using terrain
fol-ACPD
4, 2117–2159, 2004Release and dispersion of vegetation and peat
fire emissions
B. Langmann and A. Heil
Title Page Abstract Introduction Conclusions References Tables Figures J I J I Back Close Full Screen / Esc
Print Version Interactive Discussion
© EGU 2004 lowing hybrid pressure-sigma coordinates. The model domain covers Indonesia and
Northern Australia (Fig. 1) with a horizontal resolution of 0.5◦ and 101 grid points in longitude and 55 grid points in latitude with the lower left corner at 91◦E and 19◦S. A basic model time step of 5 min was chosen. REMO can be applied principally in two modes, the so-called “climate mode” or the “forecast mode”. In the climate mode the 5
model is initialised once and then run continuously with an update of the meteorolog-ical analysis data every 6 h at the lateral model boundaries. Between these six hour intervals the analyses are interpolated linearly in time. Meteorological analysis data are taken from European Center for Medium Range Weather Forecast with time vary-ing fields of surface pressure, temperature, horizontal wind velocities and moisture. In 10
the forecast mode the model is started at 0 UTC every day to compute a 30 h forecast and the analysis data are also updated every 6 h. The first six hours of the consecutive meteorological forecasts are neglected to account for a spin-up time. By starting the model again every day the internal model variability is suppressed with the purpose to force the model to stay close to the observed weather situation. Particulate matter 15
processes, however, are calculated continuously like in the climate mode. This is done by simulating meteorology only in the first six hours of each 30 h forecast. Then, com-bined particle matter and meteorology calculations continue for 24 h starting with the particulate matter information from the last time step of the previous forecast.
Previous studies and evaluation with the REMO atmosphere-chemistry model give 20
confidence in the ability of the model to reproduce the physico-chemical state of the at-mosphere. The model has been applied with various trace species modules to study for example summer smog episodes over Europe (e.g. Langmann et al., 2003), to deter-mine the distribution and radiative forcing of sulfate aerosols over Europe (Langmann et al., 1998) and the Arctic region and to investigate CO2 and222Rn fluxes and distri-25
butions over Euro-Siberia (Chevillard et al., 2002a, b). Recently, stable water isotope physics has been implemented in REMO.
ACPD
4, 2117–2159, 2004Release and dispersion of vegetation and peat
fire emissions
B. Langmann and A. Heil
Title Page Abstract Introduction Conclusions References Tables Figures J I J I Back Close Full Screen / Esc
Print Version Interactive Discussion
© EGU 2004
3. Emission estimate
In this section we introduce our approach to derive the emissions of aerosols and trace gases from vegetation and peat fires in Indonesia during the period July 1997 to June 1998. We proceed in four steps: 1. set-up of vegetation maps, 2. collection of remotely sensed fire count data, 3. determination of area burned with spatial and 5
temporal variability and 4. estimate of fire emissions.
3.1. Vegetation cover
In the first step we prescribed the distribution of four major vegetation classes: rain forest, agriculture, peat forest and savannah as fraction per model grid cell (Fig. 1). This is based on a vegetation data set of Loveland et al. (2000) in 1×1 km2resolution 10
derived with the AVHRR sensor during April 1992 and March 1993. We did not consider modifications of the vegetation cover between 1993 and 1997 due to the lack of data. Rain forests are found mainly on Borneo and Irian Jaya. Southern Sumatra, Java and the Peninsula of Malaysia represent the highest agricultural use while savannah is the main vegetation type only in Northern Australia. Peat forests are not defined in 15
Loveland et al. (2000) and we supplemented this vegetation class using information from maps published by Nichol (1997) and Dierke Weltatlas (1980). Figure 1c shows peat forests mainly located near the coast of east Sumatra, Kalimantan and south-eastern Irian Jaya. The fraction of peat forest per grid cell in these areas was calculated assuming that it makes up 2/3 of the total forest cover.
20
3.2. Fire counts from remotely sensed data
We determined the temporal and spatial distribution of vegetation and peat fires in Indonesia by using fire counts from the ATSR sensor (Arino and Rosaz, 1999) on board the ESR-2 satellite in 1×1 km2resolution. A threshold of 312 K (algorithm 1) or 308 K (algorithm 2) is applied to the radiance of the 3.7 µm channel in order to detect 25
ACPD
4, 2117–2159, 2004Release and dispersion of vegetation and peat
fire emissions
B. Langmann and A. Heil
Title Page Abstract Introduction Conclusions References Tables Figures J I J I Back Close Full Screen / Esc
Print Version Interactive Discussion
© EGU 2004 fires. We used the ATSR pixels above the 312 K threshold and incorporated them in
weekly intervals into the REMO model grid. Figure 2 shows the number of ATSR fire counts per model grid cell from 1 July to 31 December 1997 and from January 1 to 30 June 1998, respectively. The areas with the highest fire count density were located in southern Kalimantan and south-eastern Sumatra in 1997 with more than 1000 fire 5
counts per grid cell and in 1998 in East–Kalimantan with more than 500 fire counts per grid cell. According to our estimates, peat forests make up 20 to 60% of the total vegetation cover in these regions (Fig. 1c).
3.3. Area burned
The ATSR fire count data over Indonesia were converted into area burned information, 10
subdivided into the four vegetation classes utilised in this study, using the following empirical relationship:
ABi = MIN(F C/α, 1/β) ∗ A ∗ Vi (1)
with
ABi: area burned of vegetation class i per model grid cell and week (km2), 15
FC: fire counts per model grid cell and week, A: area per model grid cell (km2),
Vi: fraction of vegetation class i per model grid cell,
α, β: empirical parameters.
The empirical parameter α=554 scales the area burned per week to less than the 20
total area per grid cell. It is further assumed that not more than 1/β with β=14 of a grid cell may burn during one week. Both empirical parameters represent fitting constants that approximately adjust the ATSR fire counts for the model area north of 10◦S (ex-cluding Northern Australia) to the total area burned of 96 550 km2 in Indonesia during 1997/1998 given by ADB/Bappenas (1999). This study compiles various assessments 25
ACPD
4, 2117–2159, 2004Release and dispersion of vegetation and peat
fire emissions
B. Langmann and A. Heil
Title Page Abstract Introduction Conclusions References Tables Figures J I J I Back Close Full Screen / Esc
Print Version Interactive Discussion
© EGU 2004 aerial surveillance or ground assessments for different regions and vegetation classes
(Table 1, left column).
A comparison of the area burned estimate given by ADB/Bappenas (1999) and our “standard” estimate (Table 1, middle column) shows very similar values for the area burned per vegetation class but major differences for Kalimantan and Sumatra. With 5
our approach we obtain a smaller area burned on Kalimantan and a greater one on Sumatra, revealing limitations to accurately estimate the area burned from satellite de-rived fire counts. First, the presence of clouds and haze (Siegert and Hoffmann, 2000) prevents a continuous and consistent detection of hot spots. Second, for the ATSR fire count product only night time observations are used which leads to an underestimation 10
since fire activity generally peaks in the afternoon. Third, a fire pixel represents a de-fined area of 1 km2. It indicates that a heat event is detected within this area, however, it tells nothing about the number, the size and the intensity of the fires and thus the area burned within this pixel (Malingreau, 1990). Fourth, the relatively low temperature and partly subsurface peat fires might be difficult to detect from space by commonly 15
used temperature thresholds (Anderson, 2001).
In addition to our standard estimate, a “high emission” estimate has been established where solely the area of the fire damaged peat forest during 1997/1998 has been increased by a factor of 4.8 compared to the standard estimate resulting in 68 140 km2 (Table 1, right column). This number represents the upper estimate of fire damaged 20
peat lands in Indonesia during 1997 given by Page et al. (2002). As a result the total area burned in Indonesia during 1997/1998 in the high emission case is 151 290 km2. The area burned by sub-regions increases considerably on Kalimantan and Sumatra in the high emission case while it remains unchanged on Sulawesi and Java where peat forest is assumed to be negligible in our estimate (Fig. 1c). The area burned per grid 25
cell and week does not exceed 25% (∼750 km2) for the high emission estimate and 5% (∼150 km2) for the standard estimate during the whole simulation period from July 1997 to June 1998.
ACPD
4, 2117–2159, 2004Release and dispersion of vegetation and peat
fire emissions
B. Langmann and A. Heil
Title Page Abstract Introduction Conclusions References Tables Figures J I J I Back Close Full Screen / Esc
Print Version Interactive Discussion
© EGU 2004 3.4. Fire emissions
Particulate and gaseous emissions of the fires are determined based on the approach described by Levine (1999). Generally, the total mass of vegetation or peat consumed by burning (M in tons) is
M= AB ∗ B ∗ E (2)
5
where B is the biomass load in tons/km2 and E the burning efficiency. The total par-ticulate matter carbon emissions (TPMC E in tons of carbon) can then be determined by
T P MC E = M ∗ EF (T P MC) (3) with EF(TPMC) as emission factor for total particulate matter carbon (TPMC). Gaseous 10
emissions of CO2(CO2 E in tons of carbon) are calculated by considering the carbon
content of the fuel (C as mass percentage of carbon) and the combustion efficiency
CE :
CO2 E = M ∗ C ∗ CE (4)
Emissions of other trace gases, notably CO or CH4are calculated by multiplying CO2 E
15
with a CO2-normalised species emission ratio (ER). Table 2 summarises the respec-tive values of biomass load, burning efficiency, carbon content, combustion efficiency, emission factors and emission ratios for the different vegetation types used for our cal-culation. These values are fully taken from Levine (1999) and therefore we refer to that paper for more detailed information. The biomass load for peat deposits (Table 2) 20
given by Levine (1999) is based on Supardi et al. (1993). It exceeds the one of rain forests by a factor of 10 because the sub-ground organic body (peat) is the major burn-ing material and not the overlyburn-ing vegetation. Together with the other factors used to calculate the emissions, the higher biomass load of peat deposits results in 43 and 85 times higher TPMC emissions per unit area burned than rain forests and agriculture, 25
ACPD
4, 2117–2159, 2004Release and dispersion of vegetation and peat
fire emissions
B. Langmann and A. Heil
Title Page Abstract Introduction Conclusions References Tables Figures J I J I Back Close Full Screen / Esc
Print Version Interactive Discussion
© EGU 2004 Table 3 compares the estimate of Levine (1999) of the area burned on Sumatra and
Kalimantan during August to December 1997 and the resulting particulate emissions with the results of our standard and high emission case for the same area and period. Compared to Levine (1999) we overestimate the area burned by 29% and the TPMC emissions by 18% in the standard case. However, the relative contributions of the 5
different vegetation classes is reproduced within 5% with our standard approach. In the high emission case, the area burned exceeds the one given by Levine (1999) by a factor of 2.2 and TPMC emissions are 5.3 times higher. Levine (1999) gives an overall uncertainty of 50% for his emission calculations. The results of the standard estimate are within these uncertainty limits while the TPMC emissions of our high emission 10
estimate exceed the uncertainty range by far. Although fires in peat areas contribute only 18% to the total area burned in our standard emission case, they produce more than 90% of the TPMC emissions. This applies also to the emissions of trace gases such as CO and CH4. In the high emission case, fires in peat areas make up even 52% of the total area burned and 98% of the TPMC emissions. These numbers illustrate 15
again the enormous emissions released from peat fires.
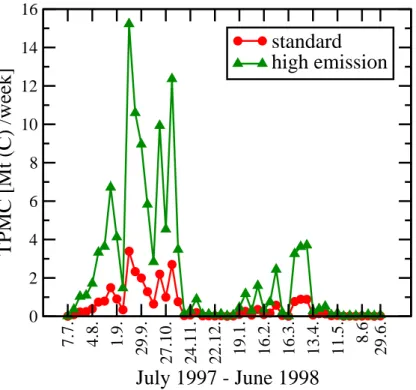
Figure 3 displays the temporal variability of TPMC emissions from vegetation and peat fires over Indonesia during the whole period from July 1997 to June 1998 as determined for the standard and high emission case. High amounts of TPMC were released into the atmosphere during two fire periods. TPMC emissions during the 20
second fire period in 1998 were by a factor of 4.7 lower than in 1997 because a consid-erably smaller area was burned in 1998 (26% of the total area burned in the standard case). Northern Australian emissions represent only 1.3% of the total emissions and were negligible compared to the Indonesian ones.
Page et al. (2002) emphasised the relevance of peat areas for climate change as 25
they act as a source of CO2when affected by fire. The authors estimated a release of 810 to 2570 Mt of carbon to the atmosphere by burning forested peat areas in Indone-sia in 1997. This is equivalent to 13–40 % of the mean annual global carbon emissions from fossil fuels. Page et al. (2002) classified their lower estimate of 480 Mt C as an
ACPD
4, 2117–2159, 2004Release and dispersion of vegetation and peat
fire emissions
B. Langmann and A. Heil
Title Page Abstract Introduction Conclusions References Tables Figures J I J I Back Close Full Screen / Esc
Print Version Interactive Discussion
© EGU 2004 underestimate. Duncan et al. (2003) report emissions of about 700 Mt C for the 1997
Indonesian wildfires. In our standard estimate total carbon emitted from fires in In-donesia from June 1997 to July 1998 makes up 400 Mt C (6.25% of the mean annual global carbon emissions from fossil fuels), from which CO2represents about 79%, CO 13%, TPMC 7% and CH4 1%, respectively. In our high emission case 1700 Mt C are 5
released to the atmosphere. However, this estimate is still significantly lower than the upper estimate of Page et al. (2002) of 2570 Mt C, even though the same extent of fire-damaged peat areas is considered. The differences can be explained as follows: Page et al. (2002) assume a peat bulk density of 0.1 g/m3, an averaged peat depths burned of 0.51 m and a peat carbon content of 57% resulting in 29 070 t(C)/km2released by peat 10
fires. Based on Levine (1999) only 24 375 t(C)/km2are released by peat fires, resulting from a lower peat bulk density of 0.065 g/m3, a lower carbon content of 50%, but a higher effective peat depth burned of 0.75 m. Furthermore, Page et al. (2002) assume the peat areas to be covered by pristine peat swamp forests with a biomass carbon content of 25 000 t(C)/km2 from which 50% is liberated by fire resulting in additional 15
emissions of 400 Mt C in their upper estimate. However, mainly fragmented and logged over peat swamp forests are subject to fire. Therefore, we do not consider emissions from surface vegetation fires on peat areas in our emission estimates. In addition, it should be noted that the peat area burned estimate of Page et al. (2002) is based on a detailed investigation in a small, rather drained peat area in Central Kalimantan where 20
33% were affected by fire in 1997. This number was adopted to the peat areas all over Indonesia without any further modification, implying a general overestimation of the peat area burned.
4. Model results and discussion
The main goal of this study is to determine the spatial and temporal variability and 25
intensity of smoke-haze from the 1997/1998 vegetation and peat fires in Indonesia. We evaluate modelled particle concentrations resulting from the two different emission
ACPD
4, 2117–2159, 2004Release and dispersion of vegetation and peat
fire emissions
B. Langmann and A. Heil
Title Page Abstract Introduction Conclusions References Tables Figures J I J I Back Close Full Screen / Esc
Print Version Interactive Discussion
© EGU 2004 estimates introduced in Sect. 3 by comparison with observations. The concentration
and distribution of the particles depend on the emissions from the fires and also on meteorological factors including transport by advection, vertical redistribution by tur-bulent diffusion and convective clouds, chemical and microphysical modifications (not considered in the current study), and dry and wet deposition.
5
4.1. General atmospheric conditions in Indonesia
The tropical and wet conditions in Indonesia are characterised by uniformly high tem-perature, high humidity, relatively constant atmospheric pressure and weak wind ve-locities. The overall precipitation rate in Indonesia is highly variable in space and time (Aldrian, 2003). Precipitation is therefore the quantity of greatest interest, particularly 10
with respect to the removal of particles from the atmosphere by wet deposition, which is the dominant loss process.
Throughout the year Indonesia experiences a dry and a wet season induced by the two major flow patterns (Ramage, 1971). During the transitional months (Septem-ber/October and April/May) the switching of the wind pattern results in relatively weak 15
and variable winds. From about November to March low level trade winds blow in the northern hemisphere from the north-east towards the equator and continue into the southern hemisphere with a north-west component. This winter monsoon brings heavy rainfall to the Maritime Continent. The dry season from about June to September is characterised by the trade winds blowing from the south-east towards the equator in 20
the southern hemisphere continuing in the northern hemisphere as south-west winds. During El Ni ˜no years, an additional suppression of precipitation occurs in Indonesia, which typically lasts for 13 months starting in March.
ACPD
4, 2117–2159, 2004Release and dispersion of vegetation and peat
fire emissions
B. Langmann and A. Heil
Title Page Abstract Introduction Conclusions References Tables Figures J I J I Back Close Full Screen / Esc
Print Version Interactive Discussion
© EGU 2004 4.2. The 1997/1998 El Ni ˜no period in Indonesia and Malaysia
4.2.1. Precipitation
In 1997/1998, during one of the most severe El Ni ˜no events of the 20th century (McPhaden, 1999), precipitation in Indonesia was significantly reduced. An averaged monthly rainfall deficit of 120–150 mm below normal was recorded in Indonesia (WMO, 5
1998), the annual rainfall deficit ranged from 1000–1500 mm (FAO/GIEWS, 1998). Compared to a long-term rainfall record of 48 years, the rainfall from June to November 1997 was below the 10th percentile in large parts of Indonesia (Kirono et al., 1999).
A compilation of rainfall measurement data is available from the Global Precipita-tion Climatology Centre (GPCC, http://www.dwd.de/en/FundE/Klima/KLIS/int/GPCC) 10
as area-averaged monthly mean data. Over land, GPCC data are interpolated from rain gauge measurements to a 1◦×1◦geographical latitude-longitude grid. Over the ocean, GPCC data are based on infrared and microwave satellite observations, which are interpolated to a 2.5◦grid. Due to the scarcity of rain gauge measurements for the In-donesian region, an uncertainty of more than 10% over land and 40% over the ocean is 15
attributed to this data (http://www.mpimet.mpg.de/en/extra/wg/wg5/wg pr06.htm). Fig-ure 4 illustrates the monthly total area averaged GPCC rainfall and the corresponding REMO results for the climate and forecast mode from July 1997 to June 1998 for the whole area (ocean and land, Fig. 4a) and over land only (Fig. 4b). GPCC data show dry conditions until November 1997 when the delayed northern monsoon rain started. The 20
two maxima in rainfall during December 1997 and April 1998 are associated with the south- and northward movement of the Inter Tropical Convergence Zone. The REMO model reproduces the temporal development of GPCC rainfall data in detail, but yields principally higher precipitation rates. Overprediction by REMO is more pronounced in the climate mode than in the forecast mode as visible especially in Fig. 4a. We obtain 25
similar results when comparing the average of monthly total precipitation measured at seven Malaysian stations (Fig. 4d) from July to December 1997 with the rainfall at the corresponding REMO grid points (Fig. 4c).
ACPD
4, 2117–2159, 2004Release and dispersion of vegetation and peat
fire emissions
B. Langmann and A. Heil
Title Page Abstract Introduction Conclusions References Tables Figures J I J I Back Close Full Screen / Esc
Print Version Interactive Discussion
© EGU 2004 Strongly differing results are obtained when comparing rainfall records from single
Malaysian stations with REMO results (Fig. 5). At Petaling Jaya / Kuala Lumpur (3.1◦, 101.4◦, 46 m asl), observed monthly total precipitation exhibits a sharp increase from August reaching its maximum in November with 660 mm while rainfall modelled by REMO peaks in October with only around 300 mm (Fig. 5a). Over a 6-month total, 5
REMO underpredicts observed precipitation (observed 6-month total of 1970 mm) by 820 mm in the forecast mode and 1030 mm in the climate mode. At Kuching (1.5◦, 110.3◦, 56 m asl) REMO generally overpredicts the observed rainfall, most pronounced in the climate mode (Fig. 5b). The 6-month total precipitation by REMO in the cli-mate mode with 2320 mm is 2.1 times higher than the observation (1010 mm) while the 10
REMO forecast mode is only 30% higher.
The observed and modelled rainfall in Indonesia and Malaysia (Fig. 4 and 5) exhibits strong variability in space and time. This highlights the difficulties of modelling convec-tive clouds and precipitation with regional models such as REMO in this region of the world, where convective precipitation dominates over stratiform precipitation. As too 15
much rainfall and associated wet deposition also influences the atmospheric particle burden, we focus in the following on the more realistic forecast mode simulation, unless noted otherwise.
4.2.2. Wind speed and direction
A comparison of observed and modelled monthly wind conditions at 925 hPa at Petaling 20
Jaya and Kuching is shown in Fig. 6 to illustrate the REMO model capabilities to de-termine particle transport by advection. The observations are based on 0 and 12 UTC sonde data obtained from the Malaysian Meteorological Services for the second half of 1997. Monthly wind speed is displayed as a box plot. The lower and upper edge of the box represents the 25th and 75th percentile value, respectively. The line across 25
the box displays the median (50th percentile). Outliers are shown as squares, extreme values as stars. The wind roses in the upper band of Fig. 6 display the monthly number frequency of wind direction in 10◦sectors.
ACPD
4, 2117–2159, 2004Release and dispersion of vegetation and peat
fire emissions
B. Langmann and A. Heil
Title Page Abstract Introduction Conclusions References Tables Figures J I J I Back Close Full Screen / Esc
Print Version Interactive Discussion
© EGU 2004 At Petaling Jaya, observed median wind speed exhibits a minimum in October and
November 1997 as typical for the inter-monsoon period. REMO model results show similar features, but principally higher wind speeds, particularly in December. The interquartile range (length of the box) modelled by REMO indicating the variability of the values is in good agreement with the observations, except in December when the 5
model produces a higher variability than observed. Measured wind direction at Petaling Jaya shows a switching from southerly to northerly monsoon winds in December. In between, there is a typical transitional phase with variable wind directions in October and November. REMO simulations reproduce the switching of the wind direction but, in contrast to the observations, do not show a period with changing wind directions. 10
Higher modelled wind speeds may contribute to this bias since wind direction tends to become less variable with increasing wind speeds (Mestayer et al., 2003).
Observed monthly median wind speeds at Kuching (Fig. 6b) are nearly constant from July to December 1997. On a 6-month summary, the observed and the REMO model mean wind speed are almost equal. A comparison of the observed interquartile range 15
of monthly wind speed with REMO results also shows good agreement. In both the observations and the REMO simulations, southerly winds predominate in July and Au-gust, followed by a period of highly variable wind directions turning into more frequent northerly winds by December. In summary, REMO fairly well reproduces observed changes of wind conditions with time.
20
4.2.3. Atmospheric smoke-haze distribution
The spatial distribution of smoke-haze in Indonesia and Malaysia from July 1997 to June 1998 can be derived from the TOMS Aerosol Index (AI) data (Herman et al., 1997), shown in 1◦ resolution as monthly means in the left column of Fig. 7. Positive TOMS AI values are derived from satellite measurements of UV absorbing aerosols in 25
the entire vertical column of the atmosphere. Two periods of smoke-haze took place from August to November 1997 and from February to April 1998. During the first smoke-haze episode, TOMS AI exhibits maximum values over large parts of
Suma-ACPD
4, 2117–2159, 2004Release and dispersion of vegetation and peat
fire emissions
B. Langmann and A. Heil
Title Page Abstract Introduction Conclusions References Tables Figures J I J I Back Close Full Screen / Esc
Print Version Interactive Discussion
© EGU 2004 tra and Kalimantan south of the equator, and southern Irian Jaya. The smoke-haze
showed a strong west- and northward expansion from the main fire locations (Fig. 2). In September and October 1997, the smoke-haze reached far into the Indian Ocean and partially covered Peninsular Malaysia. In these months, fire emissions were high-est (Fig. 3) while precipitation rates and associated wet deposition of smoke-haze par-5
ticles was low (Fig. 4). The second smoke-haze episode was restricted to Borneo only. TOMS AI maps in March and April 1998 show two separated smoke-haze plumes, one originating from fires in East Kalimantan and the other one mainly from fires in Borneo-Malaysia (eastern Sarawak and western Sabah) and Brunei. No substantial rainfall was recorded in East Kalimantan from January until April 1998, favouring the 10
uncontrolled spread of fires in the region, whereas all the other provinces on Borneo had experienced normal to heavy rainfall (Siegert and Hoffmann, 2000).
The right column of Fig. 7 presents the monthly mean atmospheric column burden of total particulate matter (TPMC) as determined by the REMO model with the standard emission estimate. It should be emphasised at this point that Fig. 7 displays only a 15
qualitative comparison of the dimensionless TOMS AI with REMO calculated TPMC column burden in mg(C)/m2. The REMO model largely reproduces the spatial and temporal expansion and intensity of haze. A northward transport of smoke-haze dominates in the model results in August 1997, with an increasing westward motion until October 1997. Differences from TOMS AI occur in the modelled expansion 20
and intensity of smoke-haze resulting from fires in Irian Jaya. A possible explanation for these disparities is that we may have underestimated the area of peat forests in south-eastern Irian Jaya. The REMO simulations also do not show a smoke-haze plume from fires in Borneo-Malaysia and Brunei in 1998 as visible in TOMS AI data, because we did not estimate any peat fires there. Ahmad-Zainal (2001), however, observed fires in 25
ACPD
4, 2117–2159, 2004Release and dispersion of vegetation and peat
fire emissions
B. Langmann and A. Heil
Title Page Abstract Introduction Conclusions References Tables Figures J I J I Back Close Full Screen / Esc
Print Version Interactive Discussion
© EGU 2004 4.2.4. Smoke-haze distribution in surface air
Monthly mean TPMC concentration simulated for the first vertical model layer is shown in Fig. 8 for the standard and high emission estimate. The spatial expansion of the sim-ulated smoke-haze for the two emission estimates exhibits similar dispersion patterns, but the smoke-haze in the high emission case is more extensive pointing to longer 5
atmospheric residence times of TPMC in this case. As expected, modelled TPMC concentrations are distinctly higher in the high emission case. In September 1997 maximum monthly TPMC concentrations of 5017 µgC/m3 and 23 814 µgC/m3 are de-termined in the standard and the high emission cases, respectively, for the first model layer. In our standard estimate we determine monthly mean TPMC concentrations 10
above 2000 µgC/m3 from August until October only for 15 model grid cells in areas with high fire activity, while in the high emission case they are determined over roughly the entire region with recorded fire activity (159 model grid cells). In the high emission case, TPMC concentrations downwind from the fires remain at high levels over long dis-tances. In September 1997, monthly mean TPMC concentrations between 1000 and 15
2000 µgC/m3expand from the fire regions in southern Kalimantan into the South China Sea, including large areas of western Borneo. In the standard emission case, monthly mean TPMC concentration in September are 300 to 1000 µgC/m3in the western parts of Borneo. For comparison, sparse measurements in Indonesia show ambient particle concentrations above 2000 µg/m3Total Particulate Matter (TPM) at several locations in 20
Kalimantan and Sumatra during this time. Concentrations of up to around 4000 µg/m3 TPM are recorded in the vicinity to the main fire activity (Palangkaraya on Kalimantan and Jambi on Sumatra) (Heil and Goldammer, 2001). Assuming a particulate carbon content of 23% as representative for biomass burning aerosols (Artaxo et al., 2002), these values correspond to 460 and 920 µgC/m3TPMC, respectively. This comparison 25
indicates that the high emission case strongly overestimates observed TPMC concen-trations. The standard emission case overestimates observed concentrations in a few grid cells in the vicinity of the fires, while approximately meeting the range of observed
ACPD
4, 2117–2159, 2004Release and dispersion of vegetation and peat
fire emissions
B. Langmann and A. Heil
Title Page Abstract Introduction Conclusions References Tables Figures J I J I Back Close Full Screen / Esc
Print Version Interactive Discussion
© EGU 2004 concentrations downwind to the fires.
4.2.5. Smoke-haze at Malaysian locations
To evaluate the modelled atmospheric TPMC distribution in more detail, we quanti-tatively compare REMO simulation results with ambient particle measurements ob-tained from the Malaysian Meteorological Services for seven Malaysian sites for July 5
to December 1997. Dependent on the station, particle measurements represent daily average concentrations of PM10 (Particulate Matter smaller than 10 µm in diameter) or TPM (Total Particulate Matter) based on continuous (daily) or discontinuous (every second day) measurements. We converted modelled TPMC concentrations into TPM assuming a carbon content of 23% (Artaxo et al., 2002). If we compare model results 10
with PM10 measurements, we further convert TPM concentrations derived from the model simulations into PM10 assuming a PM10/TPM ratio of 80%. This ratio is based on emission factors given by Peterson and Ward (1993) for fuel combustion (large woody, litter and duff) in the smouldering stage.
Figure 9 illustrates PM10 and TPM observations at Petaling Jaya on Peninsular 15
Malaysia and Kuching on Borneo-Malaysia from July to December 1997 together with the corresponding REMO model results for the first model layer derived with the stan-dard and high emission estimate. In early July 1997 and after mid-November, i.e. be-fore and after the smoke-haze episode, background particle concentrations between 40 and 60 µg/m3 are measured at both locations. This approximate particle background 20
is missing in the REMO model results because we included solely primary particles released by vegetation and peat fires in our simulations, and no other anthropogenic or natural particle sources. PM10 measurements at Petaling Jaya show a gradual, but highly fluctuating increase during July and August, followed by a distinct rise in September with peak values around 400 µg/m3 PM10. Particle concentrations return 25
to background levels in mid-November. The REMO model reproduces very well the temporal development of ambient particle concentration at Petaling Jaya with a linear correlation coefficient between observation and model output of R=0.66 in the standard
ACPD
4, 2117–2159, 2004Release and dispersion of vegetation and peat
fire emissions
B. Langmann and A. Heil
Title Page Abstract Introduction Conclusions References Tables Figures J I J I Back Close Full Screen / Esc
Print Version Interactive Discussion
© EGU 2004 emission case. PM10 concentrations determined in the high emission case exceed
observed values by far. Monthly mean measured PM10 concentration in September is 210 µg/m3, in the standard emission case it is 85 µg/m3, while it is 380 µg/m3 in the high emission case. Measured particle concentration at Kuching also peaked in September with maximum values around 1000 µg/m3 TPM. Monthly mean measured 5
TPM concentration is 420 µg/m3in September. The REMO model reproduces the tem-poral variability of TPM concentrations observed at Kuching only moderately (R=0.44). Monthly mean concentrations in September is 180 µg/m3 TPM in the standard and 840 µg/m3TPM in the high emission case.
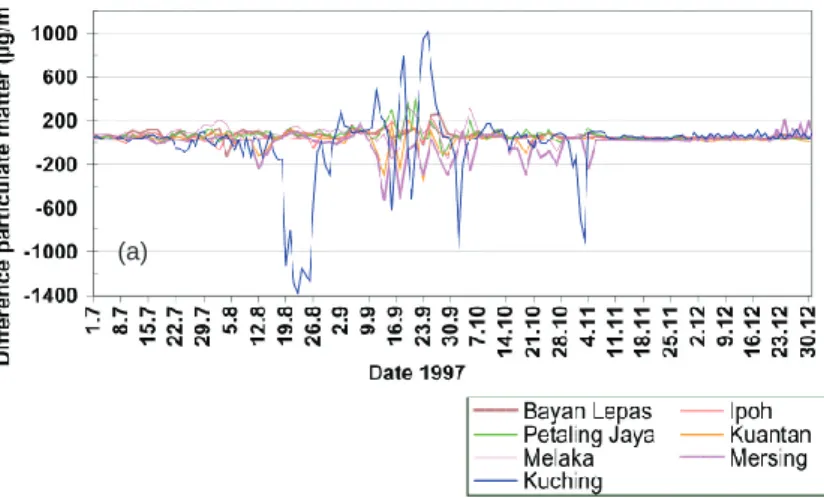
Figure 10 illustrates the differences between observed TPM and PM10 concentra-10
tions and REMO model results for the standard emission estimate (Fig. 10a) and the high emission estimate (Fig. 10b) at the seven Malaysian locations from July to Decem-ber 1997. Negative values represent model overprediction, positive values model un-derprediction. A bias of about 30–100 µg/m3is visible outside the smoke-haze period due to the neglected particle background concentrations in the REMO model simula-15
tions. The highest deviations from observations occur at Kuching, whereas the stations on Peninsula Malaysia exhibit a similar behaviour. High correlation (R>0.73) is found for particulate matter concentrations measured on Peninsular Malaysia at Ipoh, Petal-ing Jaya, Kuantan and Melaka throughout the fire episode (1 July to 15 November 1997), but no correlation is found for the post-haze period (16 November to 31 Decem-20
ber 1997). This indicates that during the smoke-haze episode these locations are to a large degree influenced by the same air masses loaded with fire aerosols. REMO model results determined with the standard emission estimate differ from the observa-tions on Peninsula Malaysia in maximum by+400 µg/m3 and −500 µg/m3. Model re-sults calculated with the high emission estimate show an underprediction of 200 µg/m3 25
of the measurements on Peninsula Malaysia and a significant higher overprediction up to 2800 µg/m3.
In summary, the REMO model results using the standard emission estimate are much closer to the observations than the model results using the high emission
es-ACPD
4, 2117–2159, 2004Release and dispersion of vegetation and peat
fire emissions
B. Langmann and A. Heil
Title Page Abstract Introduction Conclusions References Tables Figures J I J I Back Close Full Screen / Esc
Print Version Interactive Discussion
© EGU 2004 timate. The standard emission estimate tends to overpredict particle concentrations
in the vicinity of the fires by a factor of about 2, but in general fairly well reproduces observed ranges of ambient particle concentrations at locations some hundred kilome-tres downwind of the fires. Using the high emission estimate, REMO model results are several times higher than the observed ranges of particle concentrations, both close to 5
the fires and at locations in Malaysia affected by long-range transport of fire emissions, indicating that this emission estimate is too high.
5. Conclusions and outlook
Numerical model simulations of the severe smoke-haze periods in Indonesia dur-ing 1997/1998 have been carried out with the regional atmosphere-chemistry model 10
REMO (Langmann, 2000). The model experiments focussed on the dispersion of veg-etation and peat fire emissions in the atmosphere using two emission estimates, which only differ in the size of the fire affected peat areas. From comparisons of model re-sults with observations we conclude that our standard emission estimate is much more realistic than the high emission estimate. Therefore, we also conclude that the area of 15
the fire affected peatlands which is based on Page et al. (2002) in the high emission case, is too large.
Burning peat areas in Indonesia have been a major source of gases and particles in recent smoke-haze events (Nichol, 1997; Levine, 1999; Page et al., 2002). There-fore, continuous monitoring of peat areas in Indonesia is necessary, particularly of the 20
spatial distribution, depth and modification by fire. Such information helps to reduce the huge uncertainties in emission estimates. One example is the release of CO2from burning peatlands in Indonesia in 1997 which range from 6.25% (this study) to 40% (Page et al., 2002) of the mean global carbon emissions from fossil fuels. The reason for the large atmospheric CO2 increase in 1997/1998, however, is still in discussion 25
in the carbon cycle community. One possibility is also decreased photosynthesis of vegetation in the Amazon region due to decreased rainfall during the El Ni ˜no period
ACPD
4, 2117–2159, 2004Release and dispersion of vegetation and peat
fire emissions
B. Langmann and A. Heil
Title Page Abstract Introduction Conclusions References Tables Figures J I J I Back Close Full Screen / Esc
Print Version Interactive Discussion
© EGU 2004 (Scholze, 2003).
Repeated smoke-haze periods in Indonesia in recent years caused mainly by peat fires are a major threat to human health. Due to the lack of continuous countrywide measurements of air quality in Indonesia, numerical model simulations as presented here with the REMO model are an important tool to assess the sources, the amount 5
and distribution of smoke-haze particles in the atmosphere over Indonesia and the possible impact on human health. Further developments are necessary to improve the quality of the simulation results. These include particularly the formation of sec-ondary organic aerosols from low volatile organic compounds and the prediction of the chemical composition and size distribution of the smoke-haze particles.
10
Another key factor when modelling smoke-haze is the prediction of rainfall because wet deposition is the major removal process of smoke-haze particles from the atmo-sphere. As outlined by Aldrian (2003) and also in this paper, the REMO model tends to overestimate rainfall in Indonesia, especially over the ocean. During the winter monsoon season when the air masses approach from the Asian continent the model 15
might overpredict precipitation because aerosol-cloud interactions in these polluted air masses are not taken into account. Locally, the influence of smoke-haze aerosols on clouds and precipitation could be important for a suppression of rainfall (Rosenfeld, 1999) and therefore a prolongation of the fires. Aldrian (2003) pointed to the impor-tance of the local sea surface temperature (SST). With a coupled ocean-atmosphere 20
model approach with variable SST, he was able to improve the determination of rainfall significantly. Another possibility to improve rainfall prediction is to take into account a fractional land-sea coverage in each grid cell according to Semmler et al. (2004) to rep-resent the numerous small islands of Indonesia more realistically. As these islands act as heat engines for local convection in this most active convective region of the world, 25
the effect is assumed be important. Neale and Slingo (2003) analysed the performance of a global circulation model over Indonesia and showed that the non-representation of islands lead to an overall increase in precipitation. Moreover, the approach how to describe convective processes in the model has to be examined carefully.
ACPD
4, 2117–2159, 2004Release and dispersion of vegetation and peat
fire emissions
B. Langmann and A. Heil
Title Page Abstract Introduction Conclusions References Tables Figures J I J I Back Close Full Screen / Esc
Print Version Interactive Discussion
© EGU 2004
Acknowledgements. The authors would like to thank E. Aldrian, S. Hagemann, J. H ¨olzemann,
A. Hoffmann, L. Kornblueh, M. Pfeffer and R. Podzun for support and valuable comments. The availability of data from ATRS, TOMS AI, GPCC and the Malaysian Meteorological Service is gratefully acknowledged. This work has been funded by the German Ministry for Education, Science, Research and Technology (BMBF) within the Focus Program AFO2000.
5
References
ADB (Asian Development Bank)/BAPPENAS (National Development Planning Agency): Causes, Extent, Impact and Costs of 1997/98 Fires and Drought Final Report, Annex 1 and 2, Planning for Fire Prevention and Drought Management Project , Asian Development Bank TA 2999-INO Fortech, Pusat Pengembangan Agribisnis, Margueles P ¨oyry, Jakarta, Indonesia, 10
http://www.adb.org/Documents/Reports/Fire Prevention Drought Mgt/default.asp, 1999. Ahmad-Zainal, M. I.: Forest Fire in Malaysia: Its Management and Impact on Biodiversity,
Asean Biodiv., 1(3), 31–35, 2001.
Aldrian, E.: Simulations of Indonesian rainfall with a hierarchy of climate models, Ph.D. thesis, Examination Report No. 92, Max-Planck-Institute for Meteorology, Hamburg, Germany,http:
15
//www.sub.uni-hamburg.de/disse/1090/dissertation.pdf, 2003.
Anderson, I. P.: NOAA/GIS Training Expert,http://mofrinet.cbn.net.id/informasi/PHPA/FFPCP/
PDF/NOAA GIS Training Expert final report.PDF, 2001.
Arino, O. and Rosaz, J.-M.: 1995 to 1999 ATSR World Fire Atlas, Proceeding of the Joint Fire Science Conference, Boise, 15–17 June, 1999.
20
Artaxo, P., Martins, J. V., Yamasoe, M. A., Proc ´opio, A. S., Pauliquevis, T. M., Andreae, M. O., Guyon, P., Gatti, L. V., and Leal, A. M. C: Physical and chemical properties of aerosols in the wet and dry seasons in Rond ˆonia, Amazonia, J. Geophys. Res., 107(D20), 8081, doi:10.1029/2001JD000666, 2002.
Chevillard, A., Ciais, P., Karstens, U., Heimann, M., Schmidt, M., Levin, I., Jacob, D., Podzun, 25
R., Kazan, V., Sartorius, H., and Weingartner, E.: Transport of Rn-222 using the regional model REMO: a detailed comparison with measurements over Europe, Tellus B, 54, 850– 871, 2002a.
ACPD
4, 2117–2159, 2004Release and dispersion of vegetation and peat
fire emissions
B. Langmann and A. Heil
Title Page Abstract Introduction Conclusions References Tables Figures J I J I Back Close Full Screen / Esc
Print Version Interactive Discussion
© EGU 2004 CO2 over Europe and western Siberia using the regional scale model REMO, Tellus B, 54,
872–894, 2002b.
Dierke Weltatlas: Georg Westermann Verlag, Braunschweig, Germany, 140–141, 1980. Duncan, B. N., Bey, I., Chin, M., Mickley, L. J., Fairlie, T. D., Martin, R. V., and Matsueda,
H.: Indonesian Wildfires of 1997: Impact on Tropospheric Chemistry, J. Geophys. Res., 5
108(D15), 4458, doi:10.1029/2002JD003195, 2003.
FAO (Food and agriculture organisation of the United Nations): FAO/WFP Crop and food supply assessment mission to Indonesia, Special report, 17th April 1998, FAO Rome,http://www.
fao.org/DOCREP/004/W8458E/W8458E00.HTM, 1998.
Heil, A. and Goldammer, J. G.: Smoke-haze pollution: A review of the 1997 episode in South-10
east Asia, Regional Env. Change, 2(1), 24–37, 2001.
Herman, J. R, Krotkov, N., Celarier, E., Larko, D., and Labow, G.: Distribution of UV radiation at the Earth’s surface from TOMS-measured UV-backscattered radiances, J. Geophys. Res., 104(D10), 16 911–16 922, 1999.
Jacob, D.: Investigation of the Annual and Interannual Variability of the Water Budget over 15
the Baltic Sea Drainage Basin Using the Regional Climate Model REMO, Meteorol. Atmos. Phys., 77(1-4), 61–73, 2001.
Kirono, D. C. G, Tapper, N. J., and McBride, J.: Documenting Indonesian rainfall in the 1997– 1998 El Ni ˜no event, Phys. Geogr., 20(5), 422–435, 1999.
Langmann, B., Herzog, M., and Graf, H.-F.: Radiative forcing of climate by sulfate aerosols as 20
determined by a regional circulation chemistry transport model, Atmos. Environ., 32, 2757– 2768, 1998.
Langmann, B.: Numerical modelling of regional scale transport and photochemistry directly together with meteorological processes, Atmos. Environ., 34, 3585–3598, 2000.
Langmann, B. and Graf, H.-F.: Indonesian smoke aerosols from peat fires and 25
the contribution from volcanic sulfur emissions, Geophys. Res. Lett., 30(11), 1547, doi:10.1029/2002GL016646, 2003.
Langmann, B., Bauer, S. E., and Bey I.: The influence of the global photochemical composition of the troposphere on European summer smog, Part I: Application of a global to mesoscale model chain, J. Geophys. Res., 108(D4), 4146, doi:10.1029/2002JD002072, 2003.
30
Levine, J. S.: The 1997 fires in Kalimantan and Sumatra, Indonesia: Gaseous and particulate emissions, Geophys. Res. Lett., 26(7), 815–818, 1999.
ACPD
4, 2117–2159, 2004Release and dispersion of vegetation and peat
fire emissions
B. Langmann and A. Heil
Title Page Abstract Introduction Conclusions References Tables Figures J I J I Back Close Full Screen / Esc
Print Version Interactive Discussion
© EGU 2004 Development of a Global Land Cover Characteristics Database and IGBP DISCover from
1-km AVHRR Data, Int. J. Remote Sens., 21(6/7), 1303–1330, 2000.
Majewski, D.: The Europa Modell of the Deutscher Wetterdienst, Seminar proceedings ECMWF, 2, 147–191, 1991.
Malingreau, J. P.: The contribution of remote sensing to the global monitoring of fires in trop-5
ical and subtropical ecosystems, in: Fires in the tropical biota, Ecosystems process and global change, edited by Goldammer, J. G., Ecological studies 84, Springer-Verlag, Berlin, Heidelberg, New York, 337–370, 1990.
McPhaden, M. J.: Genesis and Evolution of the 1997–98 El Ni ˜no, Science, 950–954, 1999. Mellor, B. and Yamada, T.: A hierachy of turbulence closure models for planetary boundary 10
layers, J. Atmos. Sci., 31, 1791–1806, 1974.
Mesinger, F. and Arakawa, A.: Numerical methods used in atmospheric models, GARP Public. Ser., 17, 1–64, 1976.
Mestayer, P., Almbauer, R., and Tchepel, O.: Urban Field Campaigns, edited by Moussiopoulos, N., Air Quality in Cities, Springer, Berlin, 51–87, 2003.
15
Neale, R. B. and Slingo, J. M.: The Maritime Continent and its role in the global circulation: A GCM study, J. Clim., 16(5), 834–848, 2003.
Nichol, J.: Bioclimatic impacts of the 1994 smoke haze event in Southeast Asia, Atmos. Envi-ron., 31(8), 1209–1219, 1997.
Page, S. E, Siegert, F., Rieley, J. O., B ¨ohm, H.-D. V., Jaya, A., and Limin, S.: The amount of 20
carbon released from peat and forest fires in Indonesia during 1997, Nature, 420, 61–65, 2002.
Peterson, J. and Ward, D.: An inventory of particulate matter and air toxic emissions from prescribed fires in the United States for 1989, IAG # DW12934736-01-0-1989, 1993. Ramage, C. S.: Monsoon meteorology, Academic Press, New York, 1971.
25
Rieley, J. O., Page, S., and Sieffermann, G.: Tropical peat swamp forests of Southeast Asia: Ecology and environmental Importance, Malaysian J. Trop. Geogr., 26(2), 131–141, 1995. Rieley, J. O., Page, S. E., and Shepherd, P. A.: Tropical Bog Forests of South East Asia,
in: Conserving Peatlands, edited by Parkyn, L., Stoneman, R. E. and Ingram, H. A. P., Wallingford, CAB International, 35–41, 1997.
30
Roeckner, E., Arpe, K., Bengtsson, L., Christoph, M., Claussen, M., D ¨umenil, L., Esch, M., Giorgetta, M., Schlese, U., and Schulzweida, U.: The atmospheric general circulation model ECHAM-4: Model description and simulation of present-day climate, Report No. 218, the
ACPD
4, 2117–2159, 2004Release and dispersion of vegetation and peat
fire emissions
B. Langmann and A. Heil
Title Page Abstract Introduction Conclusions References Tables Figures J I J I Back Close Full Screen / Esc
Print Version Interactive Discussion
© EGU 2004 Max Planck Institute for Meteorology, Hamburg, Germany, 1996.
Rosenfeld, D.: TRMM Observed First Direct Evidence of Smoke from Forest Fires Inhibiting Rainfall, Geophys. Res. Lett., 26(20), 3105–3108, 1999.
Scholze, M.: Model studies on the response of the terrestrial carbon cycle to climate change and variability, Ph.D. thesis, Examination Report No.90, Max-Planck-Institute for Me-5
teorology, Hamburg, Germany, http://www.sub.uni-hamburg.de/disse/1007/dissertation.pdf, 2003.
Semmler, T., Jacob, D., Schl ¨unzen, K. H., and Podzun, R.: Influence of sea ice treatment in a regional climate model on boundary layer values in the Fram Strait region, Month .Weath. Rev., 132, 985–999, 2004.
10
Shimada, S., Takahashi, H., Haraguchi, A., and Kaneko, M.: Carbon content characteristics of tropical peats in Central Kalimantan, Indonesia: Estimating their spatial variability in density, Biogeochem., 53, 249–267, 2001.
Siegert, F. and Hoffmann, A. A.: The 1998 forest fires in East Kalimantan (Indonesia): A quanti-tative evaluation using high resolution, multitemporal ERS-2 SAR images and NOAA-AVHRR 15
hotspot data, Remote Sens. Environ., 72, 64–77, 2000.
Smolarkiewitz, P. K.: A simple positive definite advection scheme with small implicit diffusion, Mon. Wea. Rev., 111, 479–486, 1983.
Supardi, A., Subekty, D., and Neuzil, S. G.: General geology and peat resources of the Siak Kanan and Bengkalis Island peat deposits, Sumatra, Indonesia, in: Modern and Ancient 20
Coal Forming Environments, edited by Cobb, J. C. and Cecil, C. B., Geological Society of America Special Paper, 86, 45–61, 1993.
Tiedtke, M.: A comprehensive mass flux scheme for cumulus parameterisation in large-scale models, Mon. Wea. Rev., 117, 1778–1800, 1989.
Walcek, C. J. and Taylor, G. R.: A theoretical method for computing vertical distributions of 25
acidity and sulfate production within cumulus clouds, J. Atmos. Sci., 43, 339–355, 1986. Walcek, C. J., Brost, R. A., Chang, J. S., and Wesley, M. L.: SO2, Sulfate and HNO3 deposition
velocities computed using regional landuse and meteorological data, Atmos. Environ., 20, 949–964, 1986.
WMO (World Meteorological Organisation): Report of the WMO Workshop on Regional Trans-30
boundary Smoke and Haze in Southeast Asia, Singapore, 2–5 June 1998, WMO, Geneva, SG/59, 1998.
ACPD
4, 2117–2159, 2004Release and dispersion of vegetation and peat
fire emissions
B. Langmann and A. Heil
Title Page Abstract Introduction Conclusions References Tables Figures J I J I Back Close Full Screen / Esc
Print Version Interactive Discussion
© EGU 2004
Table 1. Area burned estimates (km2) for the Indonesian fire period 1997/1998. Left column: ADB/Bappenas (1999), middle column: standard estimate of this study, right column: high emission estimate of this study.
Area burned (km2) ADB (1999) Standard case High emission case
Total Indonesia 96 550 97 340 151 290 Kalimantan 65000 56940 96060 Sumatra 17550 29080 40300 Irian Jaya 9000 8260 11870 Sulawesi+ Java 5000 3060 3060 Rain forest 347101) 39640 39640 Agriculture 396302) 35930 35930 Peat forest 14580 14190 68140 Savannah 76303) 7590 7590 1)
sum of lowland forest and timber plantation 2)
sum of agriculture and estate crops 3)
ACPD
4, 2117–2159, 2004Release and dispersion of vegetation and peat
fire emissions
B. Langmann and A. Heil
Title Page Abstract Introduction Conclusions References Tables Figures J I J I Back Close Full Screen / Esc
Print Version Interactive Discussion
© EGU 2004
Table 2. Biomass load (B) in t/km2 and dimensionless burning efficiency (E), carbon content (C), combustion efficiency (CE), emission factor (EF) and CO2-normalised species emission ratios (ER) for rain forests, agricultural and peat areas in Indonesia based on Levine (1999). For savannah we use the same parameters as for agriculture.
B [t/km2] E C CE EF(TPMC) ER(CO) ER(CH4) Rain forest 10000 0.2 0.45 0.90 0.020 0.0850 0.0032 Agriculture1) 5000 0.2 0.45 0.90 0.020 0.0850 0.0032 Peat areas 975002) 0.5 0.5 0.77 0.035 0.1815 0.0104
1)
agriculture and plantation areas 2)
ACPD
4, 2117–2159, 2004Release and dispersion of vegetation and peat
fire emissions
B. Langmann and A. Heil
Title Page Abstract Introduction Conclusions References Tables Figures J I J I Back Close Full Screen / Esc
Print Version Interactive Discussion
© EGU 2004
Table 3. Area burned (km2) and TPMC emissions (Mt C) from August to December 1997 in Sumatra and Kalimantan according to Levine (1999) and the standard and high emissions estimate of this study.
Area burned (km2) Total Peat forest Rain forest Agriculture
Levine (1999) 45600 9120 13680 22800
Standard case 58677 10650 18658 29369
High emission case 99147 51120 18658 29369
TPMC (Mt C) Total Peat forest Rain forest Agriculture
Levine (1999) 16.568 15.561 0.547 0.460
Standard case 19.506 18.172 0.746 0.588
ACPD
4, 2117–2159, 2004Release and dispersion of vegetation and peat
fire emissions
B. Langmann and A. Heil
Title Page Abstract Introduction Conclusions References Tables Figures J I J I Back Close Full Screen / Esc
Print Version Interactive Discussion
© EGU 2004
Fig. 1. Distribution of the major vegetation classes as used in the REMO model domain in
fraction (0–1) per model grid cell (0.5◦×0.5◦) for(a) rain forest, (b) agriculture, (c) peat forest
ACPD
4, 2117–2159, 2004Release and dispersion of vegetation and peat
fire emissions
B. Langmann and A. Heil
Title Page Abstract Introduction Conclusions References Tables Figures J I J I Back Close Full Screen / Esc
Print Version Interactive Discussion
© EGU 2004
(a)
(b)
Fig. 2. Number of ATSR fire counts per model grid cell over Indonesia during the period (a)
ACPD
4, 2117–2159, 2004Release and dispersion of vegetation and peat
fire emissions
B. Langmann and A. Heil
Title Page Abstract Introduction Conclusions References Tables Figures J I J I Back Close Full Screen / Esc
Print Version Interactive Discussion © EGU 2004 7.7. 4.8. 1.9. 29.9. 27.10. 24.11. 22.12. 19.1. 16.2. 16.3. 13.4. 11.5. 8.6 29.6.
July 1997 - June 1998
0 2 4 6 8 10 12 14 16TPMC [Mt (C) /week]
standard
high emission
Figure 3. Temporal variability of total particulate matter (TPMC) emissions from vegetation and peat fires in Indonesia and Northern Australia as determined for the standard and high emission case. The sum is 26.7 Mt(C)/year for the standard estimate and 118.7 Mt(C)/year for the high emission estimate, respectively.
Fig. 3. Temporal variability of total particulate matter (TPMC) emissions from vegetation and
peat fires in Indonesia and Northern Australia as determined for the standard and high emission case. The sum is 26.7 Mt(C)/year for the standard estimate and 118.7 Mt(C)/year for the high emission estimate, respectively.
ACPD
4, 2117–2159, 2004Release and dispersion of vegetation and peat
fire emissions
B. Langmann and A. Heil
Title Page Abstract Introduction Conclusions References Tables Figures J I J I Back Close Full Screen / Esc
Print Version Interactive Discussion © EGU 2004 7 8 9 10 11 12 1 2 3 4 5
Jul 1997 - Jun 1998
0 100 200 300 400 500Precip. [mm/month]
b) Area mean rainfall
land only
7 8 9 10 11 12 1 2 3 4 5Jul 1997 - Jun 1998
0 100 200 300 400 500Precip. [mm/month]
ObservationsREMO forecast mode REMO climate mode
a) Area mean rainfall
ocean + land
7 8 9 10 11 12 1 2 3 4 5Jul 1997 - Dec 1997
0 100 200 300 400 500 600 700Precip. [mm/month]
c) Rainfall as mean
over 7 Malaysian stations
7 8 9 10 11 12 1 2 3 4 5
Jul 1997 - Jun 1998
0 100 200 300 400 500Precip. [mm/month]
b) Area mean rainfall
land only
7 8 9 10 11 12 1 2 3 4 5Jul 1997 - Jun 1998
0 100 200 300 400 500Precip. [mm/month]
ObservationsREMO forecast mode REMO climate mode
a) Area mean rainfall
ocean + land
7 8 9 10 11 12 1 2 3 4 5Jul 1997 - Dec 1997
0 100 200 300 400 500 600 700Precip. [mm/month]
c) Rainfall as mean
over 7 Malaysian stations
105°E 110°E 115°E
5°N
0°
Figure 4. a) and b) Area mean of monthly total precipitation over Indonesia (96°-136° E, 14°S - 3° N) from July 1997 to June 1998. Observations are taken from the Global Precipitation Climatology Centre (www.dwd.dw/en/FundE/Klima/KLIS/int/GPCC). c) Monthly total precipitation as mean over 7 Malaysian stations from July to December 1997. Observations are taken from the Malaysian Meteorological Service. REMO model results are shown for the climate and forecast mode simulation. d) Location of the Malaysian stations.
d)
(a)
Fig. 4. (a) and (b) Area mean of monthly total precipitation over Indonesia (96◦–136◦E, 14◦S– 3◦N) from July 1997 to June 1998. Observations are taken from the Global Precipitation Clima-tology Centre (http://www.dwd.de/en/FundE/Klima/KLIS/int/GPCC).(c) Monthly total
precipita-tion as mean over 7 Malaysian staprecipita-tions from July to December 1997. Observaprecipita-tions are taken from the Malaysian Meteorological Service. REMO model results are shown for the climate and forecast mode simulation.(d) Location of the Malaysian stations.
ACPD
4, 2117–2159, 2004Release and dispersion of vegetation and peat
fire emissions
B. Langmann and A. Heil
Title Page Abstract Introduction Conclusions References Tables Figures J I J I Back Close Full Screen / Esc
Print Version Interactive Discussion © EGU 2004 7 8 9 10 11 12 1 2 3 4 5
Jul 1997 - Jun 1998
0 100 200 300 400 500Precip. [mm/month]
b) Area mean rainfall
land only
7 8 9 10 11 12 1 2 3 4 5Jul 1997 - Jun 1998
0 100 200 300 400 500Precip. [mm/month]
ObservationsREMO forecast mode REMO climate mode
a) Area mean rainfall
ocean + land
7 8 9 10 11 12 1 2 3 4 5Jul 1997 - Dec 1997
0 100 200 300 400 500 600 700Precip. [mm/month]
c) Rainfall as mean
over 7 Malaysian stations
(b) Fig. 4. (b) Continued.
ACPD
4, 2117–2159, 2004Release and dispersion of vegetation and peat
fire emissions
B. Langmann and A. Heil
Title Page Abstract Introduction Conclusions References Tables Figures J I J I Back Close Full Screen / Esc
Print Version Interactive Discussion © EGU 2004 7 8 9 10 11 12 1 2 3 4 5
Jul 1997 - Jun 1998
0 100 200 300 400 500Precip. [mm/month]
b) Area mean rainfall
land only
7 8 9 10 11 12 1 2 3 4 5Jul 1997 - Jun 1998
0 100 200 300 400 500Precip. [mm/month]
ObservationsREMO forecast mode REMO climate mode
a) Area mean rainfall
ocean + land
7 8 9 10 11 12 1 2 3 4 5Jul 1997 - Dec 1997
0 100 200 300 400 500 600 700Precip. [mm/month]
c) Rainfall as mean
over 7 Malaysian stations
(c) Fig. 4. (c) Continued.
ACPD
4, 2117–2159, 2004Release and dispersion of vegetation and peat
fire emissions
B. Langmann and A. Heil
Title Page Abstract Introduction Conclusions References Tables Figures J I J I Back Close Full Screen / Esc
Print Version Interactive Discussion
© EGU 2004
105°E 110°E 115°E
5°N
0° (d) Fig. 4. (d) Continued.