HAL Id: hal-00299108
https://hal.archives-ouvertes.fr/hal-00299108
Submitted on 16 Apr 2004
HAL is a multi-disciplinary open access
archive for the deposit and dissemination of
sci-entific research documents, whether they are
pub-lished or not. The documents may come from
teaching and research institutions in France or
abroad, or from public or private research centers.
L’archive ouverte pluridisciplinaire HAL, est
destinée au dépôt et à la diffusion de documents
scientifiques de niveau recherche, publiés ou non,
émanant des établissements d’enseignement et de
recherche français ou étrangers, des laboratoires
publics ou privés.
Development of the damage potential resulting from
avalanche risk in the period 1950-2000, case study
Galtür
M. Keiler
To cite this version:
M. Keiler. Development of the damage potential resulting from avalanche risk in the period 1950-2000,
case study Galtür. Natural Hazards and Earth System Science, Copernicus Publications on behalf of
the European Geosciences Union, 2004, 4 (2), pp.249-256. �hal-00299108�
SRef-ID: 1684-9981/nhess/2004-4-249
© European Geosciences Union 2004
and Earth
System Sciences
Development of the damage potential resulting from avalanche risk
in the period 1950–2000, case study Galt ¨ur
M. Keiler
Institute of Geography, University of Innsbruck, Innrain 52, A-6020 Innsbruck, Austria
Received: 29 September 2003 – Revised: 26 January 2004 – Accepted: 27 January 2004 – Published: 16 April 2004 Part of Special Issue “Multidisciplinary approaches in natural hazards”
Abstract. The risk resulting from natural hazards can be
derived from the combination of parameters of physical pro-cesses and the damage potential. Even though the damage potential has been taken into account more frequently, quan-tifying statements are still missing. This study presents a detailed recording of the damage potential in the study area and describes the development of the damage potential since 1950 in decades. In the community, the increase of the num-ber of buildings and their values is above average of the re-gion. 37% of the existing buildings are located in legally de-clared avalanche hazard zones. In these areas, the probability of presence of persons increased considerably due to tourism activities and shows substantial seasonal fluctuations. If the analysis of the damage potential and the hazard estimation are performed with the same degree of precision, risk analy-sis and risk management will be improved significantly.
1 Introduction
For the last few years, reinsurance companies have been pointing out the worldwide trend of increasing damage sums caused by natural hazards (see, e.g. MunichRe Group, 2003). A gradual change in dealing with natural hazards in the Alps has been triggered by major events with extremely high dam-ages, such as the avalanches of 1999 or the floods of 2002, as well as by decreasing public finances. This process of change is being discussed in various disciplines and can be described with the term “from hazard aversion to the culture of risk”. Safety science-oriented approaches dealing com-prehensively with risk (risk analysis, risk evaluation and risk management) ought to replace more and more the traditional process-oriented assessment of hazards. In these new ap-proaches, risk (R) is defined as the function
R = f (p, S) (1)
Correspondence to: M. Keiler
of the probability of occurrence (p) of a specific process and the height of the related damage potential (S). So far, natural hazards research has put emphasis on determining the hazard potential by examining, modelling and assessing individual processes. Little attention was given to the damage potential (Fuchs and Br¨undl, in press), which represents the second as-pect of risk. Only few approaches and conceptual proposals (e.g. Wilhelm, 1997; Heinimann et al., 1998; Borter, 1999) calculate the risk of property and human life, which jointly represent the collective risk of an area. However, an area-wide implementation as well as an adequate level of detail like in hazard assessment is still largely missing.
In the twentieth century, the natural avalanche activity seems to be neither significantly increasing nor decreasing, although the variability of events makes an exact statement difficult (Bader and Kunz, 1998; Schneebeli et al., 1998; Laternser, 2002). The damage potential in the Eastern Alps shows, however, a distinct and strong upward trend since the mid twentieth century. The Alpine society has undergone enormous socio-economic changes; the shift from an agri-cultural society to a modern service industry- and leisure-oriented society is reflected by an increasing usage of the Alps as an area of settlement, economic activities and leisure (B¨atzing, 1993). The changing exposition of valuables de-pends directly on the change of economic activities and the population development. Increasing population numbers as well as the demand for a larger individual living space, which are both responsible for a rising number of residential build-ings, have lead to higher sums of exposed valuables. Con-comitantly, the quality of the buildings and their equipment has increased significantly, mainly in order to meet the de-mands of the tourism industry. Next to a rising local popula-tion, seasonal workers, tourists with overnight stays and day guests cause peaks in the number of human lives exposed to natural hazards. These developments lead to increasingly high damage sums in the case of a natural hazard event.
The study area Galt¨ur is located in the inner Paznaun val-ley in the Tyrol, Austria. The community has undergone a transformation from farming village to tourism resort, which
250 M. Keiler: Development of the damage potential resulting from avalanche risk
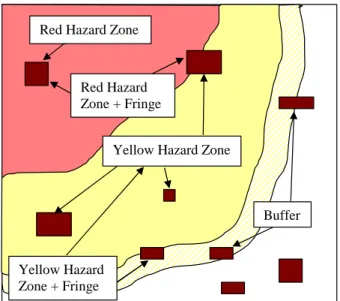
Red Hazard Zone
Red Hazard Zone + Fringe
Yellow Hazard Zone
Yellow Hazard Zone + Fringe
Buffer
Fig. 1. Schematic diagram of the classes used for the spatial
analy-sis.
is a typical process in the Eastern Alps. Since the avalanche event of 1999 it is also publicly known that the settlement of Galt¨ur is endangered by avalanches (Heumader, 2000; SLF, 2000). Taking Galt¨ur as an example, the development of the damage potential (buildings, persons) between 1950 and 2000 is pointed out in detail. This is conducted in steps of decades; the zones for avalanches in the currently valid haz-ard zone map are used for differentiating the community spa-tially. As a comparison, the development of the costs for mit-igation measures is presented. Finally, the influence of active and passive measures on the development of the damage po-tential is discussed.
2 Methods for recording and analysing of the damage potential
Diverse methods need to be applied to record tangibles with regard to number and monetary value as well as the probabil-ity of presence of the local population, seasonal workers and tourists.
2.1 Buildings
Data of the Tyrolean state government, division spatial plan-ning and statistics (TIRIS), forms the basis for the recording of the buildings and their location. The digital data was in-corporated in a GIS and updated by mapping in the field and interpretation of orthophotos. Fully detached farm buildings of agricultural businesses were recorded as separate build-ings. This makes it possible to allocate persons to the respec-tive buildings more precisely and to simplify the evaluation of the buildings. After applying this method, the number of identified buildings differs from the data of the official build-ing and apartment census of Statistic Austria (2003), which does not identify this usage group.
The values of the buildings were calculated by using the average prices of insurance companies for new buildings. The data required for this calculation (size and function of building, number of storeys) was recorded. The values cal-culated per building were combined with the spatial data in the GIS. In order to show the temporal development of the number and value of buildings, the original building sizes were determined with help of the community administration of Galt¨ur.
The changing size of buildings was taken from construc-tion plans or descripconstruc-tions, and thus it was possible to trace the buildings back to their original size in 1950. Some buildings were erected in lieu of old, levelled down buildings (mainly farms). In cases, where the original building size could not be determined, average values for the sizes of the living and working quarters of old, still existing farms were adopted. In order to show a development that accounts for inflation, the evaluation took place with prices of the year 2002 for all steps of decades.
2.2 Persons
The development of the permanent population of Galt¨ur since the mid twentieth century was determined by using available statistics, while the seasonal fluctuation of tourists was recorded by consulting tourism statistics. Thereby, the distribution and occupancy rate of beds was given special at-tention.
2.3 Mitigation measures
Costs, type and year of construction of mitigation measures for the various avalanche tracks were recorded at the Federal Service for Torrent, Erosion and Avalanche Control, District Office Imst and Landeck, Tyrol for the period of 1949–2001. This data was statistically analysed and then incorporated in the GIS. The recorded costs were adjusted to the price level of 2002 after having been reassessed in respect to the price rise.
2.4 Spatial analysis
For pointing out the spatially differentiated development of the study area, the building data was intersected with the haz-ard zones for avalanches via GIS. The hazhaz-ard zone map of the community of Galt¨ur was completed by the Federal Service for Torrent, Erosion and Avalanche Control, District Office Imst and Landeck, Tyrol in 1986 and authorised in 1995. The basis of hazard zone mapping in Austria is the forestry law of 1975 and the respective decree of 1976. The zones are identified by taking the intensity of a design event with a re-currence probability of 150 years as a basis (decree of “Bun-desministerium f¨ur Land- und Forstwirtschaft, 30 July 1976, ¨uber die Gefahrenzonenpl¨ane”, BGBL, Nr. 436/1976 § 6). As in the red zone it has to be anticipated that buildings are destroyed and persons in buildings at the risk of their lives, any building activity is forbidden. In the yellow zone, avalanches have an impact on the economic and individual
Fig. 2. Galt¨ur in the 1920s (a) and in the year 2000 (b).
use of the area and can damage buildings. When observ-ing buildobserv-ing requirements and restrictions, it is, however, un-likely that buildings are destroyed and people in buildings
endangered ( ¨OROK, 1986).
The spatial analysis was conducted in five different categories, which are “red zone”, “yellow zone”, “red zone + fringe”, “yellow zone + fringe” and “10 m-buffer”:
• Buildings with their centre clearly located in a zone, are
assigned to that zone (see Fig. 1)
• Buildings that are only partially located in a zone, are
assigned to the categories “zone + fringe”; these cate-gories include also the buildings of the respective zone.
• The zones were buffered by ten meters in the GIS, in
or-der to be able to point out developments in areas close to the zones. In this area, the buildings that were assigned to the categories “zone + fringe” are not included. The development of the hazard zones is compared with the development of the whole area of the community. In order to describe the “hazard zones”, the categories “red zone” and “yellow zone + fringe” are added up.
0 25 50 75 100 125 150 175 200 225 250 275 300 325 1950 1960 1970 1980 1990 2000 Year Number of Buildings Buffer
Yellow Hazard Zone + Fringe Yellow Hazard Zone Red Hazard Zone Outside of Zones
Fig. 3. Development of the number of buildings in the period 1950–2000.
3 Results
3.1 Buildings
In 1950, 115 buildings were located in the permanent settle-ment area of Galt¨ur (Fig. 2a), five of which in the present red and 25 in the present yellow zone. At this time, no hazard zones had been devised yet. Another 13 buildings were only partly located in the yellow zone. 18 buildings were located close to the yellow zone in the 10 m-buffer. In the period of 1950–2000, the number of buildings in the yellow zone in-creased by the factor 3.2 to 80 buildings (see Figs. 3 and 2b), which is higher than the average increase in the community of 2.6 (304 buildings). The highest increase took place be-tween 1950 and 1980, since then the building activities were slightly less intense. Taking the fringe area of the yellow zone into account, the increase of buildings amounts to the factor 2.7 (101 buildings), while in the 10 m buffer the factor of increase was only 1.8. The unexpectedly low development in the fringe area of the yellow zone and the adjacent buffer can be explained by the fact that many areas (village centre to fraction of Wirl, west of fraction of Tschafein) are endan-gered by avalanches from both slopes of the valley. There-fore, the affected valley area is defined as yellow or red zone. Moreover, the zones are either delimited along edges of ter-races or streets, where no building activities are possible. Ad-ditionally, the delimitation is found in remote, agriculturally used areas. In the red zone, the number of buildings has dou-bled, and in the fringe area it has risen by the factor 2.4. After the introduction of the hazard zone map in 1986, any build-ing activity was forbidden. Before, only one buildbuild-ing had been erected after 1950 in the decade of 1960/70. In the period of 1990–2000, the number of buildings rose, which can be ascribed to the construction of new buildings behind an avalanche dam called “Landli” (exception to hazard zone map because of dam, oral information, community of Galt¨ur, 2002). This dam had been made higher and longer after the avalanche event of 1999.
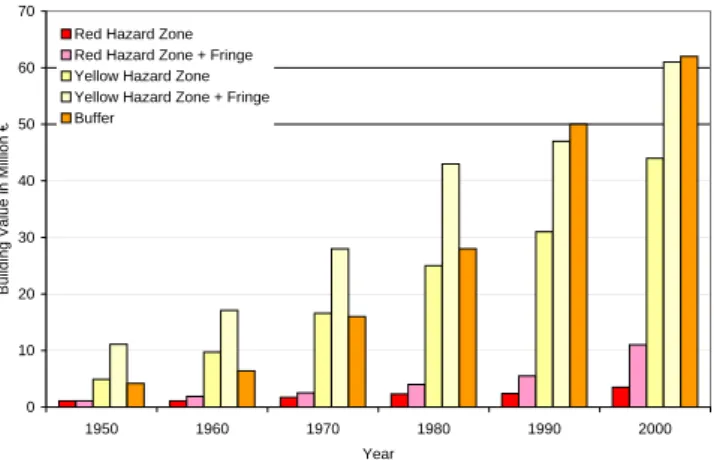
252 M. Keiler: Development of the damage potential resulting from avalanche risk 0 10 20 30 40 50 60 70 1950 1960 1970 1980 1990 2000 Year
Building Value in Million €
Red Hazard Zone Red Hazard Zone + Fringe Yellow Hazard Zone Yellow Hazard Zone + Fringe Buffer
Fig. 4. Development of the value of buildings in EUR million in the
period 1950–2000. 100 200 300 400 500 600 700 800 900 1000 1100 1200 1300 1400 1500 1600 1950 1960 1970 1980 1990 2000 Year Index % Total Community Red Hazard Zone Red Hazard Zone + Fringe Yellow Hazard Zone Yellow Hazard Zone + Fringe Buffer
Fig. 5. Proportional development of the value of buildings, 1950 as
basis.
In the decade of 1980/1990, farm buildings had been erected before the hazard zone map was completed. These buildings are only used during the summer and are protected from avalanches by boulders in the winter. The percent-age of buildings in the hazard zones (red zone and yellow zone + fringe) in proportion to the total number in the com-munity has slightly sunk from 37.4% in 1950 to 36.2% in the year 2000.
In 1950, the total value of buildings was EUR 1.1 mill. in the red zone including the fringe area (red zone + fringe) and EUR 5.1 mill. in the yellow zone (Fig. 4). Adding the buildings of the fringe area (yellow zone + fringe), the value totalled EUR 10.9 mill. In the 10-m buffer, the value was EUR 4.2 mill. in 1950 already. By 2000, the total value of buildings quadrupled to EUR 3 mill. in the red zone (Fig. 5). In the red zone including the fringe area, the value rose by the factor 10. This extreme increase is due to the erection of the Alpinarium, which is located on the safe side of the newly constructed avalanche dam “Egge”. In the yellow zone, the total value of buildings rose significantly by EUR 38.8 mill. (equals factor 9). When including the fringe area, a plus
0 250 500 750 1000 1250 1500 1750 2000 2250 2500 2750 3000 3250 3500 3750 4000 4250 4500 4750 1951 1961 1971 1981 1991 2001 Year Number Guest Beds Inhabitants
Fig. 6. Development of the population and the number of beds in
Galt¨ur in the period of 1951–2001, (Source: Statistik Austria census 1951–2001, Landesstatistik Tirol, Gemeinde Galt¨ur).
0 50 100 150 200 250 300 350 400 450 500 1950 1952 1954 1956 1958 1960 1962 1964 1966 1968 1970 1972 1974 1976 1978 1980 1982 1984 1986 1988 1990 1992 1994 1996 1998 2000 Year Overnight Stays in 1000 Summer Winter Total
Fig. 7. Development of over-night-stays in Galt¨ur in the period
1950–2000 (Source: Gemeinde Galt¨ur).
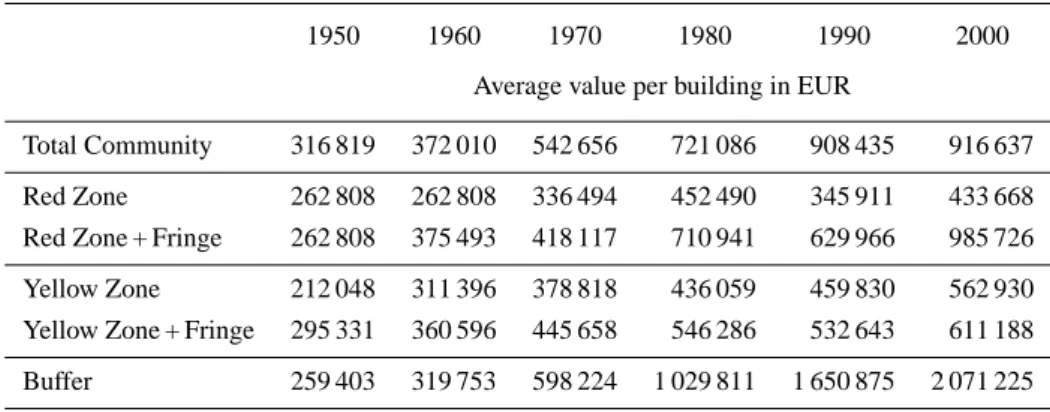
of EUR 49.6 mill. is recorded (equals factor 6). In the 10-m buffer, the value of buildings totalled EUR 65.8 10-mill. in 2000 (equals factor 15 since 1950). This enormous increase is based on the expansion or new erection of six hotels, which are partly located in the buffer. The total value of all build-ings in the community rose by the factor 8 since 1950. The value of buildings increased because of the higher number as well as the bigger size of buildings, as can be shown by the average values per building (Table 1). The high average value in the fringe area between red and yellow zone are due to a hotel and the Alpinarium. The average value per build-ing rose in the whole of the community by the factor 3, in the yellow zone by the factor 2.7, and in the red zone only by the factor 1.7. The average value per building rose most signifi-cantly in the buffer by the factor 8. In 1950, the proportion of the value of buildings was 3% in the red zone and 31.4% in the yellow one. By 1985, these proportions dropped to 1.1% in the red and 19.5% in the yellow zone. In 2000, they rose again to 1.4% and 22.5%, respectively.
For the analyses, the buildings were divided into nine classes according to their functions (Table 2). In 2000, most
Table 1. Average value per building in EUR; development between 1950 and 2000.
1950 1960 1970 1980 1990 2000 Average value per building in EUR
Total Community 316 819 372 010 542 656 721 086 908 435 916 637 Red Zone 262 808 262 808 336 494 452 490 345 911 433 668 Red Zone + Fringe 262 808 375 493 418 117 710 941 629 966 985 726 Yellow Zone 212 048 311 396 378 818 436 059 459 830 562 930 Yellow Zone + Fringe 295 331 360 596 445 658 546 286 532 643 611 188 Buffer 259 403 319 753 598 224 1 029 811 1 650 875 2 071 225
Table 2. Classification of the building functions. Comparison between 1950 and 2000.
1950 2000
Building Classes Total Red Yellow Buffer Total Red Yellow Buffer Zone Zone Zone Zone
Residential 66 2 24 9 53 1 21 5 Public 0 0 0 0 7 0 2 1 Hotel 4 0 1 1 27 0 5 7 Guesthouses + B&B 21 1 4 4 138 4 36 17 Business 1 0 0 0 6 0 1 0 Agricultural 18 1 8 3 56 4 30 3 Infrastructure 1 1 0 0 5 1 1 0 Church 2 0 1 1 2 0 1 1 Abandoned 2 0 0 0 10 0 4 0 Sum 115 5 38 18 304 10 101 34
of the buildings that are located in the hazard zones be-long to the classes of guesthouses and bed and breakfasts (36%), agricultural buildings and garages (31%) and resi-dential buildings (20%). In the yellow zone, the class of guesthouses and bed and breakfasts rose by the factor nine, which represents the highest increase. In the 10-m buffer the classes of hotels (factor seven) and of guesthouses and bed and breakfasts (factor 4.3) rose most significantly. Over-all, the number of buildings used exclusively for residential purposes is decreasing, while the number of buildings with tourist infrastructure is rising strongly. Most of the uninhab-ited/unused buildings are old, abandoned farms.
3.2 Persons
In the twentieth century, the population of Galt¨ur has more
than doubled (see Fig. 6). The rise in the population is
strongly connected with the economic development of the region. By establishing three huts of the Alpine Clubs in the end of the nineteenth century, alpinists and, later, skiers were
attracted to this remote region. This is regarded as the begin-nings of tourism in the inner Paznaun valley. The population, whose main source of income had been farming, discovered tourism as a sideline. In 1909, the first hotel was opened, an-other four followed between then and the 1930s. After the Second World War, the radical transformation from farm-ing community to tourism resort was triggered by the con-struction of the first ski lift in 1950 and the opening of the Silvretta Hochalpenstraße (scenic road) in 1953. This shift can be clearly recognised in the development of guest beds (see Fig. 6) and overnight stays (see Fig. 7). The tourism of Galt¨ur is characterised by a dominant winter season. The months November to April account for an average of 70% of overnight stays. During this period, the occupancy rate of beds varies between 40% and 50% (Gemeinde Galt¨ur, 2003), while it ranges around 15% and 25% in the summer. In the months of February and March, the occupancy rate can rise to 80% (Landesstatistik Tirol, 2003a); at some weekends and during Christmas time an occupancy rate of nearly 100% can be assumed. In Fig. 8, the economic effects of the avalanche
254 M. Keiler: Development of the damage potential resulting from avalanche risk 0 10 20 30 40 50 60 70 80 90 1996/97 1997/98 1998/99 1999/2000 2000/01 2001/02 Winter
Occupancy Rate of Beds (%)
November December January February March April
Fig. 8. Occupancy rate of beds in the winter months.
event in February 1999 can be clearly recognised; a minus of
≈21% in overnight stays was recorded for the community of
Galt¨ur. By launching cost-intensive advertising campaigns, pre 1999 numbers in overnight stays were reached again in the year of 2002. A detailed analysis of the occupancy rates in the winter months from 1996/1997 to 2001/2002 shows clearly how significantly the numbers declined from Febru-ary or March 1999 until the winter of 2001/2002. Due to the high occupancy rates in winter, an average of 4700 persons, composed of local inhabitants, seasonal workers and tourists, is found in Galt¨ur during the winter months. In comparison, a sum of ≈ 850 persons can be determined for 1950. There-fore, the probability of presence rose by the factor 5.5 be-tween 1950 and 2000. The following data refers to persons present in the winter months. As the population census is al-ways conducted on the 15th of May, seasonal workers of the winter are not included.
Only 18 of the 875 inhabitants of Galt¨ur in the year 2002 live in the red zone, another six live in buildings that are par-tially located in the red zone. In this area, there are 47 guest beds; 54 beds exist in the fringe area. In the yellow zone, the numbers of inhabitants and guest beds rise to 197 and 532, respectively. If the fringe area is taken into account, the numbers increase to 256 inhabitants and 757 beds. 125 local residents live in the 10-m buffer and 894 beds are rented out. 31.3% (274) of the registered local population lives in the ar-eas identified as hazard zones, and 21.6% (804) of all guest beds are located here.
3.3 Costs of mitigation measures – damage potential
Nine of the community’s 26 avalanche catchment areas have avalanche fences, in another two avalanche tracks fences are being set up. In the area of Predigtberg, fences from the 1970s are renewed and new ones added. Avalanche dams
were erected in the run out zones of the ¨Außere
Wasserleiter-and Weiße Riefe-avalanches after the event of 1999. A
few houses are protected by avalanche deflectors and walls, which were mainly built by the Federal Service for Tor-rent, Erosion and Avalanche Control, District Office Imst and
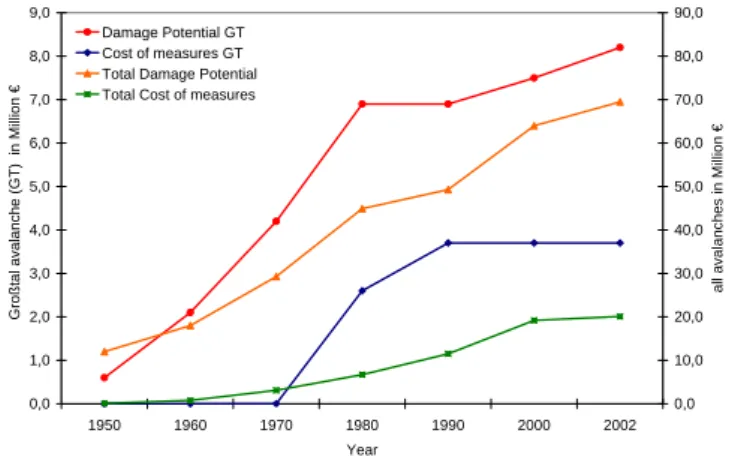
GT+alle engl. Page 1 0,0 1,0 2,0 3,0 4,0 5,0 6,0 7,0 8,0 9,0 1950 1960 1970 1980 1990 2000 2002 Year
Großtal avalanche (GT) in Million €
0,0 10,0 20,0 30,0 40,0 50,0 60,0 70,0 80,0 90,0
all avalanches in Million €
Damage Potential GT Cost of measures GT Total Damage Potential Total Cost of measures
Fig. 9. Comparison between the development of damage potential
(= building values) and cost of measures (without maintenance) for all avalanche tracks in the community as well as for the Großtal-avalanche.
Landeck, Tyrol. In 1950, 33 buildings were located in areas endangered by avalanches, 12 of which were protected by walls and avalanche deflectors.
The example of the Großtal-avalanche illustrates that mit-igation measures were implemented after a high rise in the value of buildings until the 1970s (Fig. 9). After the hazard zone map had been completed in 1986, the value of buildings increased by the year 2000 by EUR 0.6 mill., due to recon-structions and expansions of existing buildings. By 1990, the mitigation measures were completed.
The damage potential is steadily rising in all run-out ar-eas of the community and amounts to 111 buildings with a value of nearly EUR 64 mill. in the year 2000 (Fig. 9). The costs for mitigation measures were slightly higher af-ter the event of 1999 and reach a total cumulative value of EUR 20 mill. for the period of 1949–2001. The costs for regular controls, maintenance work and repairs of the tech-nical measures, which are mandatory for a permanent effi-ciency of the protective measures, are not included in this sum. It was possible to protect 70 buildings with a total value of EUR 45 mill. by introducing mitigation measures. 42% of the buildings are protected by avalanche fences, 33% by protective walls and 25% by avalanche dams. Another 15 buildings (total value of EUR 16 mill.) will be protected
after the avalanche fences of the ¨Außere Wasserleiter- and
Weiße-Riefe-avalanche are completed.
4 Conclusions
Since the 1950s, a significant change in the number and value of buildings, population and infrastructure for tourism has taken place in the community of Galt¨ur. Parallel to the high increase of the damage potential, endangered areas were protected by technical measures since the 1960s and mea-sures of spatial planning since 1986. Thus, an additional spatial increase of the damage potential was prevented.
The number of buildings in Galt¨ur has risen above aver-age in comparison to the district of Landeck or the federal state of Tyrol (Landesstatistik Tirol, 2003b). The highest in-crease in percentages took place in the yellow zone, while the lowest ones were in the 10-m buffer and in the red zone. The proportional increase of the value of buildings was much higher than the proportional increase in the number of build-ings. The highest value was reached in the 10-m buffer. The increase of values in the yellow zone is similar to the one of the whole community, yet slightly higher. It sank by 1990 below the latter and rose again more distinctly due to the establishment of the Alpinarium. On the one hand, the val-ues increased because of the higher number of buildings, on the other hand, because of changes in the function of build-ings. Both factors account for the socio-economic changes in the village. Additionally, the buildings in Galt¨ur are better equipped than the average building in the federal state of
Ty-rol ( ¨OSTAT, 1981; 1991; 2001). Moreover, the values rose
due to the reconstructions and expansions of buildings. This development leads also to gradually increasing values in the red zone. Larger buildings (e.g. hotels, Alpinarium) as well as the topographical delimitation influence the results of the spatial categories strongly.
In the twentieth century, the population of Galt¨ur has risen substantially because of the development of tourism. As the winter tourism is dominant, the probability of presence of persons is during the winter months six times higher than during off-season. In the official hazard zones, the number of persons affected can triple when the occupancy rate of beds is high. Determining the number of persons requires the inclusion of the temporary population, such as seasonal workers and persons with a second home in Galt¨ur. Thus, the numbers can deviate considerably from the numbers of-ficially recorded in the population census. These develop-ments need to be regarded when devising or improving evac-uation plans, in order to render possible an efficient and ef-fective procedure in emergency cases.
In 1950, one third of the buildings in endangered areas were protected individually; at the moment, two thirds of the existing buildings are protected. In addition, building requirements and restrictions need to be observed, the com-pliance of which being controlled by the community. The damage potential in areas, which are already protected, rises significantly. Events in the avalanche winter of 1999 like snowed-in avalanche fences and avalanches in slopes with fences (SLF, 2000), point out the remaining hazard. By re-garding the hazard zone maps, the spatial development and the increase of the damage potential ought to be reduced and directed. The proportion of the number and values of build-ings in the hazard zones to those of the whole community has changed only minimally. Strengthening the tools of spatial planning can help to reduce the damage potential in hazard zones.
The hazard zones are identified by analysing historic events, making a terrain analysis and by modelling pro-cesses, in order to estimate ranges and occurring pres-sures. Zones can be extended, if uncertainties are shown
in the hazard assessment (Barbolini et al., 2002; FAN, 2003), or if delimitation criteria change (decree (52.240/10-VC6a/99) from 1 July 1999, “Richtlinien f¨ur die Erstellung von Gefahrenzonenpl¨anen”, Bundesministerium f¨ur Land-und Forstwirtschaft) on the basis of new findings. In the buffer, which is only 10 m wide, the damage potential devel-oped most significantly (factor 17) in the community since the 1960s. In the narrow band, 25% of the total value and 21% of the persons potentially present in the winter months are concentrated.
5 Discussion
The analysis conducted in this study points out the vari-ous developments of and influences on the damage poten-tial. Following improvements in dealing with natural hazards could be made, if the damage potential were considered:
• By having knowledge of the damage potential, the
fu-ture development of settlements can be better controlled and directed.
• With the analysis of the damage potential being as
de-tailed as the hazard assessment, the result of the risk analysis is rendered more significant, as both compo-nents are equally incorporated in the risk formula.
• The analysis of the damage potential forms the basis
for monitoring the actual risk, which can provide im-portant information for a short-term, situation-oriented and risk-based decision-making, as needed by, e.g. avalanche commissions.
• Scenarios show how changes on the process or
dam-age potential side can influence different states of risk. This allows for planning appropriate and target-oriented measures.
• The actual damage potential as well as its development
have to be included in the ongoing discussion on “back-zoning”.
The considerable change in society and the resulting change in the existing damage potential point out, that recording and analysing potentially endangered persons and tangibles make a valuable and essential contribution to the idea “from hazard aversion to the culture of risk”.
Acknowledgements. Many thanks go to H. Agerer, Federal Service
for Torrent, Erosion and Avalanche Control, Tyrol, for his sugges-tions and support and to the Federal Service for Torrent, Erosion and Avalanche Control, District Office Imst and Landeck, Tyrol for making their data available. Furthermore, the authors would like to thank K. Walser and the community of Galt¨ur for their help, as well as S. Fuchs, Swiss Federal Institute for Snow and Avalanche Research (SLF) and A. Zischg, Institute for Geography, for the inspiring discussions, and M. Hama for giving help in the translation of the paper. The research for this paper was carried out with a grant from the MunichRe Reinsurance Company, Germany.
256 M. Keiler: Development of the damage potential resulting from avalanche risk
Edited by: T. Glade Reviewed by: two referees
References
Bader, S. and Kunz, P.: Klimarisiken – Herausforderung f¨ur die Schweiz, vdf Hochschulverlag an der ETH, Z¨urich, 1998. Barbolini, M., Natale, L., and Savi, F.: Effects of Release
Condi-tions Uncertainty on Avalanche Hazard Mapping, Natural Haz-ards, 25, 225–244, 2002.
B¨atzing, W.: Der sozio-¨okonomische Strukturwandel des Alpen-raumes im 20. Jahrhundert, Geographica Bernensia, P26, 1993. Borter, P.: Risikoanalyse bei gravitativen Naturgefahren,
Bunde-samt f¨ur Umwelt, Wald und Landschaft, Bern, 1999.
FAN (Forstliche Arbeitsgruppe Naturgefahren): Ber¨ucksichtigung von Schutzmaßnahmen bei der Gefahrenbeurteilung, Ergebnisse des Workshops der Forstlichen Arbeitsgruppe Naturgefahren, 29–30 Oktober 2002, Bad Ragaz, 2003.
Fuchs, S. and Br¨undl, M.: Damage Potential and Losses Resulting from Snow Avalanches in Settlements of the Canton of Grisons, Switzerland, Natural Hazards, in press, 2004.
Gemeinde Galt¨ur: Statistik Galt¨ur, http://.www.galtuer.tirol.gv.at/ betten.htm, 2003.
Heinimann, H., Hollenstein, K., Kienholz, H., Krummenacher, B., and Mani, P.: Methoden zur Analyse und Bewertung von Naturgefahren, BUWAL Umwelt-Materialien 85, Bern, 1998.
Heumader, J.: Die Katastrophenlawinen von Galt¨ur und Valzur am 23 und 24 Februar 1999 im Paznauntal/Tirol, Internationale Forschungsgesellschaft Interpraevent, Intern. Symposion Inter-praevent 2000, 1, 397–410, 2000.
Landesstatistik Tirol: Tourismus, http://www.tirol.gv.at/themen/ zahlenundfakten/statistik/tourismus.shtml, 2003a.
Landesstatistik Tirol: Entwicklung der Geb¨aude, http://www.tirol. gv.at/themen/zahlenundfakten/statistik/gebaude wohnungen. shtml, 2003b.
Laternser, M.: Snow and Avalanche Climatology of Switzerland, Z¨urich, 2002.
MunichRe Group: Topics – Annual Review Natural Catastrophes 2002, Munich, 2003.
¨
OSTAT: Statistische Jahrbuch – Wohnungswesen, Statistik Austria, Wien, 1981, 1991, 2001.
Schneebeli, M., Laternser, M., F¨ohn, P., and Ammann, W.: Wech-selwirkungen zwischen Klima, Lawinen und technischen Mass-nahmen, vdf Hochschulverlag an der ETH, Z¨urich, 1998. SLF: Der Lawinenwinter 1999, Eidgen¨ossisches Institut f¨ur
Schnee- und Lawinenforschung, Davos, 2000.
Statistik Austria: Wohn- und Geb¨audez¨ahlung, http://www.statistik. at/index.shtml, 2003.
Wilhelm, C.: Wirtschaftlichkeit im Lawinenschutz, Eidgen¨os-sisches Institut f¨ur Schnee- und Lawinenforschung, Davos, 1997.