HAL Id: hal-00299101
https://hal.archives-ouvertes.fr/hal-00299101
Submitted on 15 Apr 2004
HAL is a multi-disciplinary open access
archive for the deposit and dissemination of
sci-entific research documents, whether they are
pub-lished or not. The documents may come from
teaching and research institutions in France or
abroad, or from public or private research centers.
L’archive ouverte pluridisciplinaire HAL, est
destinée au dépôt et à la diffusion de documents
scientifiques de niveau recherche, publiés ou non,
émanant des établissements d’enseignement et de
recherche français ou étrangers, des laboratoires
publics ou privés.
geomorphological catastrophes in Italy (SICI): a tool for
managing landslide and flood hazards
F. Guzzetti, G. Tonelli
To cite this version:
F. Guzzetti, G. Tonelli. Information system on hydrological and geomorphological catastrophes in
Italy (SICI): a tool for managing landslide and flood hazards. Natural Hazards and Earth System
Science, Copernicus Publications on behalf of the European Geosciences Union, 2004, 4 (2),
pp.213-232. �hal-00299101�
SRef-ID: 1684-9981/nhess/2004-4-213
© European Geosciences Union 2004
and Earth
System Sciences
Information system on hydrological and geomorphological
catastrophes in Italy (SICI): a tool for managing landslide and flood
hazards
F. Guzzetti and G. Tonelli
Consiglio Nazionale delle Ricerche, Istituto di Ricerca per la Protezione Idrogeologica, via della Madonna Alta 126, 06128 Perugia, Italy
Received: 13 October 2003 – Revised: 20 January 2004 – Accepted: 22 January 2004 – Published: 15 April 2004 Part of Special Issue “Geo-databases for Natural Hazards and Risk Assessment”
Abstract. Since 1990, we have maintained a database of
his-torical information on landslides and floods in Italy, known as the National Research Council’s AVI (Damaged Urban Areas) archive. The database was originally designed to re-spond to a request of the Minister of Civil Protection, and was aimed at helping the regional assessment of landslide and flood risk in Italy. The database was compiled in 1991– 1992 to cover the period 1917 to 1990, and then updated to cover systematically the period 1917 to 2000, and non-systematically the periods 1900 to 1916 and 2001 to 2002. The database currently contains information on more than 32 000 landslide events occurred at more than 21 000 sites, and on more than 29 000 flood events occurred at more than 14 000 sites. Independently from the AVI archive, we have obtained other databases containing information on damage caused by mass movements and inundations, daily discharge measurements and solid-transport measurements at selected gauging stations, bibliographical and reference information on landslides and inundations, and a catalogue of National legislation on hydrological and geological hazards and risk in Italy. The databases are part of an information system known as SICI (an Italian acronym for Sistema Informativo sulle Catastrofi Idrogeologiche, Information System on Hydrolog-ical and GeomorphologHydrolog-ical Catastrophes), which is currently the largest single repository of historical information on land-slides and floods in Italy. After an outline of the history and evolution of the AVI Project archive, we present and discuss: (a) the structure of the SICI information system, including the hardware and software solutions adopted to maintain, manage, update, use and disseminate the information stored in the various databases, (b) the type and amount of informa-tion stored in each database, including an estimate of their completeness, and (c) examples of recent applications of the information system, including a web-based GIS system to Correspondence to: F. Guzzetti
(fausto.guzzetti@irpi.cnr.it)
show the location of sites historically affected by landslides and floods, and an estimate of geo-hydrological (i.e. land-slide and flood) risk in Italy based on the available historical information.
1 Introduction
Inundations and landslides are frequent in Italy and histori-cal information describing landslides and floods dates back to the Roman Age. The oldest known flood along the Tiber River in Rome occurred in 414 BC. Pliny the Elder re-ported landslides triggered by a large earthquake occurred during the Battle of Trasimeno, in the second Punic War in 264 BC. The societal and economic impact of flooding and slope failures is high in Italy. In the 20th century, a period for which the information is available, the toll amounts to: 10 000 deaths, missing persons and injured people, more than 700 000 homeless people, thousands of houses and bridges and hundreds of kilometres of roads and rails destroyed or damaged, and impact on the cultural heritage which is un-matched in any other country. In the last two decades of the 20th century floods, debris-flows and landslides have caused damage estimated in excess of EUR 17 000, a figure that is probably underestimated (Fig. 1). In the Appendix A we briefly describe some of the most catastrophic landslide and flood events in the period from 1950 to 2000, including the type and extent of damage.
For the past fourteen years we have maintained and up-dated a database of historical information on landslides and floods in Italy, known as the National Research Council’s AVI (Damaged Urban Areas) archive (Guzzetti et al., 1994). The database originally covered the period 1917 to 1990 and was subsequently updated to cover systematically the period from 1917 to 2000, and non-systematically the periods from 1900 to 1916 and from 2001 to 2002. Starting in 1998 and
Figure 1 0.8 1,115 96. 4 382 525 85. 1 7,546 304 4,972 255 1,317 275 0.01 8.1 9.1 870 11, 452 5,165 0.01 0.1 1 10 100 103 104 105 Imperia, D e c. 1910
Piedmont, Sep. 1944 Campani
a , Oct. 1949 Cal a b ria, Oct. 195 1 Campani a , Oct. 1954 Vajo nt, Oct. 196 3
Florence and NE, Nov. 1966
Genoa, Oct. 1970 Calabria, Dec. 1972 Piedmomt, Aug. 1978 Ancon a , D e c. 19 82 Lombardy , M a y 1983
Liguria, Aug. 1984 Stava, Jul. 1985 Senise, Jul
. 1986 Lombardy , M a y 1983 Piedmont , Nov . 1994 Piedmont, Oct. 2000
Damage, Million Euro
Fig. 1. Economic damage produced by individual landslides and
flooding events in Italy in the period from 1910 to 2000. Green bars are single landslide events. Blue bars are multiple landslides and flooding events.
independently from the AVI archive, we have assembled a collection of databases and digital catalogues containing a variety of historical, geographical, and bibliographical in-formation on landslides and floods in Italy. The databases contain data on damage caused by mass movements and in-undations, daily discharge measurements and solid-transport measurements at selected gauging stations, bibliographical and reference information on landslides and inundations, and a catalogue of national legislation on hydrological and geo-logical hazards and risk, which is copious in Italy.
Beginning in 1999, we have merged the AVI project database and the other digital catalogues into a single infor-mation system on hydrologic and geomorphologic hazards and risk. The information system, known as SICI (an Ital-ian acronym for Sistema Informativo sulle Catastrofi Idroge-ologiche, Information System on Hydrological and Geomor-phological Catastrophes), is the largest, publicly available source of information on landslide and flood hazards and risk in Italy. In this paper, we illustrate the history and the recent evolutions of the AVI archive, including the latest products, and we introduce SICI, presenting the structure and content of the information system, and describing the adopted hard-ware and softhard-ware solutions. We then present and discuss recent applications of the available historical information on mass movements and inundations to help ascertaining land-slide and flood hazards and risk in Italy.
2 The AVI Project archive
On 23 June 1989, the Italian Minister of Civil Protec-tion requested the Italian NaProtec-tional Research Council (CNR),
Group for Hydrological and Geological Disasters Prevention (GNDCI), to compile an inventory of sites historically af-fected by landslides and floods in Italy, for the period 1918– 1990 (Guzzetti et al., 1994). The idea of collecting histori-cal information on natural catastrophes was not new in Italy. Toward the end of XIX century natural scientists collected a wealth of information on a variety of natural disasters includ-ing epidemics (Corradi in 1865–1894), earthquakes (Mer-calli in 1883 and Baratta in 1901), floods (Bottoni in 1873), and landslides (Almagi`a in 1907–1910). More recently, large and expensive efforts have been made to collect historical in-formation on earthquakes and their effects (Postpischl, 1985; Boschi et al., 1997).
To respond to the Minister request, CNR GNDCI in 1990– 1992 designed and completed an inventory of historical in-formation on landslides and floods in Italy. The project be-came known as the AVI project. Between 1991 and 1992 seventeen teams collected information on mass-movements and floods occurred in Italy in the 20th century. Guzzetti et al. (1994) described the original inventory, including the framework to collect, compile and summarize the informa-tion, the structure of the database used to store the data, a critical analysis of the type and amount of information col-lected, a description of the preliminary results obtained, and a discussion of possible applications of the historical infor-mation.
Since 1992, we have made considerable efforts to keep the database updated and to search for new data on histor-ical landslide and flood events. The inventory was fist up-dated for the period 1991–1996 by searching 55 local or re-gional journals, for a total of more than 120 000 newspaper issues screened. Updates for the period 1997–1998 and for the period 1999–2000 were completed though the systematic search of 59 local and regional newspapers, and the review of technical and events reports, and of scientific papers and books published by CNR GNDCI. Newspapers maintaining a web site were an additional source of information on re-cent events, and on occasion they provided detailed accounts of old events. Since 1999, we check daily the web pages of eleven regional and national newspapers searching for infor-mation on landslides and floods. An average of 700 newspa-per articles is found every year, which represent about 75% of the information found through the traditional systematic screening of local and regional newspapers carried out in the newspaper libraries. The web sites of local and regional gov-ernments and of regional or national offices provided addi-tional documents and reports on recent and historical land-slide and flood events.
We also made significant efforts to check, validate, or-ganize and disseminate the information on landslides and floods. Our activities included:
• Validation of the project database, including the cor-rection of all typing, grammatical and language er-rors present in the numerous (329) database fields. We compared the information stored into the database against the original archive material compiled during
the inventory, and we moved information written in the wrong section during the compilation of the inventory in the appropriate fields of the database.
• Storage in the database of all the “source forms” (i.e. forms used to store information on an individual event obtained from a single source of information; see Guzzetti et al., 1994) compiled during the main inven-tory phase in 1990–1992, and which were not origi-nally digitized. Digitization of these forms increased the database content by about 25%.
• Digitization of the original newspaper articles as Adobe Acrobat® Portable Document Format (PDF) files. Ap-proximately 22 100 newspaper articles were digitized, and scanning of the remaining articles is in progress. During the three successive updates of the inventory, new articles found in the journal libraries (“emeroteca”) were scanned on site and latter transformed into PDF files. More recently, articles found in the Internet are saved directly as PDF files.
• Definition of an efficient structure for the database used to store the information on historical landslides and floods. We adjusted the relational structure of the database to accommodate new information, to respond to new research needs, and to allow for the optimal dis-semination of the information through the Internet. We designed specific software to manage the information and to help collect new information.
• Definition of the geographical coordinates of the sites historically affected by landslides and floods. The geo-graphical coordinates were obtained through a long and difficult work that involved: careful reading of the origi-nal source of information (i.e. newspaper article, techni-cal report, scientific publication, etc.), locating the site affected by the damaging event on topographic maps or road atlases, mapping the location of the landslide or the inundated site as a point on topographic maps at 1:100 000 or 1:25 000 scale, and obtaining the geo-graphical coordinate through digitization. A degree of certainty in the location was given to each site, coping with the inevitable uncertainty in the location of many sites based on their name. Sites for which the loca-tion was undetermined were mapped in the municipality chief town.
2.1 Type and abundance of information
The three main sources of information used to compile the inventory were newspapers, the review of the technical and scientific literature, and interviews. The various sources of information provided information of different quality and in different amounts. We estimate that about 78% of the to-tal information currently stored in the AVI archive comes from newspapers, 20% from technical and scientific docu-ments, and the remaining 2% from interviews. Newspapers
emphasize large-magnitude events that occurred in urban ar-eas or that caused damage to well-known or ar-easily recogniz-able structures. They under-report events of low magnitude or those that do not cause extensive or well-defined damage. The bias limits the definition and the full extent of the haz-ard in agricultural and rural areas. Newspapers also empha-size the reactivation and repetition of mass movements and floods. The amount and reliability of information found in newspapers improved after Word War II. It increased dur-ing the 1950s when several journals introduced regional and local chronicles, and markedly increased in the 1990s when many more journals were searched. The review of newspaper articles provides quality data on the date (but rarely the time) and the general triggering mechanism (rainfall, earthquake, etc.) of occurrences. The exact location is rarely reported and only for single, large events. Commonly, large areas are described where numerous landslides or bank overflows oc-curred. Economic estimates of the type and extent of damage is provided in a few articles, but technical data, such as the type of movement and the kind and volume of material in-volved, are seldom reported. A problem with newspapers lies in the reliability and correctness of the information. Quite of-ten, different newspapers provide conflicting information on the same event. This is often the case for the same newspa-per in different articles. Following (or during) a catastrophic event, journalists rarely have the opportunity, time and re-sources to properly crosscheck the re-sources of information, although they should do it. We cope with this problem with information redundancy. For each event, we collect all the articles we can find. When more than a single information or figure is available for the same flood or landslide event, the one judged to be best documented or more reliable is chosen. Often, more than one value, or a range of values, is stored in the database, indicating uncertainty in the data.
Review of technical and scientific documents provided high-quality data for a limited number of events. These docu-ments supply information on the geological, morphological, and geotechnical characteristics of a single mass movement, and the hydrological and meteorological characteristics of a particular flooding event. Most of them contain maps and drawings describing in detail the location and the geometri-cal characteristics of landslides and the extent of inundated areas. This information was particularly useful to locate pre-cisely the mass movements and the inundated areas. Curi-ously, scientific papers rarely describe the types and extent of damage and the societal and economic consequences of floods and landslides. Such information is more abundant in the technical or events reports and in the rare books or monographs written on particular, highly catastrophic events. Damage estimates and the societal and economic impact of landslides and floods are also available in newspaper articles. To update the inventory, particularly useful were reports on specific or recent flooding and landslide events (e.g., Mor-tara et al., 1986; Gabriele, 1997; Rosso and Serva, 1998; Tropeano et al., 1993, 1995, 1999, 2000; Tropeano and Tur-coni, 2000, 2002; Regione Piemonte, 1996, 1998, 2000a, 2000b; D’Andrea and Petrucci, 2003), historical catalogues
0 50 100 200 Kilometers
Figure 2
0 50 100 200 km
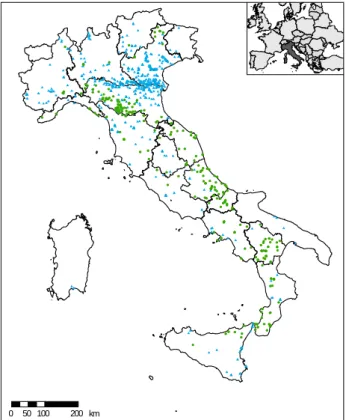
Fig. 2. AVI project archive. Geographical distribution of the sites historically affected by landslides (green dots) and inundations (blue triangles) in Italy in the period from 1900 to 2002.
of landslides and floods compiled for specific geographi-cal areas (e.g. Natoli, 1944; Eisbacker and Clague, 1984; Tropenano, 1989; Catenacci, 1994; Felciai and Preti, 1996; Bellardone, 1996; Trioisi, 1997; Migale and Milone, 1998; Monticelli, 1998), regional flood and hydrological reports (Versace et al., 1987; Cao et al., 1991; Copertino and Fiorentino, 1994; Cannarozzo et al., 1993; Rossi and Villani, 1995; Villi and Bacchi, 2001), and regional atlases of land-slides in urban areas (Bozzo et al., 1988; Annovi and Simoni, 1993; Luino et al., 1993; Felicioni et al., 1995; Agostoni et al., 1997a, 1997b, 2000; Canuti et al., 2000; Federici et al., 2001; Collalti et al., 2002).
Interview with experts in the fields of mass movements and floods provided general information on a limited num-ber of hydrological events. The interviews were conducted only in 1990–1992 and were useful in giving a comprehen-sive overview of the areas historically affected by landslides or floods and in defining the awareness of the scientific and technical communities to the problem of geo-hydrological hazards in each region.
2.2 Available products
In spite of the limitations due to the complexity of the Ital-ian landscape, the different awareness of the impact of
land-Figure 3 0 500 1,000 1,500 2,000 2,500 1900 1905 1910 1915 1920 1925 1930 1935 1940 1945 1950 1955 1960 1965 1970 1975 1980 1985 1990 1995 2000 0 5,000 10,000 15,000 20,000 2% 4% 6% 8% 10% Num
ber (and percent
ag
e) of information
Cumulative number of information
A - Landslides 0 50 100 150 200 250 300 350 400 1900 1905 1910 1915 1920 1925 1930 1935 1940 1945 1950 1955 1960 1965 1970 1975 1980 1985 1990 1995 2000 1% 2% 3% 4% 5% 0 2,000 4,000 6,000 8,000 Num
ber (and percent
ag e) of information Cum ulative num ber of information B - Floods
Fig. 3. AVI project archive. Temporal distribution of historical
in-formation on landslides (A) and floods (B) in the period form 1900 to 2002. Histograms show the number and percentage of informa-tion. Dashed lines show the cumulative number of informainforma-tion.
slides and floods, and the limited resources available for the inventory and its maintenance and upgrade, the result of the AVI inventory represents the most comprehensive source of information on mass-movements and floods ever prepared for Italy. The database currently contains 31 182 entries on 32 162 landslide events that occurred at 21 159 sites (equiv-alent to a density of about 1 landslide site per 14 km2) and 8518 entries on 29 233 inundation events at 15 904 sites (equivalent to a density of about 1 inundated site per 19 km2). In the database, information on landslides most commonly refers to individual slope failures, whereas information on floods generally lists several sites that were inundated dur-ing the same flooddur-ing events. This explains the compara-bly smaller number of entries on floods. Figure 2 shows the geographical distribution of the sites historically affected by landslides and floods, and Fig. 3 shows the temporal distribu-tion of the historical informadistribu-tion on slope failures and inun-dations in Italy, from 1900 to 2002. Stored in the database are about 90 000 newspapers articles with information on hydro-logical or geohydro-logical catastrophes; 24% of them are available as PDF files.
To disseminate the wealth of information stored in the AVI archive we prepared various products, including maps, catalogues, databases and web sites. Guzzetti et al. (1996) published the first synoptic map of the sites historically af-fected by landslides and floods in Italy. The map was pub-lished at 1:1 200 000 scale and showed the approximate lo-cation of 11 455 landslide events and 5385 flood events. The map exhibited a distinct lack of homogeneity in the
geographical distribution of sites affected by landslides or floods, indicating the need for a more precise location of the affected sites. This was accomplished in 1997 using medium- and large-sale topographical maps. In Reichenbach et al. (1998b)published a second edition of the map, which portrayed the location of more than 15 000 sites (9086 land-slides and 6456 floods) affected by catastrophic events for the period 1918–1994. The new map showed the location of 2608 landslide sites and 2317 inundation sites which were affected recursively, i.e. more than once during the 77-year investigated period. In a separate box of the map, histograms showed for each of the twenty Italian regions, the number of inundated sites against the number of times each site was in-undated. The graphs revealed that for most of the regions the number of inundated sites was large, confirming that flood-ing is widespread in Italy, but also that sites more frequently inundated are relatively few, indicating that the number of sites at “high risk” is limited. CNR GNDCI distributed the synoptic maps of Guzzetti et al. (1996) and of Reichenbach et al. (1998b) to all the Italian Senators and Chamber Repre-sentatives.
The exact or the approximate date of occurrence is known for many slope movements and inundations. Combined with the information on the location of the events, the date al-lowed us to prepare the first national catalogue of sites his-torically affected by landslides or floods in Italy. Cardinali et al. (1998b) collected this information in a book, in two vol-umes, which lists the date (day, month and year) and location (i.e. region, province and municipality) of 23 606 landslide events at 15 956 sites, and of 25 078 flooding events at 13 494 sites. For floods, the river, torrent or stream that caused the inundation is reported, where the information is available. The catalogue was also available on a CD-ROM built with GIS technology and capable of showing the distribution of damaged sites (Cardinali et al., 1998a). CNR GNDCI dis-tributed about 2000 copies of the book and of the CD-ROM to national and local civil protection authorities, to planners and decision makers, to private consultants involved in civil defence planning, and to schools, environmental associations and concerned citizens.
In the attempt to disseminate the information collected by the AVI project, we designed a specific web site (http: //avi.gndci.cnr.it). The web site contains general informa-tion on the project and its main results, and allows access to the project reports, to scientific papers and technical doc-uments, to statistics summarizing the number of informa-tion collected in the 20 regions, the 103 provinces and the 8103 municipalities in Italy. From the web site, one can download databases (in Microsoft Access® format) contain-ing part of the information stored in the main project archive. This feature is not available for the most recent releases of the archive, which are available on line from SICI, the in-formation system on historical landslides and floods in Italy. A second web site (http://sicimaps.irpi.cnr.it) exploits GIS-based web technology to display maps of the distribution of sites affected by the historical landslides and floods in Italy.
Figure 4 IRPI AVI GNDCI INTEREF AVI GIANO ABPO LAWS LOMBARDY DISCHARGE SEDIMENT DPC FATALITIES
S I C I
Historical
References
ITALYREFFig. 4. SICI, the information system on historical landslides and
floods in Italy. Modules available in the database. Legend: green cylinders, modules publicly available trough the SICI home page (http://sici.irpi.cnr.it); yellow cylinders, modules with restricted ac-cess.
3 SICI, an information system on historical landslides
and floods
The large amount of available historical data, the complexity of the AVI database, and increasing requests from the na-tional, regional and local governments, from scientists, geol-ogists, engineers and planners, from civil protection person-nel and concerned citizens, has guided the transition of the AVI database from a simple storage of historical data into an information system on landslide and flood events capa-ble of responding to the requests of different users. SICI is a collection of databases containing historical, geograph-ical, damage, hydrologgeograph-ical, and bibliographical information on landslides and floods in Italy. SICI is accessible trough the internet at the Universal Resource Location (URL) ad-dress http://sici.irpi.cnr.it.
Instead of embarking into a troublesome and error prone effort to merge the various databases into a single archive, we decided to keep all the databases separate, and to treat them as different sources of information within a single infor-mation system. SICI currently contains ten modules, seven of which are completely or partially available to the public (Fig. 4). The modules are:
a) AVI b) GIANO c) FATALITIES d) ABPO e) LOMBARDY f) DPC g) LAWS h) REFERENCES i) DISCHARGE j) SEDIMENT
The AVI module contains the database of the AVI project described before. It represents the largest and most impor-tant module of SICI, at least for the 20th century. The latest
Figure 5
0 50 100 200 km
Fig. 5. GIANO module. Geographical distribution of 356
land-slides (green dots) and 793 inundations (blue triangles) inventoried in the GIANO database in the period from 1700 to 1899.
release of the database (release 8) contains 31 182 entries (records) on landslides and 8518 entries on flooding events. The AVI module also contains a bibliographical database list-ing 2027 references used to compile the historical archive.
The GIANO module contains information on single or multiple landslides, inundations and snow avalanches oc-curred in Italy in the 18th and 19th centuries, including the original sources of information. The module was obtained from a larger archive compiled in the eighties by SGA Sto-ria Geofisica e Ambiente (http://www.sga-stoSto-riageo.it) for ENEA (the Italian energy research institute, http://www. enea.it) and aimed at collecting the effects of all natural dis-asters in Italy in the period from 1000 to 1900. The informa-tion in the GIANO module covers the period from 1700 to 1899 and refers to 793 flooding events (of which 388 in the 18th century and 405 in the 19th century) and 356 landslide events (of which 56 in the 18th century and 300 in the 19th century). “Testimonies” (i.e. single entries) on landslides are 2132, 884 in the 18th century and 1248 in the 19th century, and “testimonies” on floods are 528, 126 in the 18th century and 402 in the 19th century. SGA collected the historical information from 177 bibliographical references, including catalogues, repertoires, scientific reports and other histori-cal sources. Figure 5 shows the geographihistori-cal distribution of landslides and floods inventoried in the GIANO database.
Figure 6
0 50100 200km
Fig. 6. FATALITIES module. Geographical distribution of
land-slides (triangles) and floods (dots) with casualties in the period from 1900 to 2002. Legend: red dot, landslide site with fatalities; yellow dot, landslide site with injured people; blue triangle, flood site with fatalities; light blue triangle, flood site with injured people.
The GIANO module lacks the completeness and accuracy of the AVI database, mostly due to the difficulty in collecting information from historical sources and testimonies. Some duplication of information exists with the AVI database. As an example, historical landslides in the catalogues compiled by Almagi`a in 1907 and 1910 are listed in both databases. Despite these limitations, GIANO is a major contribution to the SICI information system. It extends the breath of the AVI database to the 18th and 19th centuries and it provides a multi-secular perspective on the extent of landslides and floods in Italy.
The FATALITIES module contains information on land-slides and floods which have resulted in deaths, missing per-sons, injured people, evacuees and homeless people in Italy, in the 724-years period between 1279 and 2002 (Guzzetti, 2000; Guzzetti et al., 2004). Non systematic information on snow avalanches with human consequences is also listed in the database. The module lists 4534 records, of which 2379 on landslides and snow avalanches with human conse-quences and 2155 on floods that resulted in damage to peo-ple. Figure 6 shows the geographical distribution of landslide and flood sites with casualties in Italy in the period from 1900 to 2002.
The ABPO module contains information on landslides and floods in the Po River basin, the largest watershed in Italy
Figure 7
Fig. 7. ABPO module. Geographical distribution of landslides
(green triangles), floods (blue dots), and snow avalanches (red dots) that have interfered with structures and the infrastructure in the Po River basin in the period from 1300 to 1995.
0 1 - 5 6 - 10 11 - 25 26 - 50 > 50
Figure 8
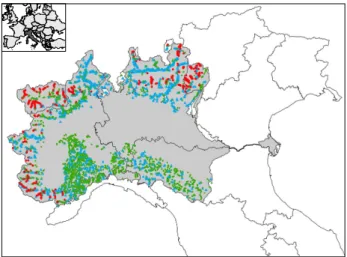
Fig. 8. LOMBARDY module. Map showing municipalities in the
Sondrio province, Lombardy region. Municipalities are coloured based on the number of information on landslide (including debris flows) and flood events in the period from 500 to 1993.
(74 970 km2). The Po River Basin Authority collected the information on historical floods, mass movements and snow avalanches from a variety of sources, including historical and archive documents that span the period from 1300 to 1995. The River Authority collected the historical informa-tion as an aid to the preparainforma-tion of the watershed master plan (http://www.abpo.it/piano/Pai/indice.htm). The ABPO mod-ule contains 4171 records, listing 5990 sites affected by 1647 floods, 1995 landslides and 536 snow avalanches (Fig. 7). In-formation on the type and extent of damage caused by inun-dations, slope failures and show avalanches is available for a few sites. Inspection of Fig. 7 reveals that only the events that have occurred in the mountains and in the hilly part of the river basin are considered. Flooding events which have
Figure 9
0 50100 200km
Fig. 9. DPC module. Geographical distribution of the
municipali-ties where technical surveys aimed at determining the landslide and flood hazard and risk were performed by CNR GNDCI scientists in the period from 1990 to 2000.
occurred in the Po plain, along the Po River and its major tributaries (cf. Fig. 2) are not listed in the database.
The LOMBARDY module contains information on 3765 landslides, debris flows and flooding events in Valtellina and Val Chiavenna, two Alpine valleys in the Sondrio province (Lombardy, northern Italy), in the period from 500 to 1993 (Fig. 8). The historical database contains 2948 records, list-ing information obtained by systematically searchlist-ing 590 bibliographical references and historical documents, which were found in local archives by Govi and Turitto (1994). LOMBARDY is presently the only module of the SICI in-formation system that contains inin-formation on landslides and floods which occurred on a relatively small (3200 km2) geo-graphical area, and that was obtained through a very detailed and systematic analysis of all the available historical sources. LOMBARDY is a valuable addition to the SICI information system because it provides a measure of the quantity and quality of information that can be expected from an accurate and systematic search of historical information in the Alps.
The DPC module contains information and documents on 1389 local surveys and technical activities performed by CNR GNDCI experts and scientists in the period between 1990 and 2000. The investigations were requested by the Mayor of a municipality or the Prefect of a province, and were conducted on behalf of the National Department of Civil Protection (DPC) to investigate landslides and floods that posed an imminent threat to the population. The DPC
1 4 3 1 4 9 4 8 15 24 48 32 61 76 88 198 199 172 90 127 90 0 50 100 150 200 250 1970 1971 1972 1973 1974 1975 1976 1977 1978 1979 1980 1981 1982 1983 1984 1985 1986 1987 1988 1989 1990 1991 1992 1993 1994 1995 1996 1997 1998 1999 2000 2001 2002 Number of legislati o ns Figure 10
Fig. 10. LAWS module. Number of legislations in Italy on
hydro-logical and geomorphohydro-logical hazards in period from 1970 to 2002.
module lists 1231 surveys in 578 municipalities (Fig. 9) and contains 639 documents, reports, maps and photographs (as PDF files), including 269 survey reports, which included a description of the event, the type and the extent of damage, and indications on remedial measures to locally mitigate the landslide and flood risk.
The LAWS module is the last entry to the SICI informa-tion system, and contains informainforma-tion and documents (as PDF files) on Italian laws, decrees, and ministry orders on hydrological and geological hazards (Fastelli, 2003a). The database covers the period from 1970 to 2002, and lists 1255 legislative acts (Fig. 10).
The REFERENCES module is a collection of bibliograph-ical and reference catalogues, including the AVI project main reference list (AVI, 2027 references), the catalogue of 2800 publications, maps, and reports published or edited by CNR GNDCI (GNDCI, Fastelli, 2003b), the list of books and re-ports in the IRPI library in Perugia (IRPI, 1500 references), the bibliographical catalogue prepared by Guida et al. (1979) for the period from 1900 to 1978 (ITALYREF, 940 refer-ences), and the catalogue of the national and international literature on landslides and related topics compiled by the IRPI Applied Geology Group (INTEREF, 3140 references). Figure 11 shows the yearly distribution of references in the period from 1900 to 2002.
The DISCHARGE and SEDIMENT modules contain data on daily water discharge and on daily sediment yield. Mea-surements of mean daily water discharge are available for 111 gauging stations in central Italy (Fig. 12), in the period from 1929 to 1996. The data were digitized in the early nineties by the Faculty of Agriculture of the Perugia Uni-versity, and were obtained from the annual reports (Annali Idrologici, parte II) published by the National Hydrographi-cal and Oceanographic Service (Servizio Idrografico e Mare-ografico Nazionale). Data on sediment yield are available for 117 stations (Fig. 12) and cover (non systematically) the 68-year period from 1929 to 1996.
Access to the AVI, GIANO, ABPO, LOMBARDY, LAWS and DISCHARGE modules is available trough the
0 50 100 150 200 250 300 350 400 450 <1900 1902 1906 1910 1914 1918 1922 1926 1930 1934 1938 1942 1946 1950 1954 1958 1962 1966 1970 1974 1978 1982 1986 1990 1994 1998 2002 9% without date 91% with date Figure 11 Num b e r of refe re nces
Fig. 11. REFERENCES module. Number of references on
land-slides and floods stored in the various bibliographical catalogues in the period from 1900 to 2002.
SICI home page (http://sici.irpi.cnr.it). Access to the FATALITIES, DPC and SEDIMENT modules is restricted. Bibliographical information stored in the REFERENCES module is partly available to the public trough the SICI home page and partly restricted to selected users.
4 Hardware and software configuration1
The hardware and software configuration of the SICI infor-mation system has changed significantly over the time, to adjust to new and more abundant data, to respond to the re-quests of new users, and to exploit the new technologies that have become available. In this section, we describe the evo-lution of the software we have used and we present the cur-rent hardware and software configuration.
4.1 The history
In 1990–1992, during the main phase of the AVI inventory, information was collected in digital format using simple soft-ware developed using DBU, a public domain tool capable of writing files in the Bordland© dBase® format (DBF III). CNR IRPI developed a specific database managing system (DBMS) with a graphical (and geographical) interface to store and manage the information. The program was writ-ten for Microsoft® Windows 3.0© in the C language, and supported DDE (digital dynamic exchange), allowing for dy-namic links with other software. In a pioneering attempt to deliver the historical information collected by the AVI project through the Internet, in 1993, in cooperation with the Com-puter Centre of the University of Perugia, we developed a system based on WAIS, a non-relational database publicly available under the Unix operative system. Specific software allowed to perform simple, text based queries to the WAIS database and formatted the output using Hypertext Markup 1Use of trade, product or firm names is for descriptive purposes only and does not imply endorsement by CNR, GNDCI, IRPI or the authors.
Figure 12
Fig. 12. Geographical distribution of gauging stations for which
data are available in the DISCHARGE and SEDIMENT yield mod-ules. Legend: blue triangle, water discharge gauging station; orange square, sediment yield gauging station; red dot, water discharge and sediment yield gauging station.
Language (HTML). HTML pages were displayed using the Internet browsers available at the time (i.e. Mosaic© and Netscape© release 1.0).
In order to exploit the inherent relational structure of the AVI database, in 1994–1995 we moved the data from the “flat” structure supported by WAIS, into a relational, com-mercial database management system (Sybase® SQL Server, running on a SUN® workstation). Specific software was written to query the DBMS and to format the output as HTML files (Potenza et al., 1998). Images, simple raster maps and hyperlinks were added to the HTML files, mak-ing the “navigation” into the AVI database more efficient. To facilitate the editing and the correction of the information stored in the database, the relational structure of the DBMS was mirrored in the Microsoft Windows environment, using Microsoft Access 95©. The migration facilitated the addi-tion of the new informaaddi-tion collected during the archive up-dates. Writing and maintaining the software used to query the DBMS was cumbersome and error prone. In addition, the software did not fully exploit the transact SQL language used by Sybase to query the DBMS. To overcome these lim-itations, in 1996 we adopted Sybernet© a software writ-ten by D. D. Workman (at the Stanford Research Institute, http://sybernet.sri.com/). Sybernet is a stand alone CGI
dae-Figure 13
Web Server
B
Apache
PHP
PostgreSQL
(PHP, Apache)A
DBMS
ArcIMS, Apache
(PostgreSQL, PHP)Map Server
C
Internet
Access & Excel
via ODBC pgAdmin III
Online
update, management
and analysis
update and analysis
Offline
Access & Excel
extra
net
intranet
SICI
Fig. 13. SICI hardware and software configuration. Use of trade,
product or firm names is for descriptive purposes only and does not imply endorsement by CNR, GNDCI, IRPI or the authors.
mon which holds connections to the Sybase SQL server on behalf of a web client, and is capable of submitting standard SQL queries to the Sybase SQL server and to format the out-put as HTML pages.
4.2 Current setting
In 1999, in the attempt to cut the costs of the hardware and software maintenance fees, we changed DBMS. We decided to use chiefly software with an “open source” li-cense agreement. We selected PostgreSQL® (http://www. postgresql.org/) as the new DBMS, we adopted PHP© (http: //www.php.net/) as the standard language to query the DBMS and to format the output, and we implemented Apache® (http://httpd.apache.org/) as the web-server software used to publish the information on the Internet.
Figure 13 portrays the current hardware and software con-figuration used in SICI. The information system is based on a cluster of three personal computers running Linux®. The first computer (A in Fig. 13) hosts the PostgreSQL® DBMS, including the data and the documents available for delivery, as PDF files. A second computer (B in Fig. 13) is the main web server, receiving the queries from the users, interrogat-ing the DBMS via PHP, and formattinterrogat-ing and deliverinterrogat-ing the re-sults as HTML pages. The third computer (C in Fig. 13) runs a GIS-based web server, which allows publishing geograph-ical information, including interactive maps, on the web. For this purpose, we currently use Esri® ArcIMS© software. Fi-gure 14 shows examples of maps published by the SICI Map Server. Figure 14A portrays the geographical distribution
Figure 14
A
B
C
Fig. 14. Examples of maps published by the SICI map server (http:
//sicimaps.irpi.cnr.it). (A) Map showing sites affected by landslides (green dots) and floods (blue triangles) in the Umbria and Marche regions, central Italy. (B) Map showing the number of landslide and flood events in the municipalities of the Umbria and Marche regions. Darker colours indicate a larger number of events. (C) Enlargement of map A. Legend: 1 landslide event (light green), 2 or more landslide events (dark green), 1 flood event (yellow triangle), 2–9 flooding events (orange triangle), 10 or more flooding events (red triangle), municipality boundaries (light brown), major roads (black line), railways (violet line), main rivers (light blue line), and main urban areas (black polygon).
of sites affected by landslides and floods in the Umbria and Marche regions of Central Italy, and Fig. 14B shows, for the same geographical area, the municipalities coloured based on the number of landslide and flood sites in each municipality. We have built a level of redundancy into the information sys-tem, to cope with possible hardware and software failures. Host A runs PHP and an independent Apache® web-server, and can serve user requests autonomously. Host C contains a replica of the PostgreSQL DBMS, including data and doc-uments, and can replace host A if necessary.
Figure 13 also shows how we manage, maintain, and up-date SICI. We maintain the DBMS from personal comput-ers running pgAdmin© III, a software that connects directly to PostgreSQL and allows to manage the databases, tables, records, fields and users. We update and manage data stored in the information system from personal computers running Microsoft Access or Microsoft Excel software, which inter-acts with PostgreSQL via ODBC. We digitize most of the new data, catalogues and documents off-line, using chiefly Microsoft Access or Microsoft Excel software. When ready, new releases of an entire database or of individual tables are uploaded into the information system.
5 Applications
The historical information on landslides and floods stored in the SICI information system is used for a variety of scien-tific, technical, and legal applications. The Italian govern-ment recognized the relevance of the AVI database. Follow-ing the massive landslides in Sarno, Campania, of 5 May 1998, Law 267 of 1998 on landslide and flood risk assess-ment procedures specifies that the AVI database is a manda-tory source of information for the assessment of landslide and flood hazards and the associated risk in Italy. Regional governments, river basin authorities and municipalities used the AVI database to ascertain landslide and flood hazards. Research scientists, geologists, engineers and planners, civil protection personnel and concerned citizens access the SICI home page every day.
Guzzetti et al. (1994) compared the geographical distri-bution of landslide sites in the Umbria and Marche regions in centrally Italy, with a medium-scale landslide inventory map produced through the interpretation of medium-scale aerial photographs. The authors found that sites histori-cally affected by slope failures were more abundant in the areas where landslide density was higher. Reichenbach et al. (1998) combined the historical record of landslides and floods in the Tiber River basin, central Italy, with measure-ments of mean daily discharge at significant gauging stations in the catchment. The comparison allowed establishing hy-drological thresholds for the occurrence of landslides and floods in the Tiber River basin. Guzzetti (2000) used the AVI archive and other sources of historical information to compile a catalogue of landslides with human consequences in Italy, from 1279 to 1999. Guzzetti et al. (2004) revised and updated the catalogue of Guzzetti (2000) and compiled
a similar catalogue for floods with human consequences in Italy. Guzzetti (2000) and Guzzetti et al. (2004) used infor-mation on landslides and floods that caused deaths, missing persons and injured people to ascertain individual and soci-etal landslide and flood risk in Italy in the 20th century.
In the following, we present four new applications based on the historical catalogue of landslide and flood events in Italy from 1900 to 2002, obtained from the main AVI database.
5.1 Geographical distribution of landslides and floods We use the catalogue of landslide and flood events obtained from the AVI database to study the geographical distribution of sites damaged by landslide and flood events in Italy, in the period from 1900 to 2002 (Fig. 2). The catalogue lists the exact or the approximate location of 21 159 sites affected by 32 162 landslide events and of 15 904 sites affected by 29 233 flooding events. Comparison of the geographical distribu-tion of the damaged sites with the administrative boundaries reveals that all the 103 Italian provinces experienced recur-sively landslides or floods. Of the total number of 8103 Ital-ian municipalities (in 1998), 4846 (59.5%, covering 75% of the territory) have experienced at least once a landslide, 4492 (55.1%, covering 71% of the territory) have experienced at list once a flood, and 6475 (79.9%, covering 91% of the territory) have experienced both landslides and floods. The 1638 municipalities (20.1%, covering 9% of the territory) for which information on historical landslides or floods is not available in the AVI database are mostly small in size, or are located in remote and inhabited mountain areas or in the hinterland of large cities (e.g. Milan). In these municipal-ities, which cover about 9.5% of the Italian territory, land-slides and floods may have occurred but they may have not been noticed. Alternatively, they may have been observed but quickly removed, or they may have not been reported be-cause they did not be-cause damage. Figure 15 shows the den-sity of damaging events in each municipality, i.e. the number of landslide (Fig. 15A) and inundation (Fig. 15B) events per 10 km2. These maps are available on line from the SICI map server (http://sicimaps.irpi.cnr.it). Similar maps can be pre-pared for the number of sites affected by landslides, floods or both.
5.2 Seasonal distribution
The historical catalogue of landslide and flood events reports the exact or approximate date (or period, in the case of events that lasted for more than one day) for the majority of the events listed in the catalogue. In particular, the catalogue lists 27 679 (96.1%) flood events and 19 839 (61.9%) land-slide events for which the month of the occurrence is known, allowing for analysis of the seasonality of slope movements and inundations in Italy. Figure 16 portrays the number and percentage of landslide (green bars) and flood (blue bars) events. The monthly number and percentage of the events are shown from July to June, to delineate seasonality.
Figure 15
0
< 0.2
0.2 – 0.5 0.5 - 1
> 1.0
A - Landslides
B - Floods
Fig. 15. Density of landslide (A) and flood (B) events in the 8103
Italian municipalities. Density is the number of events inventoried in the historical catalogue per 10 km2.
In Fig. 16, histograms A and B show data for the en-tire country. The largest number of inundations occurred in November (19.8%), followed by October (18.8%) and September (13.0%), and the largest number of landslide events occurred in January (14.4%), followed by November (13.7%) and October (12.9%). Inspection of the two graphs
0 5 10 15 20 25 J A S O N D J F M A M J Percentage of E vents J A S O N D J F M A M J Percentage of E vents 0 5 10 15 20 25 J A S O N D J F M A M J Percentage of E vents 0 5 10 15 20 25 J A S O N D J F M A M J Percentage of E vents 0 5 10 15 20 25 0 1,000 2,000 3,000 4,000 5,000 6,000 J A S O N D J F M A M J Num ber of Events 0 500 1,000 1,500 2,000 2,500 3,000 3,500 J A S O N D J F M A M J Num ber of Events 0 200 400 600 800 1,000 1,200 1,400 J A S O N D J F M A M J Num ber of Events 0 200 400 600 800 1,000 1,200 1,400 J A S O N D J F M A M J Num ber of Events A B C D E F G H Figure 16
Fig. 16. Seasonal distribution of landslide (green bars) and flood
(blue bars) events in Italy. Left graphs (A), (C), (E), (G) show the number of events; right graphs (B), (D), (F), (H) show the percent-age of events. A and B, data for the entire country; C and D, data for northern Italy; E and F, data for central Italy; G and H, data for southern Italy.
reveals a weak seasonality, with the majority of the land-slides (57.9%) and flood (67.5%) events occurring between September and January. Seasonality is clearer for inunda-tions and less evident for landslides, indicating a different behaviour of geomorphological and hydrological phenom-ena. Inundations are largely the direct effect of precipitation, whereas the occurrence of mass movements is also related to the antecedent conditions of the slopes. Also, the landslide catalogue lists a few slope failures which were not caused by a meteorological trigger (e.g., earthquakes).
By combining information on the month of occurrence of the events with their geographical location, we can investi-gate the variation of the seasonal distribution of landslides and floods in Italy. In Fig. 16, the histograms from C to H portray the monthly number and percentage of landslide and flood events in northern (C–D), central (E–F) and south-ern (G–H) Italy. Seasonality of landslide and flood events is more evident in central and southern Italy, and less evi-dent in northern Italy. In northern Italy (Figs. 16C–D), floods are more abundant in the autumn, with the largest number of events recorded in October (21.0%), followed by November
Figure 17
Num
ber of ev
ents at each site, N
0 5 10 15 20 25 30 35 1000 2000 3000 4000 5000 6000 7000 8000 9000 10000 11000 12000 13000 14000 0 5 10 15 20 25 30 35 10 20 30 40 50 60 70 80 90 Rank of site, R
A - Landslides
Rank of site, R Num ber of events at each site, N
0 20 40 60 80 100 120 140 160 180 200 1000 2000 3000 4000 5000 6000 7000 8000 9000 10000 11000 0 40 80 120 160 200 10 20 30 40 50 60 70 80 90
B - Floods
Fig. 17. Number of damaging events at each site. Linear scales. (A)
landslide sites (green); (B) flood sites (blue).
(18.4%) and September (14.9%). Floods are also abundant in the spring, and particularly in June (9.2%) and May (7.2%). In northern Italy (Figs. 16C–D), landslides are more abun-dant in autumn, with 14.9% of the events occurring in Oc-tober and 13.7% in November. In this geographical region mass movements are also abundant in June (11.3%) and Jan-uary (10.2%). In central Italy (Figs. 16E–F) floods are most abundant in November (23.2%) and December (21.2%), with only few events occurring from March to August (14.8%). In central Italy (Figs. 16E–F) slope failures are most abundant in January (17.3), followed by December (14.3), November (13.1), and October (11.5). In southern Italy (Figs. 16G–H) floods are most abundant in November (20.4%) followed by October (18.2%), with only few events occurring in the spring and the summer (18.3%). In the same geographical area (Figs. 16E–F) landslides are most frequent in January (20.0%), followed by November (14.4%). Differences in the seasonal distribution of landslides and floods in the Italian regions reflect various meteorological regimes.
Figure 18 Rank of site, R 10 100 1000 1 1 10 100 1000 10000 100000 Num ber of ev
ents at each site, N
Fig. 18. Number of damaging events at each site. Logarithmic
scales. Blue triangles, floods; green squares, landslides.
5.3 Recurrence of damaging events
Analysis of the historical catalogue reveals that many sites were affected by landslides or floods repeatedly (i.e. more than once) in the period from 1900 to 2002. In Fig. 17 we plot the number of times each site was damaged (on the y-axis) against its rank (on the x-y-axis). Inspection of the graphs reveal that total number of damaged sites is large for both landslides (14 231) and floods (11 645), confirming that inun-dations and landslides are widespread. Figure 17 also shows that sites more frequently damaged are relatively few. Of the 11 645 flood sites (86.3%) for which the geographical loca-tion is reasonably certain, 3790 (32.5%) were affected two times or more, 824 (7.1%) were affected five times or more, and only 195 (1.67%) were affected ten times or more in the 103-year period from 1900 to 2002. During the same period, of the 14 231 landslide sites (89.2%) with a reasonably well known geographical location, 1668 (11.7%) experienced two or more events, 94 (0.66%) experienced five or more events, and only twelve (0.08%) experienced ten or more events. The disparity between landslides and floods outlines a known dif-ferent behaviour of the geomoprhological and hydrological processes. Inundations tend to repeat in the same place more frequently than mass movements, chiefly because of morpho-logical constrains (Guzzetti et al., 1994; Reichenbach et al., 1998a). It should be noted that some of the peak values corre-spond to region or province chief towns, reflecting a known bias in the historical database toward inhabited or densely populated areas (Reichenbach et al., 1998a).
Figure 18 shows the same data portrayed in Fig. 17, but in log-log scale. Inspection of Fig. 18 reveals that the relation-ship between the number of times each site was damaged and its rank is nearly linear for both landslides and floods, indi-cating a power-law (i.e. fractal) distribution. This suggests a self-similar scaling behaviour of the number of events at each site. However, the tails of the raw distributions are rather
er-Figure 19
1E10-6
Number of events at each site, N
Pro
bability Mass Function, p(N)
1E10-5 0.0001 0.001 0.01 0.1 1 0.1 1 10 100 10001E10-8 1E10-7 1E10-6 1E10-5 0.0001 0.001 0.01 0.1 1 10 100 1000 Frequency α= -(2.61) α= -(3.36)
Fig. 19. Probability Mass Function (PMF) and frequency of events
(events per year) at each site. Blue dots, floods; green triangles, landslides.
ratic. To get a better sense of the shape of the tails, we have estimated the distributions. We have accomplished this by applying a variable-width binning technique. The result is shown in Fig. 19 that portrays the probability mass function (PMF) and the frequency of events at each site, in the period from 1900 to 2002. In Fig. 19 the landslide and flood distri-butions exhibit a distinct linear (power-law) trend. However, the two distributions differ significantly in their slope, which indicates that their power-law scaling exponents differ. Anal-ysis of the graph reveals that the probability of experiencing a large number of landslide events in the same site is about 10 to 100 times smaller than the probability of having the same number of inundation events, confirming that flooding is a much more concentrated (i.e. geographically stationary) phenomena than landsliding, which is more widespread and spatially distributed.
The information on the number of events at each site al-lows for computing the rate of landslide and flood events in the 8103 municipalities in Italy. We compute the rates of events by dividing the total number of landslide events in each municipality by the time span of the catalogue (i.e. 103 years). Assuming that landslide and flood rate will remain the same for the future (a strong assumption) and adopting a Poisson probability model, we can determine for differ-ent time intervals the exceedance probability of experiencing one or more damaging landslide or flood in each municipal-ity (Coe et al., 2000). Figure 20 and Table 1 show the ex-ceedance probabilities for 5, 10, 25, 50 and 100 years. For a 5-years period, only 120 municipalities (1.9%) have a 0.90 or larger probability of experiencing at least one damaging landslide or inundation, and 753 municipalities (11.7%) have a 0.50 or larger probability of experiencing at least one land-slide or inundation. These figures increase to 382 (5.9%) and 1689 (26.3%) municipalities for a 10-years, to 1319 (20.5%) and 3835 (59.6%) municipalities for a 25-years period, and to o 2621 (40.7%) and 4783 (74.4%) municipalities for a
Table 1. Probabilities of experiencing one or more landslide or flood in a municipality. Based on the rate of occurrence of landslide and
flood events in the 103-years period between 1900 and 2002. Historical information on landslide and flood events is available for 6432 of the 8103 Italian municipalities. Columns indicate, for six different time intervals, the number (N.) and the percentage (%) of municipalities that exceed a given probability.
1-year 5-years 10-years 25-years 50-years 100-years
N. % N. % N. % N. % N. % N. % 0.01 4783 74.4 6432 100.0 6432 100.0 6432 100.0 6432 100.0 6432 100.0 0.1 1169 18.2 3835 59.6 4783 74.4 6432 100.0 6432 100.0 6432 100.0 0.2 404 6.3 2621 40.7 3835 59.6 6075 94.4 6432 100.0 6432 100.0 0.3 177 2.8 1689 26.3 3115 48.4 4783 74.4 6160 95.8 6432 100.0 0.4 98 1.5 1169 18.2 2231 34.7 3835 59.6 4783 74.4 6160 95.8 0.5 56 0.9 753 11.7 1689 26.3 3835 59.6 4783 74.4 6160 95.8 0.6 30 0.5 529 8.2 1319 20.5 3115 48.4 4783 74.4 6075 94.4 0.7 13 0.2 356 5.5 921 14.3 2621 40.7 3835 59.6 4783 74.4 0.8 5 0.1 220 3.4 631 9.8 1942 30.2 3115 48.4 4783 74.4 0.9 4 0.1 120 1.9 382 5.9 1319 20.5 2621 40.7 3835 59.6 Probab ility 1.0 0 0.0 0 0.0 3 0.0 8 0.1 55 0.9 188 2.9 Figure 20
5 years 10 years 25 years
50 years 100 years [0.00-0.50] (0.50-0.80] (0.80-0.90) (0.90-0.95] (0.95 – 0.99] (0.99 – 1.00] No data
Fig. 20. Maps showing annual exceeding probabilities of damaging
landslide and flood events in the 8103 Italian municipalities. Prob-ability computed based on available historical information for the 103-years period between 1900 and 2002.
50-years period, respectively (Table 1). For a 100-years pe-riod, 3835 municipalities (59.6%) have a 0.90 or larger prob-ability of experiencing at least one damaging landslide or in-undation, and 6160 municipalities (95.8%) have a 0.50 or larger probability of experiencing at least one slope failure or inundation. Despite the known and clear limitations of adopting a Poisson probability model to predict the occur-rence of future landslides and floods based on the past rate of occurrence of damaging events (Coe et al., 2000; Crovelli,
2000; Guzzetti et al., 2003), Fig. 21 provides a quantitative (synoptic) estimate of landslide and flood hazards in Italy. 5.4 Hydro-geomorphological events
For single landslides and floods there is no clear mea-sure of their magnitude. This is a limitation because frequency-magnitude relationships, similar to the well known Gutenberg-Richter (1954) relation linking the fre-quency and magnitude of earthquakes, cannot be established. Most of the landslides and floods stored into the historical catalogue are climatically induced, i.e. they were caused by individual meteorological events. We argue that a first order measure of the magnitude of a meteorological event result-ing in landslides and floods is given by the number of sites damaged by landslides and floods.
For risk assessment purposes, it is of interest to ana-lyze the effect (i.e. the impact) produced by meteorologi-cal events. In order to achieve this, we grouped together all the floods and landslides triggered by the same event, and we treated each grouping as single, distinct event, which we call “hydro-geomorphological” event. To obtain a cat-alogue of the hydro-geomorphological events we first com-bined the historical databases of landslides and floods. After the two databases were merged into a single catalogue, infor-mation on landslides or floods was sorted by date and by ge-ographical location (i.e. region, province and municipality). Individual floods and landslides were grouped into hydro-geomorphological events based on the date (or the period) of occurrence and the geographical location. We obtained in this way a list of 4541 hydro-geomorphological events that have resulted in landslides or floods in the period between 1900 and 2002.
The catalogue of hydro-geomorphological events can be investigated analysing the rank order statistics. In Fig. 21A we plot the magnitude of the hydro-geomorphological events, measured by the number of affected sites, against its rank, from largest to smallest. The relationship is nearly linear on the log-log plot, which indicates that it is approx-imately power-law distributed. Hydro-geomorphological events in the catalogue lasted from one to several (up to 25) days. Figure 21B portrays the number of hydro- geomor-phological events against their length, in days. Again, the relationship is nearly linear on the log-log plot, suggesting a self-similar behavior. More systematic efforts to properly classify the events and their consequences are underway.
6 Concluding remarks
In many scientific disciplines, there are large scale efforts to build comprehensives information management systems. Some of these information systems store geographical and thematic data on natural hazards, including historical infor-mation. Under the assumption that damaging natural events will occur in the future in the same or in similar circum-stances that lead to past events (a consequence of uniformi-tarianism, an accepted principle in geology and in natural hazard assessment), historical information on past events is a valuable aid to landslide and flood hazards assessment and in the design of mitigation strategies at various scales.
Historical data and information can be used: (a) to inves-tigate the physical properties of natural events, such as land-slides and floods, including the rate of occurrence and the possible changes in the rate, (b) to understand the effects of the natural hazards on the population, the structures and the infrastructure, including the assessment of individual and so-cietal risk, and, (c) to validate heuristic, statistical or physi-cal models of landslide and flood hazards and risk. Indeed, the only way a hydrological or geomorphological prediction (i.e. a flood forecast or a landslide hazard assessment) can be fully validated (i.e. proved correct or faulty) is through time. Practical, societal, economical and ethical considera-tions largely limit the time available for model testing and calibration. Historical information, even with large uncer-tainties, allows for a “backward” validation, or falsification, of predictive (i.e. “forecasting”) models.
In this paper we have presented the results of an attempt to collect, organize, analyze and disseminate historical infor-mation on landslides and floods in Italy. In the past fourteen years we have collected a wealth of information on individ-ual landslides and floods and on meteorological and seismic events that resulted in abundant slope failures and inunda-tions. This information represents the core of SICI, the Ital-ian information system on hydrological and geomorpholog-ical catastrophes. The information system also contains in-formation and data on damage caused by mass movements and inundations, on daily discharge measurements and solid-transport measurements at selected gauging stations, biblio-graphical and reference information on landslides and
inun-Figure 21 1 10 100 1000 104 1 10 100 1 10 100 1 10 100 1000 104
Length of the event, in days
Number
of Hydro-geomor
phological
Events
1 10 100 1000 1 10 100 1000 104 1 10 100 1000 104 1 10 100 1000Number
of Damaged
Sites in the Event
Large Intensity Events Small Intensity Events
Rank order
A
B
Fig. 21. Catalogue of hydro-geomorphological events (see text for
explanation). (A) magnitude of the hydro-geomorphological events measured by the number of damaged sites (y-axis), against the site rank (x-axis). (B) Number of hydro-geomorphologic events against their length, in days.
dations, and a catalogue of national legislation on hydrolog-ical and geologhydrolog-ical hazards and risk in Italy.
After a description of the ten databases and digital cata-logues currently present in the SICI information system, we have presented four recent applications of the data stored in the historical databases. The applications included: (a) the
assessment of the geographical distribution of landslide and flood events in the 8103 Italian municipalities, including the production of maps portraying the density of events and of damaged sites in each municipality, (b) the assessment of the seasonal abundance of landslides and floods in different parts of of Italy, (c) the investigation of the recurrence of damaging events at each site and in each municipality, including an es-timate of the probability of experiencing damaging events in the future, and d) an attempt to characterize the frequency-magnitude statistics of the triggering meteorological events that result in landslides and floods in Italy.
These are only a few of many possible applications of the historical information and thematic data stored in the SICI information system. Exploitation of this information has be-gun, and we believe it will represent a valuable help to un-derstand natural hazards and to mitigate the undesired effects In Italy.
Appendix A
Major flood and landslide disasters in Italy in the period from 1950 to 2000
– 18 November 1951. Following prolonged and intense
rainfall in the Alps and the Northern Apennines, the Po River broke the left banks at Occhiobello, Malcan-tone and Paviole (Polesine, Rovigo Province, northern Italy) causing the largest inundation of the 20th cen-tury (http://www.polesine.com; http://www.alfiumepo. it; http://www.deltapo.it). Water inundated the city of Rovigo, several towns (including Adria, Loreto and Cavarzene), and about 980 km2 of mostly farmland in 38 municipalities. The toll amounted to 138 casualties (including 123 deaths, 7 missing persons and 8 injured people), at least 140 000 evacuees and homeless peo-ple, 52 bridges destroyed, 1200 houses and 9000 farm-ing structures damaged or destroyed, and as many as 13 000 farm animals lost, together with 100 000 tons of wheat, and 21 000 hectares of farmland (Catenacci, 1992). The inundation occurred in an area already eco-nomically very poor, forcing the population to immi-grate to other Italian regions.
– 25–26 October 1954. Muddy debris flows triggered
by high intensity rainfall inundated the city of Salerno (Campania, southern Italy) and five neighbouring towns (i.e. Cava dei Tirreni, Maiori, Minori, Tramonti and Vi-etri) causing extensive damage. The toll amounted to 318 deaths and missing persons, 157 injured people, and as many as 5466 evacuees and homeless people. Roads and the railway connecting Naples to the south of Italy were disrupted at several locations (Catenacci, 1992; Vallario, 2001).
– 9 October 1963. At 10:39 pm, between 240 and
300 millions m3 of rock detached from Mount Toc, in Veneto (northern-eastern Italy), and slid into the Vajont Lake. The rockslide pushed the water against Casso and
Erto, two small hamlets on the slope in front of the slope of Mount Toc that failed in the disaster, and then over an artificial dam. A water wave several meters high over-topped the dam and reached the town of Longarone at 10:46 pm, destroying it. The Vajont landslide killed at least 1921 people, of which seven at San Martino, at least 151 at Fras`egn, le Spesse, Cristo, Pineda, Ceva, Prada, Marzana, 54 at a construction camp near the dam, 109 in the town of Castellavazzo and at least 1759 between the town of Longarone and the area down-stream along the Piave valley (http://www.vajont.net; Catenacci, 1992). News about the Vajont disaster reached the United States; the Herald Tribune titled: “Vajont Dam: Warning Ignored”.
– 3–4 November 1966. The city of Florence (Tuscany,
central Italy) was inundated by a severe flood of the Arno River. The flood caused severe damage through-out Tuscany, and in particular in the Arno basin, and produced a tremendous impact on the cultural heritage, mostly in Florence. Many masterpieces of the Italian Renaissance, including the church of Santa Croce and its square, the Christ by Cimabue, paintings by Vasari, Paolo Uccello and Botticelli, together with 3000 art-pieces and 1 500 000 historical documents in the Mu-seum of Santa Croce and at the National Library were damaged or destroyed (Becchi, 1999). In Tuscany 48 people were killed and 7 persons were missing in 5 provinces. Evacuated and homeless people were more than 46 600. The 1966 inundation of the Arno River was the last in a series of more than fifty flooding events occurred in Florence since 1177, of which the most se-vere occurred in 1177, 1269, 1288, 1333, 1380, 1589, 1740, 1844 and 1864 (Natoli, 1944; Becchi, 1999). The same meteorological event that caused the inun-dation in Florence dropped high intensity rainfall in the Western Alps, causing extensive inundations and numerous landslides in Trentino-Alto Adige, Veneto, Friuli-Venezia Giulia and to a more limited extent in Emilia-Romagna. Fatalities caused by landslides and floods in north-eastern Italy were 88 in eight provinces, namely: Bolzano (5), Trento (25), Belluno (29), Treviso (2), Venezia (3), Vicenza (5), Udine (15) and Pordenone (4). The evacuated people exceeded 42,000, of which 25 800 in Veneto, 15 800 in Friuli-Venezia Giulia, 800 in Emilia-Romagna and 410 in Trentino-Alto Adige. In the Po and Veneto plains, at least 137 km2of land were inundated. Damage was reported in at least 209 mu-nicipalities. In the Belluno province more than 4300 buildings, 528 bridges, and 1346 roads were destroyed or damaged (Catenacci, 1992). On 4 November the wa-ter level in the Venice lagoon reached 194 cm above da-tum, and the city was inundated by up to 100 cm of wa-ter for more than 15 h. It is the most severe flooding on record for the 20th century (Comerlati et al., 2003).
– 7–8 October 1970. The city of Genoa (Liguria,