HAL Id: hal-01643458
https://hal.sorbonne-universite.fr/hal-01643458
Submitted on 21 Nov 2017
HAL is a multi-disciplinary open access
archive for the deposit and dissemination of sci-entific research documents, whether they are pub-lished or not. The documents may come from teaching and research institutions in France or abroad, or from public or private research centers.
L’archive ouverte pluridisciplinaire HAL, est destinée au dépôt et à la diffusion de documents scientifiques de niveau recherche, publiés ou non, émanant des établissements d’enseignement et de recherche français ou étrangers, des laboratoires publics ou privés.
Katabatic jumps in the Martian northern polar regions
Aymeric Spiga, Isaac Smith
To cite this version:
Aymeric Spiga, Isaac Smith. Katabatic jumps in the Martian northern polar regions. Icarus, Elsevier, In press, �10.1016/j.icarus.2017.10.021�. �hal-01643458�
Katabatic jumps in the Martian northern polar regions
Aymeric Spiga
∗1and Isaac Smith
21Laboratoire de M´et´eorologie Dynamique / Institut Pierre-Simon Laplace (LMD/IPSL), Sorbonne Universit´es,
UPMC Univ Paris 06, PSL Research University, ´Ecole Normale Sup´erieure, Universit´e Paris-Saclay, ´Ecole
Polytechnique, Centre National de la Recherche Scientifique, France
2Planetary Science Institute, Denver, Colorado, USA
October 2, 2017
Abstract
1
Martian polar regions host active regional wind circulations, such as the downslope katabatic winds 2
which develop owing to near-surface radiative cooling and sloped topography. Many observations 3
(stratigraphy from radar profiling, frost streaks, spectral analysis of ices) concur to show that aeolian 4
processes play a key role in glacial processes in Martian polar regions. A spectacular manifestation 5
of this resides in elongated clouds that forms within the polar spiral troughs, a series of geological 6
depressions in Mars’ polar caps. Here we report mesoscale atmospheric modeling in Martian 7
polar regions making use of five nested domains operating a model downscaling from horizontal 8
resolutions of twenty kilometers to 200 meters in a typical polar trough. We show that strong 9
katabatic jumps form at the bottom of polar troughs with an horizontal morphology and location 10
similar to trough clouds, large vertical velocity (up to +3 m/s) and temperature perturbations 11
(up to 20 K) propitious to cloud formation. This strongly suggests that trough clouds on Mars 12
are caused by katabatic jumps forming within polar troughs. This phenomena is analogous to 13
the terrestrial Loewe phenomena over Antarctica’s slopes and coastlines, resulting in a distinctive 14
“wall of snow” during katabatic events. Our mesoscale modeling results thereby suggest that trough 15
clouds might be present manifestations of the ice migration processes that yielded the internal cap 16
structure discovered by radar observations, as part of a “cyclic step” process. This has important 17
implications for the stability and possible migration over geological timescales of water ice surface 18
reservoirs – and, overall, for the evolution of Mars’ polar caps over geological timescales. 19
1
Introduction
20
Studying the meteorology of the Martian polar regions is a means to address key questions related 21
to the Martian climate from the global to the local scales. Planetary-scale “flushing” storms 22
originate from the Martian polar regions and transport dust particles in lower latitudes, thereby 23
impacting the global climate of Mars (Cantor et al., 2002; Toigo et al., 2002). Modeling studies to 24
prepare the landing of the Phoenix polar lander (Kauhanen et al., 2008; Tyler et al., 2008; Michaels 25
and Rafkin, 2008) detailed how the atmospheric variability in the Martian northern polar regions is 26
controlled by a combination of the mean meridional circulation (Wilson, 1997; Forget et al., 1999) 27
responsible for the characteristic polar warming in Mars’ lower mesosphere (McCleese et al., 2008), 28
the circumpolar jet (Toigo et al., 2012; Mitchell et al., 2015; Guzewich et al., 2016), baroclinic waves 29
(Barnes et al., 1993; Collins et al., 1996), and regional circulations (Toigo et al., 2002; Tyler and 30
Barnes, 2005). The variability of regional (so-called mesoscale) circulations in the polar regions is 31
also a matter of active research to disentangle the combined influence of slope acceleration (Spiga 32
et al., 2011; Smith et al., 2013), “sea-breeze” circulations caused by the direct cap-edge thermal 33
contrasts (Toigo et al., 2002; Smith et al., 2015), and polar transient eddies (Tyler and Barnes, 34
2005). Understanding the interplay of global and mesoscale circulations in the Martian polar 35
regions is of primary importance to characterize the seasonal source / sink those regions represent 36
for Mars’ water cycle (Tyler and Barnes, 2014; Navarro et al., 2014). 37
Katabatic winds are a salient component of the atmospheric variability in Martian polar regions, 38
just as they are on the Earth (Parish and Waight, 1987; Gall´ee and Schayes, 1992; Bromwich 39
et al., 2001; Nylen et al., 2004). Katabatic winds are drainage atmospheric flows that form when 40
cooled dense air is accelerated down sloping terrains by gravity, overcoming the opposing along-41
slope pressure gradient (Mahrt, 1982). The combination of sloping terrains, near-surface radiative 42
cooling, and surface ice cover (either CO2 ice in winter or H2O deposits apparent in spring),
43
makes the Martian polar regions particularly prone to the development of katabatic winds over an 44
extended period of time (Spiga, 2011; Smith et al., 2015). This is evidenced by numerous surface 45
morphologic features in the northern polar regions, from frost streaks to dune fields, thought to 46
be caused by the polar katabatic flow deflected by the Coriolis force (Mass´e et al., 2012). The 47
variability of spectral signatures (H2O or CO2) over the polar slopes during the seasonal retreat
48
have been plausibly ascribed to katabatic winds too (App´er´e et al., 2011), as well as small-scale 49
sedimentation undulations over the northern polar plateau (Herny et al., 2014). The formation of 50
geological structures through time has also been possibly linked to the action of katabatic winds 51
(e.g., Abalos Mensae, Brothers et al., 2013). The impact of katabatic winds on polar geological 52
features is not only aeolian, but also thermal: especially above steep slopes, they induce a significant 53
downward sensible heat flux which acts either to warm the surface or to increase sublimation rates 54
(Spiga et al., 2011). 55
Radar stratigraphic observations of the Martian polar caps strongly suggest polar wind circu-56
lations, especially katabatic winds, have been instrumental in shaping the northern polar cap, and 57
the related northern polar layered deposits, over geological timescales (Holt et al., 2010; Smith and 58
Holt, 2010; Smith and Holt, 2015). Radar measurements renewed the interest for the idea that 59
katabatic winds, deflected by the Coriolis force, may explain the spiral organization of the polar 60
troughs, the deep depressions (400 − 1000 m) incised in the northern polar cap of Mars (Howard 61
et al., 1982; Howard, 2000; Pathare and Paige, 2005). This idea has been pushed forward by Smith 62
et al. (2013) who combined radar measurements, visible imaging, and numerical modeling, to show 63
that 1. the layering below troughs evidenced by radar stratigraphy supports a migration of trough 64
in the upslope direction as part of a “cyclic step” process (Kostic et al., 2010); 2. the fluid current 65
associated with this “cyclic step” mechanism is the katabatic wind flow where the occurrence of 66
“hydraulic jumps” enables ice migration to occur from the upstream to the downstream part of 67
the trough; 3. ice migration process could be observed directly in the form of elongated “trough 68
clouds” (Figure 1) occurring at the bottom of the northern polar troughs in early summer. This 69
scenario has been extended to the southern polar cap of Mars (Smith et al., 2015), with the addi-70
tional result that “sea-breeze” circulations caused by the receding seasonal CO2 cap modulate the
71
intensity of katabatic winds and account for the poleward progression of clouds in southern polar 72
regions. 73
The arguments developed by Smith et al. (2013) on hydraulic jumps within Martian polar 74
katabatic flows (what is named hereafter “katabatic jumps”, see diagram in Figure 2) only relied on 75
simple analogy with the terrestrial elongated “wall-of-snow” that results from katabatic jumps over 76
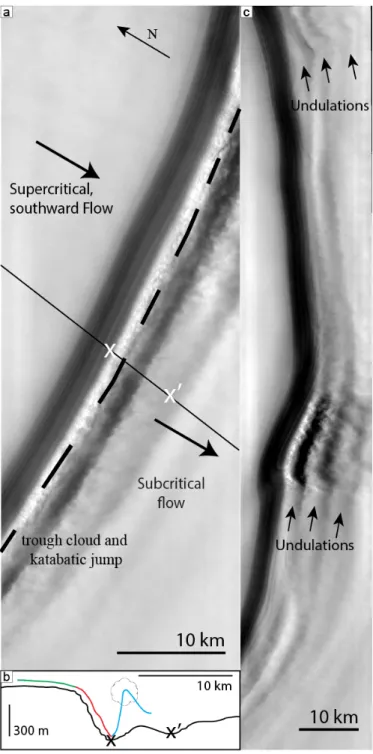
Figure 1: Annotated Mars Odyssey THEMIS images of trough clouds (see Smith et al. (2013) for details on those images). Left image (reference V28743004) shows a distinctive elongated cloud with additional undulations downstream. This image has been obtained in the same trough as the one simulated in domain #5 (see Figure 7). Right image (reference V28744006) shows a similar phenomena, albeit with smaller extent, in a neighboring trough.
e.g. Antarctica slopes and coastlines (Lied, 1964; Pettr´e and Andr´e, 1991). What is alternatively 77
named the Loewe phenomenon has been reproduced in simulations of the katabatic flow in the 78
vicinity of coastal slopes in the terrestrial polar caps (Gall´ee and Schayes, 1992; Pettr´e et al., 1993; 79
Gall´ee et al., 1996; Yu and Cai, 2006). It remains to be demonstrated that katabatic jumps do 80
occur in the environmental conditions of the Martian polar regions – and what the characteristics 81
of these katabatic jumps are. It also remains to be elucidated how katabatic jumps cause the 82
elongated clouds observed in Martian polar troughs. 83
Figure 2: Cartoon depiction of katabatic jump in Antarctica – reproduced with permission from Pettr´e and Andr´e (1991). Arrows indicate atmospheric flow directions. Right to left, the incoming flow, resulting e.g. from katabatic acceleration along a slope, is supercritical (“shooting” flow, according to the terminology in Ball, 1956). Flow depth increases at the katabatic jump. Ice forms at snowline (wall of snow), and clouds form at site of katabatic jump. Downstream of the katabatic jump, flow is subcritical (“tranquil” flow), with a return flow close to the surface in opposite direction than the incoming flow.
In this paper, we propose to address those open questions with mesoscale numerical modeling 84
of the Martian atmosphere. Mesoscale modeling aims at resolving the vast and diverse population 85
of phenomena of smaller extent than a few hundreds of kilometers – in other words, the plethora of 86
atmospheric phenomena left unresolved by Global Climate Models [GCM] (Wilson, 1997; Forget 87
et al., 1999; Navarro et al., 2014). The technique of mesoscale modeling has been employed to 88
obtain many of the aforementioned results on the Martian polar meteorology, especially on the 89
regional scale (Toigo et al., 2002; Tyler and Barnes, 2005; Kauhanen et al., 2008; Tyler et al., 90
2008; Michaels and Rafkin, 2008; Spiga et al., 2011; Smith et al., 2013; Tyler and Barnes, 2014; 91
Smith et al., 2015). Mesoscale models are well-suited to get insights into atmospheric and sur-92
face processes in polar regions. Contrary to GCMs, mesoscale models integrate the atmospheric 93
dynamics at high resolution in a specific region of interest on the planet with an adapted map 94
projection. Polar mesoscale domains are defined through stereographic projections, hence devoid 95
of the “pole singularity” present in many GCMs. In addition, high-resolution surface topograph-96
ical and thermophysical properties (albedo, thermal inertia, CO2 ground ice cover) are used in
97
mesoscale modeling. 98
Section 2 contains a technical description of the novel mesoscale simulations we carried out 99
to address the formation of katabatic jumps in Martian polar troughs. Section 3 comprises a de-100
scription of the results we obtained with those simulations and a discussion of the properties of 101
the simulated katabatic jumps – including an exploration of the analogy with terrestrial phenom-102
ena, and the possibility for cloud formation within those katabatic jumps. Section 4 contains a 103
summary of both our conclusions and the perspectives our work opens for future studies. 104
The companion paper Smith and Spiga (2017) addresses the variability of regional winds over 105
the northern polar cap; this paper addresses the behavior of the atmospheric flow at the local trough 106
level. The two companion papers complement one another and can be consulted independently. 107
2
Model
108
This study is based on simulations performed with the “Laboratoire de M´et´eorologie Dynamique” 109
(LMD) Martian Mesoscale Model (MMM) (Spiga and Forget, 2009; Spiga et al., 2011). Details 110
about the LMD-MMM and typical test simulations can be found in Spiga and Forget (2009). 111
The hydrodynamical solver (dynamical core) of the LMD-MMM is borrowed from the three-112
dimensional, fully compressible, non-hydrostatic Weather Research and Forecasting (WRF) model, 113
capable to resolve fine-scale circulations on the Earth (Skamarock and Klemp, 2008). The physical 114
parameterizations for the phenomena left unresolved by the dynamical core (radiative transfer, 115
small-scale mixing) in the LMD-MMM are similar to those developed for the LMD Martian GCM 116
(MGCM) (Forget et al., 1999). Turbulent vertical diffusion (small-scale mixing) is parameterized 117
by a “2.5-order” Mellor and Yamada approach (Mellor and Yamada, 1982), including improvements 118
from Galperin et al. (1988), suitable for the Martian atmosphere prone to strong variability in at-119
mospheric stability in the near-surface; horizontal diffusion is handled by the built-in ARW-WRF 120
scheme based on horizontal deformation (Smagorinsky, 1963). The transport of water tracers and 121
the formation of clouds are not activated in our nested mesoscale simulations, for it significantly 122
raises the computational cost of those (already expensive) simulations. Moreover, reproducing the 123
water vapor and ice fields in the northern polar regions is a notoriously difficult task (Tyler and 124
Barnes, 2014), which is far beyond the scope of the present paper. 125
The LMD-MMM and LMD-MGCM simulations performed in this paper do not include the 126
recent improvements of the physical parameterizations developed at LMD, namely the interactive 127
dust scheme (Spiga et al., 2013), the radiative transfer of water-ice clouds (Madeleine et al., 2012), 128
and the thermal plume model for boundary-layer turbulence (Cola¨ıtis et al., 2013). We rely instead 129
on a less up-to-date version of the LMD-MMM (Spiga and Forget, 2009; Spiga et al., 2011), akin to 130
the one used in Smith et al. (2013) and similar to the published polar mesoscale models (Kauhanen 131
et al., 2008; Michaels and Rafkin, 2008; Tyler and Barnes, 2014), which proved to satisfyingly 132
reproduce the near-surface wind directions observed by frost-streak mapping (Mass´e et al., 2012). 133
The reproduction of this wind regime above the northern polar cap is an essential basis of the 134
present work, which focuses on local-scale phenomena arising within the regional katabatic flow 135
over the cap. The interactions in polar regions between water-ice clouds and regional circulations 136
through the radiative impact by water-ice particles remain to be investigated in future work. 137
The mesoscale domains employed for polar simulations are centered on the northern pole of 138
Mars and make use of polar stereographic map projection. To downscale our mesoscale simulation 139
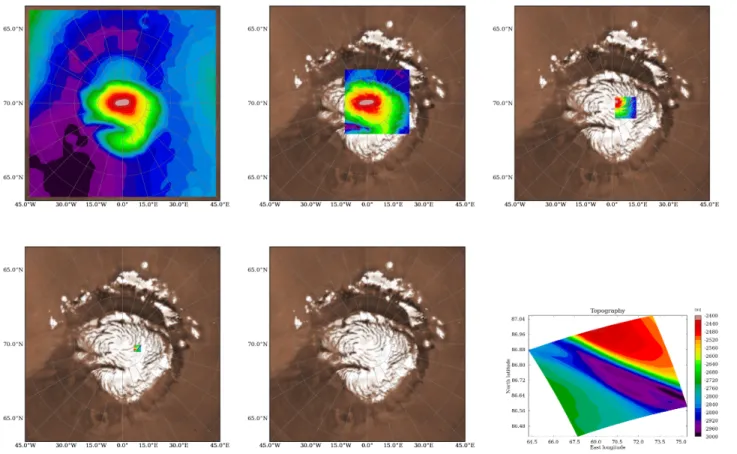
Figure 3: The five nested LMD-MMM domains set for northern polar trough simulations (#1-5 from left to right and top to bottom). These horizontal domains comprise 121 × 121 horizontal grid points with grid spacing being 20 km (domain #1 “mother domain”), 6.7 km (domain #2), 2.2 km (domain #3), 740 m (domain #4), 250 m (domain #5). Color shading shows topography and the extent of the LMD-MMM domains. An albedo map of the Martian northern polar region is included in the background to provide context. The bottom-right panel shows the detailed topography of the fifth nest located within a single northern polar trough with an fine horizontal resolution of 250 m.
from the complete extent of the Martian northern polar cap (about 15◦ latitude wide) towards 140
a single polar trough (about 10 − 25 km wide, with a characteristic spacing over the polar cap 141
of 20−70 km, cf. Howard (2000); Pathare and Paige (2005); Smith et al. (2013)), we use 5 “nested” 142
domains comprising 121 × 121 horizontal grid points, with grid spacing being respectively 20 km, 143
6.7 km, 2.2 km, 740 m, 250 m (the factor 3 in grid nesting is the one recommended for most 144
terrestrial applications with the WRF model). The location and extent of the mesoscale nested 145
domains are shown in stereographic projection in Figure 3. The nested domains #1, #2, #3 are 146
identical to the mesoscale simulations presented in Smith et al. (2013) (cf. Figure 14) and Smith 147
and Spiga (2017); the present study adds the two unprecedented fine-resolution nested domains 148
#4 and #5 to resolve atmospheric winds within a polar trough. Note that the mother domain 149
#1 is not wide enough to capture the variability imposed by polar transients evidenced in Tyler 150
and Barnes (2005); here we emphasize the major properties of katabatic jump events on Mars, 151
and their variability over two to three days, but our simulations are not tailored to investigate any 152
longer-duration transient effects, which is left as future work. 153
The meteorological fields in nested domain #n are impacted by those predicted in the wider 154
domain #n − 1. This configuration is named “one-way nesting”; the possibility of “two-way 155
nesting” (predictions in domain #n also influencing back predictions in wider domain #n − 1) 156
does exist in the WRF model, but is not activated here since we do not aim to study the impact of 157
small-scale circulations on the large-scale flow. Initial and boundary conditions for the domain #1 158
in the LMD-MMM are provided by LMD-MGCM simulations (Forget et al., 1999) which use similar 159
physical parameterizations, thereby reducing inconsistencies in physics. The WRF dynamical core 160
can be employed either with or without the hydrostatic assumption: in the first three nested 161
domains #1, #2, #3 hydrostatic equilibrium is assumed, while non-hydrostatic integrations are 162
performed in the two higher-resolution nested domains #4 and #5 where strong local vertical 163
acceleration (namely, katabatic jumps) are expected to be resolved. LMD-MMM integrations are 164
carried out with timesteps of 60 s, 30 s, 10 s, 3 s, 1 s in the respective nested domains; radiative 165
transfer computations are performed every 300 s (about 1/12th of a Martian hour) in all 5 nested 166
domains. 167
The topography resolved in the latest (fifth) nest is also shown in Figure 3 to illustrate how our 168
mesoscale simulations is unprecedented in that it resolves the atmospheric flow at high horizontal 169
resolution within a given polar trough. The resolution used in this latest nest is akin to the kind 170
of resolution used in turbulence-resolving Large Eddy Simulations employed to study the daytime 171
convective boundary layer (Rafkin et al., 2001; Michaels and Rafkin, 2004; Tyler et al., 2008; Spiga 172
et al., 2010). Both the resolutions of the fourth (740 m) and fifth (250 m) nests are within the 173
“grey zone” (or “Terra Incognitae”, Wyngaard, 2004) for resolved / parameterized convection: this 174
is not, however, an issue here since our modeling domains are located at polar latitudes where the 175
Martian atmosphere is characterized by high stability and the daytime boundary-layer convection 176
is weak, if not absent. 177
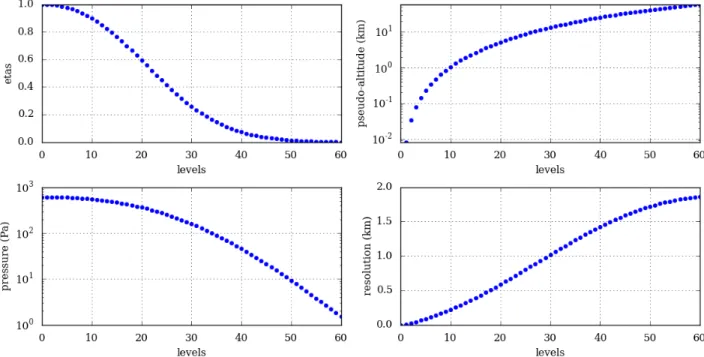
Along the vertical dimension (Figure 4), 61 levels are set from the surface to a pressure level 178
of about 1 Pa (about 60 km), with a refined spacing close to the surface (first level at an altitude 179
of 8 m above the surface and 10 levels for the first kilometer above the surface), suitable to study the 180
strong near-surface gradients of temperature and winds putatively occurring in katabatic jumps. 181
We carried out simulations with a distinct, alternate, refinement of the vertical grid close to the 182
surface which yield very similar (i.e., almost identical) results to the ones obtained with the vertical 183
grid shown in Figure 4. 184
Our 5-nest mesoscale simulations are carried out close to northern summer solstice (Ls = 85◦)
185
which is a season propitious to the occurrence of trough clouds according to Smith et al. (2013) 186
(in the companion paper, Smith and Spiga (2017) discuss the possible reasons for this strong 187
seasonal trend). The outputs from LMD-MGCM simulations at this season are directly used 188
as initial and boundary conditions for domain #1: no modification are introduced to enhance 189
the likelihood of katabatic jump occurrences in our LMD-MMM simulations. The LMD-MMM 190
simulations are carried out for 3 Martian days, with the first day serving as a spin-up for the 191
mesoscale circulations (Rafkin et al., 2001; Spiga and Forget, 2009). The dust scenario used in the 192
LMD-MMM simulations is derived from Thermal Emission Spectrometer observations for Martian 193
Year 24 (typical of any Martian Year devoid of global dust storms) and interpolated using a kriging 194
technique (Montabone et al., 2015). Topography in the 5 mesoscale domains is interpolated from 195
the 64-pixel-per-degree laser altimetry (MOLA) dataset (Smith et al., 2001) available on the NASA 196
Planetary Data System. We use the surface thermophysical properties (albedo and thermal inertia) 197
tailored for the northern polar regions published and carefully validated in Tyler and Barnes (2014). 198
Figure 4: Vertical discretization in the LMD-MMM domains. Pressure at the top of the mesoscale domains is 1 Pa. x axis denotes model vertical levels. y axis corresponds respectively to (top-left panel) WRF terrain-following mass-based coordinates (η = (p − pt)/(ps− pt), where p denotes here
the hydrostatic component of pressure, and the t and s subscript denotes respectively the top and surface boundaries), (top-right panel) altitude in km, left panel) pressure in Pa, (bottom-right panel) vertical resolution in km. Indicative values shown here are computed with standard surface pressure 610 Pa and scale height 10 km ; the actual model top in simulations is at ∼ 57 km altitude.
Similarly to what is described in Smith et al. (2015), and in the companion paper Smith and Spiga 199
(2017), we use in our LMD-MMM simulations a prescribed CO2 seasonal deposit that evolves 200
by Ls date according to infrared measurements of the surface temperature during three typical
201
Mars years (Titus, 2005), using analytical functions to obtain the “crocus line” i.e. the external 202
boundary of seasonal CO2 ice deposits (Kieffer et al., 2000). This accounts for the influence of 203
the ice-soil thermal contrasts in driving near-surface winds in an analogous phenomenon as “sea-204
breeze” on the Earth (Siili et al., 1999; Toigo et al., 2002). Outside the seasonal CO2 deposits, 205
surface temperature is calculated in our model by a surface energy balance model (as in Spiga and 206
Forget, 2009). 207
3
Results
208
Results obtained in the domains 1 to 3 with the LMD-MMM are in line with results previously 209
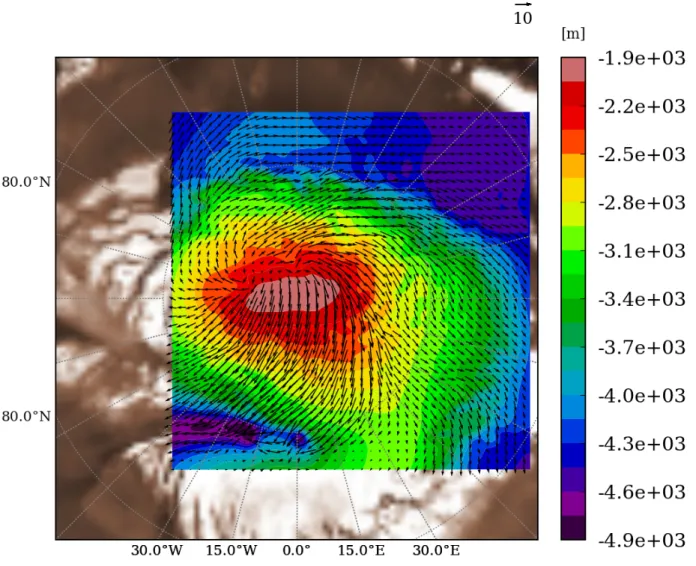
published in Mass´e et al. (2012) and Smith et al. (2013). A typical near-surface wind field obtained 210
in domain #2 is shown in Figure 5. These wind circulations over the northern polar cap are mostly 211
controlled by katabatic acceleration and Coriolis force, with wind directions in agreement with those 212
obtained by frost streak mapping (Howard, 2000; Mass´e et al., 2012) and other mesoscale models 213
(Tyler and Barnes, 2005; Kauhanen et al., 2008). Model results in domain #3 show that polar 214
troughs cause a local reinforcement of katabatic winds above the steepening slope on the upstream 215
part of the trough, before katabatic winds are severely weakened downstream, within the bottom 216
of the trough (similar to Figure 14 in Smith et al., 2013). Katabatic winds undergo a diurnal 217
cycle and day-to-day variability under the influence of varying regional atmospheric conditions. 218
The full variability imposed by polar transient eddies described in Tyler and Barnes (2005) is not 219
represented in our mesoscale simulations since we ran our mesoscale model for much less than 220
the 25 simulated days required for those transients to develop and propagate through the model. 221
While this does not jeopardize the main results discussed here, the longer-duration (i.e., weekly) 222
variability of the resolved atmospheric phenomena is not captured by our simulations, which will 223
require a dedicated study in the future to explain why trough clouds did not persist throughout 224
northern summer (Smith et al., 2013; Smith and Spiga, 2017). 225
Analyzing the results from the LMD-MMM in domain #5 (horizontal resolution 250 m) demon-226
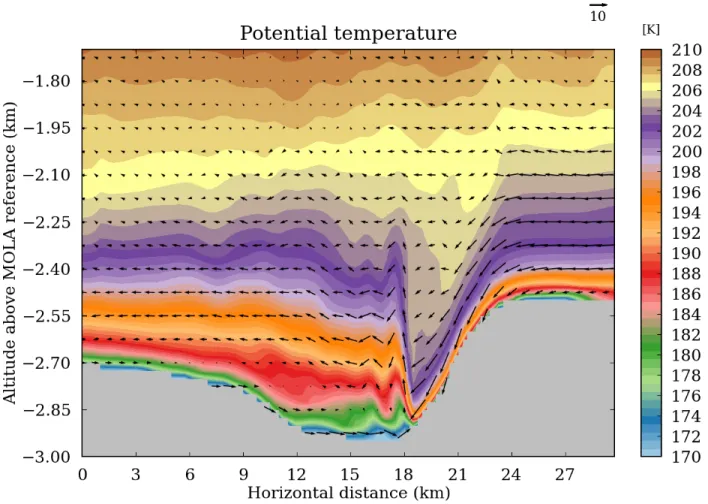
strates that katabatic jumps take place within troughs in the Martian northern polar regions. This 227
is evidenced by Figure 6 where potential temperature is displayed, with wind vectors superimposed, 228
for the second day of simulation at local time 1730 (i.e. 31 hours after the mesoscale simulation was 229
started). Potential temperature is temperature corrected for the impact of adiabatic compression 230
/ depression on the temperature (see e.g. Holton, 2004), meaning that potential temperature is 231
conserved for adiabatic motions and represents material contours for the flow. h is the thickness 232
of the katabatic layer, calculated as the distance between the surface and a reference potential 233
Figure 5: LMD-MMM results in nested domain #2 (∆x = 6.7 km). Horizontal wind vectors 50m above the local surface (the reference wind vector with a value in m s−1 is included in the top right side of the plot). Topography is in shaded colors. An albedo map of the Martian northern polar region is included in the background to provide context.
Figure 6: LMD-MMM results in nested domain #5 (∆x = 250 m). Horizontal-vertical cross-section of potential temperature with wind vectors superimposed (the reference wind vector with a value in m s−1 is included in the top right side of the plot). Vectors plotted every three grid points. This cross-section in the south-north direction (north is on the rightside) is extracted in the middle of domain #5 in the west-east direction. Figure 8 complements this figure by providing a detailed view on horizontal velocities and temperature.
temperature level of 202 K (this value of potential temperature is chosen to enclose the near-234
surface atmospheric layers where the incoming katabatic wind velocity is high). Figure 6 shows 235
that the event predicted in our nested simulations share all the characteristics of katabatic jumps 236
as described in the terrestrial literature and summarized in Figure 2: acceleration of the atmo-237
spheric flow on the slope, intense jump diagnosed by abruptly increasing vertical velocity and flow 238
thickness, and return flow with negative horizontal velocity. Katabatic jumps simulated by our 239
mesoscale model extends over a height h ∼ 600 m (cf. also Figure 7 bottom-right panel) and 240
develop mostly at the bottom of the upstream slope of the polar trough, exactly where trough 241
clouds are observed to form (Figure 1). Katabatic jumps are also resolved in domain #4 but 242
both the topographic structure of the trough and the horizontal extent of the katabatic jump are 243
insufficiently resolved in this domain, which makes the inclusion of domain #5 necessary to fully 244
resolve the structure with an appropriate horizontal resolution. 245
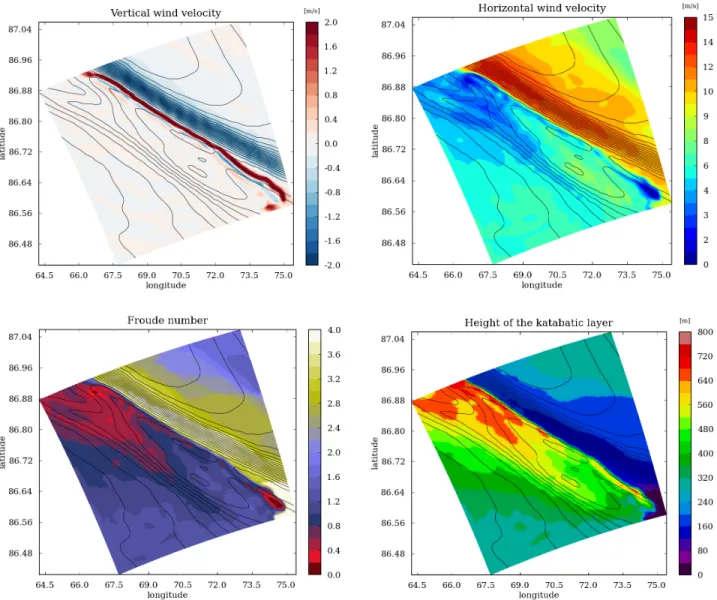
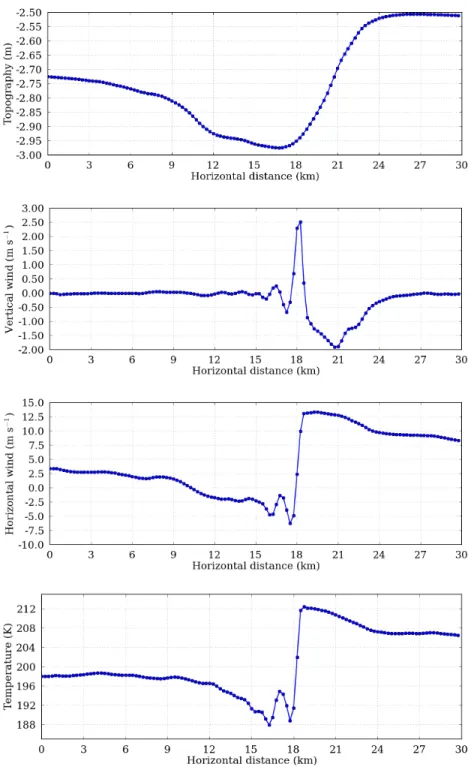
Figures 7, 8, 9 represent the properties of the katabatic jump (vertical velocity, horizontal 246
velocity, temperature) respectively in the horizontal, in the vertical, and profiling the flow at 247
constant height above the surface. Our mesoscale model predicts that the vertical wind velocity 248
is very large in the katabatic jump. Ascending motions within the katabatic jump reach 3 m s−1 249
(Figure 8 and 9, top panels) and maintain at those high values during ∼ 10 Martian hours. This is 250
a significantly high value in a polar environment where the atmosphere is often stable and devoid 251
of strong vertical motions. The large, positive values of vertical velocity in Figures 7, 8, 9 delimit 252
horizontally the katabatic jump to less than 1 km across (about 4 − 5 horizontal grid points, which 253
justifies a posteriori the need to use a modeling downscaling towards a 250 m horizontal resolution). 254
The elongated structure of the katabatic jump in Figure 7 (top-left panel) mirrors the elongated 255
structure of trough cloud evidenced through orbital imagery by Smith et al. (2013) (Figure 7 256
thereby confirms that two-dimensional sections such as Figures 6, 8, 9 are valuable to obtain the 257
properties of the katabatic jump). Furthermore, the presence of trapped gravity waves in the 258
wake of the katabatic jump (cf. vertical velocity as vectors in Figure 6 and contours in Figures 7 259
and 8) provides an explanation for the frequent occurrence of undulations in the morphologies of 260
the trough clouds evidenced through imagery (see Figure 1 in this paper and Figure 3-5 in Smith 261
et al., 2013). 262
The season chosen for our 5-nest mesoscale simulation is Ls ∼ 85◦, known as the peak season
263
for trough clouds (Smith et al., 2013). Smith and Spiga (2017) show through mesoscale modeling 264
that this season is propitious to strong katabatic winds over the northern polar cap, reinforced 265
Figure 7: LMD-MMM results in nested domain #5 (∆x = 250 m) at local time 1730 on the second day of simulation. Horizontal maps of vertical wind velocity (top-left panel), horizontal wind velocity (top-right panel), Froude number F r (bottom-left panel), and height of katabatic layer h (bottom-right panel). The first two quantities are shown at a constant altitude of 130 m above the surface; details on computations of the last two quantities h and F r are provided in the text. Topography is superimposed as contours (see Figure 3, bottom-right panel). North is to the upper part of the plot; katabatic flow is coming from the upper right and accelerate downward perpendicular to the trough. The periodic features seen in the vertical velocity field over the steepest slope of the trough are caused by small artefacts in the MOLA topographical datasets used for our mesoscale simulations. This does not adversely affect the results in this paper.
Figure 8: LMD-MMM results in nested domain #5 (∆x = 250 m). Horizontal-vertical cross-section of vertical wind velocity (top), horizontal wind velocity (middle), temperature (K). Hori-zontal dimension is along the south-north direction (north is on the rightside). HoriHori-zontal wind is positive in the southward direction (i.e. downstream, following the katabatic flow incoming on a polar trough). Regular temperature is shown in this figure, in contrast with Figure 6 where potential
Figure 9: LMD-MMM results in nested domain #5 (∆x = 250 m). From top to bottom: to-pography, vertical wind velocity, horizontal wind velocity, (regular) temperature. Those fields are shown at the constant altitude of 100 m above the local surface. Horizontal dimension is along the south-north direction, with north on the rightside, as in Figure 8. Horizontal wind is positive in the southward (downstream) direction.
by a sea-breeze effect caused by thermal gradients associated with the “crocus line” (the contrast 266
between the retreating seasonal CO2 ice cap and the residual surface – bare soil or water-ice cap).
267
The location of the trough chosen as a target for our domain #5 is in the vicinity of the crocus line 268
at Ls ∼ 85◦. Furthermore, the intensity of katabatic jumps is sensitive to meteorological conditions
269
around Ls ∼ 85◦, following the modulation of the polar cap’s katabatic flow by diurnal and
day-270
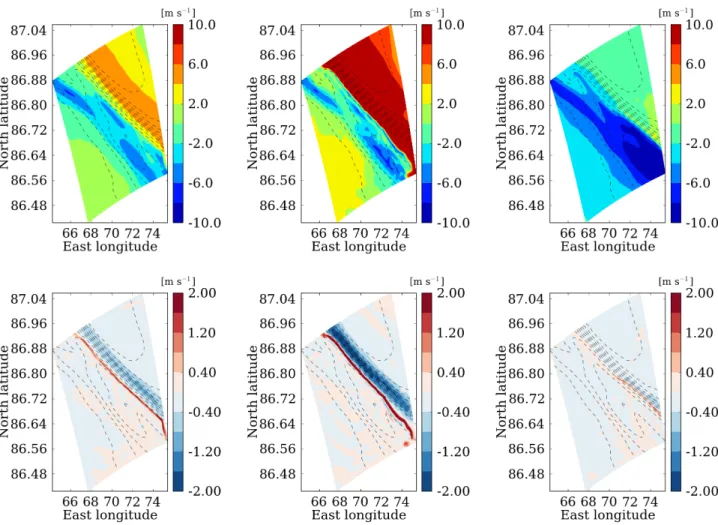
to-day variability (through baroclinic wave activity or polar transients). Over the course of our 271
3-day mesoscale simulation, two additional katabatic jump events analogous to the reference event 272
detailed in Figures 7, 8, 9 are produced (Figure 10), although their amplitude is lower (1 m s−1 273
instead of 3 m s−1 in vertical velocity) and undulations do not appear as clearly as in the reference 274
event. We found that the variations of the incoming katabatic wind in the considered polar trough 275
in Figure 10 is caused by transient eddies with dominant wavenumber 1, akin to the phenomena 276
described in Tyler and Barnes (2005) later in northern summer. A more complete analysis of the 277
diversity of katabatic jumps occurring over the northern polar cap as a result of polar transients 278
will require longer-duration mesoscale simulations as in Tyler and Barnes (2005). 279
As is mentioned above, the katabatic jump is associated with a sudden drop in the horizontal 280
wind speed (Figure 7, top-right panel; Figure 9, middle panel), i.e. an abrupt drop of velocity 281
within an otherwise smooth katabatic flow that continues almost uninterrupted downstream of the 282
polar trough. Figure 6 and Figure 8 (middle panel) show that the horizontal wind in the vicinity of 283
the katabatic jump is even reversing to upstream direction (with respect to the incoming katabatic 284
flow) with a significant wind velocity of ∼ 10 m s−1. As it is the case with polar katabatic jumps 285
on the Earth, the area immediately downstream of the katabatic jump is prone to enhanced mixing 286
and/or stationary flow, which is compliant with the cloud structures observed from orbit in those 287
areas (see Figure 1 in this paper and Figures 3-5, 7-8, 11 in Smith et al., 2013). 288
Katabatic jumps borrow their name from their similarity to hydraulic jumps in open channel 289
flow, which form as the flow transitions from a supercritical “shooting” regime with F r > 1 to a 290
subcritical “tranquil” regime with F r < 1 (Ball, 1956), where F r is the Froude number which can 291
Figure 10: LMD-MMM results in nested domain #5 (∆x = 250 m) at local time 1730 on the first, second and third day of simulation (respectively left, middle, right panels). Horizontal maps of south-north horizontal wind (top panels, with positive values for downstream direction) and vertical wind velocity (bottom panels). Topography is superimposed as contours. Middle row shows the reference katabatic jump event detailed in Figure 7.
be expressed after Pettr´e and Andr´e (1991) 292
F r = q u
∆θ θ g h
where u is the along-slope wind speed, ∆θ/θ the near-surface inversion of potential temperature, 293
g is the acceleration of gravity, and h is the thickness of the katabatic layer (as is defined above 294
and in Figure 7 bottom-right panel). We mapped the Froude number in domain #5 in Figure 7 295
(bottom-left panel). The katabatic flow is highly supercritical (F r > 2 with peak values close 296
to 4.5) over the upstream slope, where the katabatic wind speed is larger and the katabatic layer 297
is thinner (two essential factors to obtain a supercritical flow), and this flow undergoes an abrupt 298
transition to subcritical values (F r = 0.2 − 0.4) at the bottom of the slope. The katabatic jump 299
is found where the incoming flow transitions from a supercritical to a subcritical regime. This 300
is compliant with the katabatic jumps occurring close to the slope break between the upstream 301
trough slope and the downstream trough bottom (Figures 8 and 9), which is also where trough 302
clouds are observed (Smith et al., 2013). 303
The acceleration of the katabatic wind in the upstream slope of the trough pertains to a larger 304
class of atmospheric phenomena named “downslope windstorms” (Durran, 1990; Magalh¯aes and 305
Young, 1995). This phenomena occurs for instance on the leeside of a mountain when an incident 306
large-scale wind flow vanishes to zero near the surface and encounters a non-linear boundary 307
condition (Lott, 2016). Furthermore, strong downslope winds are especially favored in stable 308
conditions. Convective instability at low level in the mountain leeside might occur with a hydraulic-309
jump-like morphology. Both the downslope windstorm and the hydraulic jump do not require 310
gravity wave breaking to form. Downslope windstorms with similar properties were shown to 311
arise as a result of a katabatic flow impinging on the Meteor Crater topographic depression on 312
the Earth, with hydraulic jumps arising shall the background wind be strong enough and the 313
crater be deep enough (Lehner et al., 2016). The katabatic jumps in polar troughs bear a strong 314
resemblance with this terrestrial analog. Besides, this terrestrial example suggests that katabatic 315
jumps shall occur downstream of the rims of a deep-enough crater on Mars on which a strong-316
enough regional-scale katabatic flow is impinging – such as, for instance, within Gale Crater located 317
at the dichotomy boundary (Haberle et al., 2014; Pla-Garcia et al., 2016; Rafkin et al., 2016). 318
Hydraulic jumps generated by katabatic winds were also thought to cause the early morning 319
elongated clouds observed by the Viking Orbiters during late northern spring and early summer 320
(Kahn and Gierasch, 1982); mesoscale modeling provided, however, an explanation based on the 321
propagation of an atmospheric bore wave generated by a katabatic front (Sta. Maria et al., 2006), 322
which would be the propagating equivalent of the nearly-stationary katabatic jump we model here. 323
An important point to discuss ice migration in Martian polar troughs is to know whether the 324
downslope windstorm and the katabatic jump are conducive to the formation of trough clouds as 325
hypothesized in Smith et al. (2013). Katabatic jumps in terrestrial polar regions often lead to the 326
formation of clouds named “wall-of-snow” (Pettr´e and Andr´e, 1991), and the visual appearance 327
of elongated trough clouds on Mars (Figure 1) is reminiscent of those terrestrial clouds. The tem-328
perature simulated in the polar trough is shown in Figure 8 and 9 (bottom panels). Within the 329
katabatic flow blowing downslope the trough, atmospheric temperatures are strongly increasing 330
under the influence of adiabatic compression (Spiga et al., 2011) to reach 210 K; when the katabatic 331
flow undergoes the katabatic jump, atmospheric temperatures are abruptly decreasing to 190 K. 332
Both conditions are highly propitious to the formation of water-ice clouds at the location of the 333
katabatic jump: not only the downslope windstorm implies enhanced sublimation of ground ice to 334
the atmosphere (by enhanced sensible heat flux), but this water-vapor-rich katabatic flow quickly 335
encounters a drop in saturation vapor pressure caused by the −20 K drop in atmospheric tem-336
perature associated with the katabatic jump. Water ice at the surface is available for sublimation 337
at Ls= 85◦ in the trough modeled here; the presence of CO2 ice at other seasons, and the seasonal
338
variability of the surface temperature of water-ice deposits, could yield a much less favorable case 339
for sublimation over the northern polar cap, thereby accounting for the strong seasonality of trough 340
clouds (cf. companion paper Smith and Spiga (2017)). 341
Using Clausius-Clapeyron equations for the Martian atmospheric conditions (e.g., Montmessin 342
et al., 2004), we compute the saturation mass mixing ratio qsat for the pressure and temperature 343
conditions simulated by our model (cf. Figure 8). We then obtain specific humidity H = q/qsat, 344
where q is a typical near-surface mass mixing ratio for water vapor in the summertime northern 345
polar regions, 3 × 10⁻⁴ kg/kg according to LMD-MGCM simulations compiled in the Mars Climate 346
Figure 11: LMD-MMM results in nested domain #5 (∆x = 250 m). Horizontal-vertical cross-section of specific humidity (see text for details on calculations) with wind vectors superimposed (the reference wind vector with a value in m s−1 is included in the top right side of the plot). The 100% humidity limit is indicated by a solid line. Vectors are plotted every three grid points. This cross-section in the south-north direction (north is on the rightside) is extracted in the middle of domain #5 in the west-east direction.
Database (Lewis et al., 1999; Millour et al., 2015). This quantity H is shown in Figure 11, 347
which strongly suggests that the incoming katabatic flow undergoes subsaturated conditions when 348
entering the polar trough, as a result of adiabatic warming, before it undergoes supersaturated 349
conditions at the katabatic jump, conducive to the formation of water-ice clouds. The fact that 350
in Figure 11 the strongest horizontal gradient of specific humidity coincides with the location of 351
the katabatic jump means that the water-ice cloud forms very close to this katabatic jump. This 352
explains that the horizontal elongated morphology of this jump (Figure 7) matches the morphology 353
of the observed trough clouds (Smith et al., 2013). Our modeling is thus in line with the putative 354
scenario described in Smith et al. (2013) for ice migration within polar troughs, with the upstream 355
slope of the trough being ablational for ice deposits (through enhanced sublimation and transport 356
away from the source) and the downstream bottom of the trough being depositional for ice deposits 357
(through water-ice cloud formation). It remains to be determined with a full microphysical model 358
(e.g., Navarro et al., 2014; Spiga et al., 2017) whether the cloud formation implies deposition of 359
ice on the ground by precipitation (if the cloud does not form immediately above the surface) or 360
by direct deposition (if the cloud forms right above the local surface, or if transported water vapor 361
directly recondenses at the surface). 362
4
Discussion
363
Our conclusions can be summarized as follows. 364
1. We demonstrate through high-resolution nested mesoscale modeling that powerful katabatic 365
jumps occur within the northern polar troughs with an incoming downslope (katabatic) 366
windstorm. 367
2. The katabatic jumps occur while the incoming flow transitions from supercritical shooting 368
conditions on the upstream slope of the trough to subcritical tranquil conditions in the 369
downstream part of the trough, making katabatic jumps analogous to hydraulic jumps in 370
open channel flows. 371
3. Those Martian phenomena are strikingly similar to the Loewe phoenomena described in 372
terrestrial polar regions (Pettr´e and Andr´e, 1991). 373
4. The combination of the downslope windstorms and katabatic jumps make the Martian at-374
mospheric conditions in polar troughs propitious to the formation of water-ice clouds which 375
morphology is similar to the observed trough clouds. 376
Our conclusions strengthen the scenario hypothesized by Smith et al. (2013): trough clouds are 377
the visible manifestation of katabatic jumps, which might support a mechanism for ice migration 378
over geological through cyclic steps (Kostic et al., 2010), thereby providing an explanation for 379
the stratigraphy revealed by orbital radar measurements. Despite our new conclusions obtained 380
through unprecedented mesoscale modeling, further work is needed to describe the definitive sce-381
nario about ice migration over the Martian northern polar caps. 382
• Mesoscale modeling coupled to water vapor transport and water ice microphysics is needed 383
to understand how deposition of water ice on the surface occurs from precipitation or direct 384
deposition from trough clouds. 385
• The seasonal and spatial variability of trough clouds needs to be assessed with more extensive 386
simulations accounting for the combined influence of katabatic acceleration, baroclinic waves 387
and polar transients. 388
• The stability and possible migration over geological timescales of water ice surface reservoirs 389
in the Martian polar regions is left to be investigated by paleoclimatic mesoscale modeling; 390
the influence of the varying obliquity is probably an important element to future studies. 391
• It remains to be elucidated how troughs are initiated on the polar cap surface, and how 392
possible katabatic jumps occurring without an initial slope break could form initial surface 393
erosional features that could be reinforced through time to form polar troughs. 394
On a broader perspective, the present work emphasizes how surface-atmosphere interactions 395
are key to understand the properties and evolution of the polar regions of Mars. Additional 396
observations obtained by a dedicated polar orbiter or lander would allow for an in-depth validation 397
of the scenario built here upon numerical modeling. 398
Acknowledgments
399
We thank Fran¸cois Lott for helpful suggestions on mesoscale atmospheric dynamics, Jack Holt for 400
discussions on Martian polar processes, and Dan Tyler for discussions on atmospheric processes in 401
Martian polar regions. Isaac Smith acknowledges funding from the Fulbright Commission during 402
a scientific visit at LMD (Paris) in 2014, which initiated this study. Aymeric Spiga acknowledges 403
funding from Centre National d’´Etudes Spatiales (CNES). We thank two reviewers for constructive 404
and thorough comments which helped us to improve the manuscript prior to publication. 405
References
406
App´er´e, T., Schmitt, B., Langevin, Y., Dout´e, S., Pommerol, A., Forget, F., Spiga, A., Gondet, B., 407
and Bibring, J.-P. (2011). Winter and spring evolution of northern seasonal deposits on Mars 408
from OMEGA on Mars Express. Journal of Geophysical Research (Planets), 116(E15):5001. 409
Ball, F. (1956). The Theory of Strong Katabatic Winds. Australian Journal of Physics, 9:373. 410
Barnes, J. R., Pollack, J. B., Haberle, R. M., Zurek, R. W., Leovy, C. B., Lee, H., and Schaeffer, J. 411
(1993). Mars atmospheric dynamics as simulated by the NASA/Ames general circulation model, 412
2, Transient baroclinic eddies. J. Geophys. Res., 98(E2):3125–3148. 413
Bromwich, D. H., Cassano, J. J., Klein, T., Heinemann, G., Hines, K. M., Steffen, K., and Box, 414
J. E. (2001). Mesoscale Modeling of Katabatic Winds over Greenland with the Polar MM5. 415
Monthly Weather Review, 129:2290–2309. 416
Brothers, T. C., Holt, J. W., and Spiga, A. (2013). Orbital radar, imagery, and atmospheric model-417
ing reveal an aeolian origin for Abalos Mensa, Mars. Geophysical Research Letters, 40:1334–1339. 418
Cantor, B., Malin, M., and Edgett, K. S. (2002). Multiyear Mars Orbiter Camera (MOC) obser-419
vations of repeated Martian weather phenomena during the northern summer season. Journal 420
of Geophysical Research (Planets), 107:5014–+. 421
Cola¨ıtis, A., Spiga, A., Hourdin, F., Rio, C., Forget, F., and Millour, E. (2013). A thermal plume 422
model for the Martian convective boundary layer. Journal of Geophysical Research (Planets), 423
118:1468–1487. 424
Collins, M., Lewis, S. R., Read, P. L., and Hourdin, F. (1996). Baroclinic wave transitions in the 425
Martian atmosphere. Icarus, 120:344–357. 426
Durran, D. R. (1990). Mountain Waves and Downslope Winds, pages 59–81. American Meteoro-427
logical Society, Boston, MA. 428
Forget, F., Hourdin, F., Fournier, R., Hourdin, C., Talagrand, O., Collins, M., Lewis, S. R., Read, 429
P. L., and Huot., J.-P. (1999). Improved general circulation models of the Martian atmosphere 430
from the surface to above 80 km. J. Geophys. Res., 104:24,155–24,176. 431
Gall´ee, H. and Schayes, G. (1992). Dynamical aspects of katabatic wind evolution in the antarctic 432
coastal zone. Boundary-Layer Meteorology, 59(1):141–161. 433
Gall´ee, H., Pettr´e, P., and Schayes, G. (1996). Sudden cessation of katabatic winds in ad´elie land, 434
antarctica. Journal of Applied Meteorology, 35(7):1142–1152. 435
Galperin, B. A., Kantha, L. H., Hassid, S., and Rosati, A. (1988). A quasi-equilibrium turbulent 436
energy model for geophysical flows. J. Atmos. Sci., 45:55–62. 437
Guzewich, S. D., Toigo, A. D., and Waugh, D. W. (2016). The effect of dust on the martian polar 438
vortices. Icarus, 278:100–118. 439
Haberle, R. M., G´omez-Elvira, J., Torre Ju´arez, M., Harri, A.-M., Hollingsworth, J. L., Kahanp¨a¨a, 440
H., Kahre, M. A., Lemmon, M., Mart´ın-Torres, F. J., Mischna, M., Moores, J. E., Newman, C., 441
Rafkin, S. C. R., Renn´o, N., Richardson, M. I., Rodr´ıguez-Manfredi, J. A., Vasavada, A. R., 442
and Zorzano-Mier, M.-P. (2014). Preliminary interpretation of the REMS pressure data from 443
the first 100 sols of the MSL mission. Journal of Geophysical Research (Planets), 119:440–453. 444
Herny, C., Mass´e, M., Bourgeois, O., Carpy, S., Le Mou´elic, S., App´er´e, T., Smith, I. B., Spiga, 445
A., and Rodriguez, S. (2014). Sedimentation waves on the Martian North Polar Cap: Analogy 446
with megadunes in Antarctica. Earth and Planetary Science Letters, 403:56–66. 447
Holt, J. W., Fishbaugh, K. E., Byrne, S., Christian, S., Tanaka, K., Russell, P. S., Herkenhoff, 448
K. E., Safaeinili, A., Putzig, N. E., and Phillips, R. J. (2010). The construction of Chasma 449
Boreale on Mars. Nature, 465:446–449. 450
Holton, J. R. (2004). An introduction to dynamic meteorology, volume 48 of International geo-451
physics series. Elsevier Academic Press, fourth edition. 452
Howard, A. D. (2000). The Role of Eolian Processes in Forming Surface Features of the Martian 453
Polar Layered Deposits. Icarus, 144:267–288. 454
Howard, A. D., Cutts, J. A., and Blasius, K. R. (1982). Stratigraphic relationships within Martian 455
polar CAP deposits. Icarus, 50:161–215. 456
Kahn, R. and Gierasch, P. (1982). Long clouds observations on Mars and implications for boundary 457
layer characteristics over slopes. J. Geophys. Res., 87:867–880. 458
Kauhanen, J., Siili, T., J¨arvenoja, S., and Savij¨arvi, H. (2008). The Mars limited area model and 459
simulations of atmospheric circulations for the Phoenix landing area and season of operation. 460
Journal of Geophysical Research (Planets), 113:E00A14. 461
Kieffer, H. H., Titus, T. N., Mullins, K. F., and Christensen, P. R. (2000). Mars south polar spring 462
and summer behavior observed by TES: Seasonal cap evolution controlled by frost grain size. 463
J. Geophys. Res., 105:9653–9700. 464
Kostic, S., Sequeiros, O., Spinewine, B., and Parker, G. (2010). Cyclic steps: A phenomenon 465
of supercritical shallow flow from the high mountains to the bottom of the ocean. Journal of 466
Hydro-environment Research, 3(4):167–172. 467
Lehner, M., Rotunno, R., and Whiteman, C. D. (2016). Flow regimes over a basin induced by 468
upstream katabatic flows—an idealized modeling study. Journal of the Atmospheric Sciences, 469
73:3821 – 3842. 470
Lewis, S. R., Collins, M., Read, P. L., Forget, F., Hourdin, F., Fournier, R., Hourdin, C., Talagrand, 471
O., and Huot., J.-P. (1999). A climate database for Mars. J. Geophys. Res., 104:24,177–24,194. 472
Lied, N. T. (1964). Stationary hydraulic jumps in a katabatic flow near davis, antarctica, 1961. 473
Aust. Meteorol. Mag, 47:40–51. 474
Lott, F. (2016). A new theory for downslope windstorms and trapped mountain waves. Journal 475
of the Atmospheric Sciences, 73(9):3585–3597. 476
Madeleine, J.-B., Forget, F., Millour, E., Navarro, T., and Spiga, A. (2012). The influence of 477
radiatively active water ice clouds on the Martian climate. Geophys. Res. Lett., 39:23202. 478
Magalh¯aes, J. A. and Young, R. E. (1995). Downslope Windstorms in the Lee of Ridges on Mars. 479
Icarus, 113:277–294. 480
Mahrt, L. (1982). Momentum Balance of Gravity Flows. Journal of the Atmospheric Sciences, 481
39(12):2701–2711. 482
Mass´e, M., Bourgeois, O., Le Mou´elic, S., Verpoorter, C., Spiga, A., and Le Deit, L. (2012). Wide 483
distribution and glacial origin of polar gypsum on Mars. Earth and Planetary Science Letters, 484
317:44–55. 485
McCleese, D. J., Schofield, J. T., Taylor, F. W., Abdou, W. A., Aharonson, O., Banfield, D., 486
Calcutt, S. B., Heavens, N. G., Irwin, P. G. J., Kass, D. M., Kleinb¨ohl, A., Lawson, W. G., 487
Leovy, C. B., Lewis, S. R., Paige, D. A., Read, P. L., Richardson, M. I., Teanby, N., and Zurek, 488
R. W. (2008). Intense polar temperature inversion in the middle atmosphere on Mars. Nature 489
Geoscience, 1:745–749. 490
Mellor, G. L. and Yamada, T. (1982). Development of a turbulence closure model for geophysical 491
fluid problems. Rev. of Geophys., 20(4):851–875. 492
Michaels, T. I. and Rafkin, S. C. R. (2004). Large eddy simulation of atmospheric convection on 493
Mars. Q. J. R. Meteorol. Soc., 130:1251–1274. 494
Michaels, T. I. and Rafkin, S. C. R. (2008). Meteorological predictions for candidate 2007 Phoenix 495
Mars Lander sites using the Mars Regional Atmospheric Modeling System (MRAMS). Journal 496
of Geophysical Research (Planets), 113(E12):0–+. 497
Millour, E., Forget, F., Spiga, A., Navarro, T., Madeleine, J.-B., Montabone, L., Pottier, A., 498
Lefevre, F., Montmessin, F., Chaufray, J.-Y., Lopez-Valverde, M. A., Gonzalez-Galindo, F., 499
Lewis, S. R., Read, P. L., Huot, J.-P., Desjean, M.-C., and MCD/GCM development Team 500
(2015). The Mars Climate Database (MCD version 5.2). European Planetary Science Congress 501
2015, 10:EPSC2015–438. 502
Mitchell, D. M., Montabone, L., Thomson, S., and Read, P. L. (2015). Polar vortices on Earth 503
and Mars: A comparative study of the climatology and variability from reanalyses. Quarterly 504
Journal of the Royal Meteorological Society, 141:550–562. 505
Montabone, L., Forget, F., Millour, E., Wilson, R. J., Lewis, S. R., Cantor, B., Kass, D., Kleinb¨ohl, 506
A., Lemmon, M. T., Smith, M. D., and Wolff, M. J. (2015). Eight-year climatology of dust optical 507
depth on Mars. Icarus, 251:65–95. 508
Montmessin, F., Forget, F., Rannou, P., Cabane, M., and Haberle, R. M. (2004). Origin and 509
role of water ice clouds in the Martian water cycle as inferred from a general circulation model. 510
Journal of Geophysical Research (Planets), 109(E18):10004. 511
Navarro, T., Madeleine, J.-B., Forget, F., Spiga, A., Millour, E., Montmessin, F., and M¨a¨att¨anen, 512
A. (2014). Global Climate Modeling of the Martian water cycle with improved microphysics and 513
radiatively active water ice clouds. Journal of Geophysical Research (Planets). 514
Nylen, T. H., Fountain, A. G., and Doran, P. T. (2004). Climatology of katabatic winds in the 515
McMurdo dry valleys, southern Victoria Land, Antarctica. Journal of Geophysical Research 516
(Atmospheres), 109:D03114. 517
Parish, T. R. and Waight, K. T. (1987). The Forcing of Antarctic Katabatic Winds. Monthly 518
Weather Review, 115:2214–+. 519
Pathare, A. V. and Paige, D. A. (2005). The effects of martian orbital variations upon the subli-520
mation and relaxation of north polar troughs and scarps. Icarus, 174:419–443. 521
Pettr´e, P. and Andr´e, J.-C. (1991). Surface-Pressure Change through Loewe’s Phenomena and 522
Katabatic Flow Jumps: Study of Two Cases in Ad´elie Land, Antarctica. Journal of Atmospheric 523
Sciences, 48:557–571. 524
Pettr´e, P., Payan, C., and Parish, T. R. (1993). Interaction of katabatic flow with local thermal 525
effects in a coastal region of adelie land, east antarctica. Journal of Geophysical Research: 526
Atmospheres, 98(D6):10429–10440. 527
Pla-Garcia, J., Rafkin, S. C. R., Kahre, M., Gomez-Elvira, J., Hamilton, V. E., Navarro, S., 528
Torres, J., Mar´ın, M., and Vasavada, A. R. (2016). The meteorology of Gale crater as deter-529
mined from rover environmental monitoring station observations and numerical modeling. Part 530
I: Comparison of model simulations with observations. Icarus, 280:103–113. 531
Rafkin, S. C. R., Haberle, R. M., and Michaels, T. I. (2001). The Mars Regional Atmospheric 532
Modeling System: Model Description and Selected Simulations. Icarus, 151:228–256. 533
Rafkin, S. C. R., Pla-Garcia, J., Kahre, M., Gomez-Elvira, J., Hamilton, V. E., Mar´ın, M., Navarro, 534
S., Torres, J., and Vasavada, A. (2016). The meteorology of Gale Crater as determined from 535
Rover Environmental Monitoring Station observations and numerical modeling. Part II: Inter-536
pretation. Icarus, 280:114–138. 537
Siili, T., Haberle, R. M., Murphy, J. R., and Savijarvi, H. (1999). Modelling of the combined 538
late-winter ice cap edge and slope winds in Mars Hellas and Argyre regions. Planet. Space Sci., 539
47:951–970. 540
Skamarock, W. C. and Klemp, J. B. (2008). A time-split nonhydrostatic atmospheric model for 541
weather research and forecasting applications. Journal of Computational Physics, 227:3465– 542
3485. 543
Smagorinsky, J. (1963). General circulation experiments with the primitive equations. i. the basic 544
experiment. Mon. Weather Rev., 91:99–164. 545
Smith, D. E., Zuber, M. T., Frey, H. V., Garvin, J. B., Head, J. W., Muhleman, D. O., Pettengill, 546
G. H., Phillips, R. J., Solomon, S. C., Zwally, H. J., Banerdt, W. B., Duxbury, T. C., Golombek, 547
M. P., Lemoine, F. G., Neumann, G. A., Rowlands, D. D., Aharonson, O., Ford, P. G., Ivanov, 548
A. B., Johnson, C. L., McGovern, P. J., Abshire, J. B., Afzal, R. S., and Sun, X. (2001). Mars 549
Orbiter Laser Altimeter: Experiment summary after the first year of global mapping of Mars. 550
J. Geophys. Res., 106:23689–23722. 551
Smith, I. and Spiga, A. (2017). Seasonal Variability in Winds in the North Polar Region of Mars. 552
Icarus (revision submitted). 553
Smith, I. B. and Holt, J. W. (2010). Onset and migration of spiral troughs on Mars revealed by 554
orbital radar. Nature, 465:450–453. 555
Smith, I. B. and Holt, J. W. (2015). Spiral trough diversity on the north pole of mars, as seen by 556
shallow radar (sharad). Journal of Geophysical Research: Planets, 120(3):362–387. 557
Smith, I. B., Holt, J. W., Spiga, A., Howard, A. D., and Parker, G. (2013). The spiral troughs of 558
mars as cyclic steps. Journal of Geophysical Research: Planets, 118(9):1835–1857. 559
Smith, I. B., Spiga, A., and Holt, J. W. (2015). Aeolian processes as drivers of landform evolution 560
at the South Pole of Mars. Geomorphology, 240:54–69. 561
Spiga, A. (2011). Elements of comparison between Martian and terrestrial mesoscale meteorological 562
phenomena: Katabatic winds and boundary layer convection. Planetary and Space Science, 563
59:915–922. 564
Spiga, A., Faure, J., Madeleine, J.-B., M¨a¨att¨anen, A., and Forget, F. (2013). Rocket dust storms 565
and detached dust layers in the Martian atmosphere. Journal of Geophysical Research (Planets), 566
118:746–767. 567
Spiga, A. and Forget, F. (2009). A new model to simulate the Martian mesoscale and microscale 568
atmospheric circulation: Validation and first results. Journal of Geophysical Research (Planets), 569
114:E02009. 570
Spiga, A., Forget, F., Lewis, S. R., and Hinson, D. P. (2010). Structure and dynamics of the 571
convective boundary layer on mars as inferred from large-eddy simulations and remote-sensing 572
measurements. Quarterly Journal of the Royal Meteorological Society, 136:414–428. 573
Spiga, A., Forget, F., Madeleine, J., Montabone, L., Lewis, S. R., and Millour, E. (2011). The 574
impact of Martian mesoscale winds on surface temperature and on the determination of thermal 575
inertia. Icarus, 212:504–519. 576
Spiga, A., Hinson, D., Madeleine, J., Navarro, T., Millour, E., Forget, F., and Montmessin, F. 577
(2017). Snow precipitation on Mars driven by cloud-induced nighttime convection. Nature 578
Geoscience, 10:652–657. 579
Sta. Maria, M. R. V., Rafkin, S. C. R., and Michaels, T. I. (2006). Numerical simulation of 580
atmospheric bore waves on Mars. Icarus, 185:383–394. 581
Titus, T. N. (2005). Mars Polar Cap Edges Tracked over 3 Full Mars Years. In Mackwell, S. 582
and Stansbery, E., editors, 36th Annual Lunar and Planetary Science Conference, volume 36 of 583
Lunar and Planetary Inst. Technical Report. 584
Toigo, A. D., Lee, C., Newman, C. E., and Richardson, M. I. (2012). The impact of resolution on 585
the dynamics of the martian global atmosphere: Varying resolution studies with the MarsWRF 586
GCM. Icarus, 221:276–288. 587
Toigo, A. D., Richardson, M. I., Wilson, R. J., Wang, H., and Ingersoll, A. P. (2002). A first look 588
at dust lifting and dust storms near the south pole of Mars with a mesoscale model. Journal of 589
Geophysical Research (Planets), 107:5050–+. 590
Tyler, D. and Barnes, J. R. (2005). A mesoscale model study of summertime atmospheric circula-591
tions in the north polar region of Mars. Journal of Geophysical Research (Planets), 110(E9):6007– 592
+. 593
Tyler, D. and Barnes, J. R. (2014). Atmospheric mesoscale modeling of water and clouds during 594
northern summer on Mars. Icarus, 237:388–414. 595
Tyler, D., Barnes, J. R., and Skyllingstad, E. D. (2008). Mesoscale and large-eddy simulation 596
model studies of the Martian atmosphere in support of Phoenix. Journal of Geophysical Research 597
(Planets), 113(E12):0–+. 598
Wilson, R. J. (1997). A general circulation model of the Martian polar warming. Geo-599
phys. Res. Lett., 24:123–126. 600
Wyngaard, J. (2004). Toward Numerical Modeling in the ¿Terra Incognita¿. Journal of the 601
Atmospheric Sciences, 61(14):1816–1826. 602
Yu, Y. and Cai, X.-M. (2006). Structure and dynamics of katabatic flow jumps: idealised simula-603
tions. Boundary-layer meteorology, 118(3):527–555. 604