HAL Id: hal-00328534
https://hal.archives-ouvertes.fr/hal-00328534
Submitted on 21 Sep 2007
HAL is a multi-disciplinary open access
archive for the deposit and dissemination of
sci-entific research documents, whether they are
pub-lished or not. The documents may come from
teaching and research institutions in France or
abroad, or from public or private research centers.
L’archive ouverte pluridisciplinaire HAL, est
destinée au dépôt et à la diffusion de documents
scientifiques de niveau recherche, publiés ou non,
émanant des établissements d’enseignement et de
recherche français ou étrangers, des laboratoires
publics ou privés.
and columns using ground-based zenith-sky DOAS
observations at Harestua, 60° N
F. Hendrick, M. van Roozendael, Martyn P. Chipperfield, M. Dorf, Florence
Goutail, X. Yang, C. Fayt, C. Hermans, K. Pfeilsticker, Jean-Pierre
Pommereau, et al.
To cite this version:
F. Hendrick, M. van Roozendael, Martyn P. Chipperfield, M. Dorf, Florence Goutail, et al.. Retrieval
of stratospheric and tropospheric BrO profiles and columns using ground-based zenith-sky DOAS
observations at Harestua, 60° N. Atmospheric Chemistry and Physics, European Geosciences Union,
2007, 7 (18), pp.4885. �hal-00328534�
www.atmos-chem-phys.net/7/4869/2007/ © Author(s) 2007. This work is licensed under a Creative Commons License.
Chemistry
and Physics
Retrieval of stratospheric and tropospheric BrO profiles and
columns using ground-based zenith-sky DOAS observations at
Harestua, 60
◦
N
F. Hendrick1, M. Van Roozendael1, M. P. Chipperfield2, M. Dorf3, F. Goutail4, X. Yang5, C. Fayt1, C. Hermans1, K. Pfeilsticker3, J.-P. Pommereau4, J. A. Pyle5, N. Theys1, and M. De Mazi`ere1
1Institut d’A´eronomie Spatiale de Belgique (IASB-BIRA), Brussels, Belgium
2Institute for Atmospheric Science, School of Earth and Environment, University of Leeds, Leeds, UK 3Institute for Environmental Physics, University of Heidelberg, Heidelberg, Germany
4Service d’A´eronomie du CNRS, Verri`eres-le-Buisson, France
5Centre for Atmospheric Science, Department of Chemistry, University of Cambridge, Cambridge, UK
Received: 1 June 2007 – Published in Atmos. Chem. Phys. Discuss.: 21 June 2007
Revised: 10 September 2007 – Accepted: 12 September 2007 – Published: 21 September 2007
Abstract. A profiling algorithm based on the optimal estimation method is applied to ground-based zenith-sky UV-visible measurements from Harestua, Southern Norway (60◦N, 11◦E) in order to retrieve BrO vertical profiles. The sensitivity of the zenith-sky observations to the tropospheric BrO detection is increased by using for the spectral analysis a fixed reference spectrum corresponding to clear-sky noon summer conditions. The information content and retrieval er-rors are characterized and it is shown that the retrieved strato-spheric profiles and total columns are consistent with correl-ative balloon and satellite observations, respectively. Tro-pospheric BrO columns are derived from profiles retrieved at 80◦solar zenith angle during sunrise and sunset for the 2000– 2006 period. They show a marked seasonality with mean col-umn value ranging from 1.52±0.62×10¹³molec/cm2in late winter/early spring to 0.92±0.38×10¹³molec/cm2 in sum-mer, which corresponds to 1.0±0.4 and 0.6±0.2 pptv, re-spectively, if we assume that BrO is uniformly mixed in the troposphere. These column values are also consistent with previous estimates made from balloon, satellite, and other ground-based observations. Daytime (10:30 LT) tropo-spheric BrO columns are compared to the p-TOMCAT 3-D tropospheric chemical transport model (CTM) for the 2002– 2003 period. p-TOMCAT shows a good agreement with the retrieved columns except in late winter/early spring where an underestimation by the model is obtained. This finding could be explained by the non-inclusion of sea-ice bromine sources in the current version of p-TOMCAT. Therefore the model cannot reproduce the possible transport of air-masses with enhanced BrO concentration due to bromine explosion
Correspondence to: F. Hendrick
events from the polar region to Harestua. The daytime spheric BrO columns are compared to the SLIMCAT strato-spheric 3-D-CTM. The model run used in this study, which assumes 21.2 pptv for the Bryloading (15 pptv for long-lived
bromine species and additional 6 pptv for very short-lived species (VSLS) added by a scaling of CH3Br), significantly
underestimates the retrieved BrO columns. A sensitivity study shows that a good agreement can only be obtained if 6 to 8 pptv accounting for VSLS are added directly (and not by a scaling of CH3Br) to the SLIMCAT long-lived bromine
species profile. This contribution of the VSLS to the total bromine loading is also consistent with recently published studies.
1 Introduction
Bromine monoxide (BrO) is a key atmospheric trace gas known to cause significant ozone destruction in both the stratosphere and troposphere. In the stratosphere, BrO contributes to ozone depletion through its catalytic reac-tions with ClO, HO2, NO2, and O (e.g., Lary, 1996). At
mid-latitude these catalytic cycles account for about 25% of the ozone loss while in polar regions this contribu-tion may reach 50%, mainly through the BrO/ClO cycle (Chipperfield and Pyle, 1998; Lee et al., 2002; Sinnhu-ber et al., 2006). BrO is also the most abundant inor-ganic bromine species during daytime (BrO/Bry ∼0.6 with
Bry=Br+BrO+BrONO2+HBr+HOBr+BrCl). The sources
of inorganic bromine in the stratosphere are natural, with methyl bromide (CH3Br), and anthropogenic with CH3Br
and halons. Several studies (Pfeilsticker et al., 2000; Salaw-itch et al., 2005; Sinnhuber et al., 2005, WMO 2007) have
suggested that the transport of very short-lived organic com-pounds like CHBr3, CH2BrCl, CHBrCl2 or CH2BrCH2Br
to the stratosphere would have a significant contribution (4 to 8 pptv) to the total stratospheric bromine loading. This could at least partly explain inconsistencies obtained be-tween stratospheric Bryinferred from BrO observations
(be-tween 18±3 and 21.5±3 parts per trillion by volume, pptv (e.g., Schofield et al., 2006; Dorf et al., 2006, and references therein) and the delivery of bromine to the stratosphere by the long-lived species CH3Br and halons estimated to about
15 pptv (WMO, 2003).
In the troposphere, BrO also directly affects ozone by de-stroying it or by reducing its production (e.g., von Glasow et al., 2004). Large BrO enhancements associated with low ozone levels have been found in spring in the polar boundary layer by satellite and ground-based DOAS observations (e.g., Kreher et al., 1997; Wagner et al., 2001; Frieß et al., 2004). Frost flowers, which are highly saline crystals appearing on top of the sea ice surface, are believed to play a major role in the production of the reactive bromine at the origin of these so-called “bromine explosion events”. High BrO mixing ra-tios associated with low ozone levels have been also detected in the marine boundary layer (Leser et al., 2003), over salt lakes (Hebestreit et al., 1999), and in volcanic plumes (Bo-browski et al., 2003). In the free troposphere, several satel-lite (e.g., Richter et al., 2002; Van Roozendael et al., 2002), balloon (Harder et al., 2000; Fitzenberger et al., 2000), and ground-based DOAS observations (e.g., Van Roozendael et al., 2002; Schofield et al., 2004 and 2006; Theys et al., 2007), have shown evidences for the presence of a global back-ground of tropospheric BrO. However, there are still spec-ulations about the BrO volume mixing ratio corresponding to this background: according the different observations, the tropospheric BrO vertical column amount can range from 0.3 to 3.7×10¹³molec/cm2, corresponding to 0.2–2.3 pptv if we assume that BrO is uniformely mixed in the troposphere.
The ground-based DOAS (Differential Optical Absorption Spectroscopy) technique (Platt, 1994) has been extensively used to study and monitor ozone depletion in the strato-sphere and more recently in the tropostrato-sphere (see H¨onninger et al. (2004) for a comprehensive description of the dif-ferent applications of the DOAS technique). A signifi-cant part of this monitoring effort has been carried out through the UV-vis network of the NDACC (Network of the Detection of Atmospheric Composition Change, formerly NDSC). The NDACC/UV-vis network consists in more than 35 spectrometers operating from pole to pole and providing time-series of total vertical columns of O3, NO2, and, in a
near future, of BrO (further information at http://www.ndsc. ncep.noaa.gov/). Since the early 1970s, several studies have shown the ability to retrieve information on the vertical dis-tribution of trace gas species like NO2and O3from
ground-based zenith-sky DOAS observations (Brewer et al., 1973; Noxon, 1975; McKenzie et al., 1991; Preston et al., 1997; Hendrick et al., 2004, and Denis et al., 2005). In most of the
aforementioned studies, the retrieval algorithm was based on the Optimal Estimation Method (OEM), which is a widely used technique for solving atmospheric remote sensing in-verse problems (Rodgers, 2000). In Schofield et al. (2004 and 2006), the OEM has been also applied to combined ground-based zenith-sky and direct sun observations in or-der to retrieve tropospheric and stratospheric BrO columns at Lauder (45◦S) and Arrival Height (78◦S). The sensitivity to the stratosphere was provided by the zenith-sky geometry, while the direct sun geometry ensured adequate sensitivity to the troposphere. Very recently in a theoretical study, Frieß et al. (2006) used the OEM to derive vertically-resolved in-formation on atmospheric aerosols from Multi-AXis (MAX) DOAS measurements of the oxygen collision complex (O4).
Here we report on the retrieval of the vertical distribu-tion of BrO in the atmosphere using ground-based zenith-sky DOAS observations performed during the 2000–2006 period at the NDACC station of Harestua, Southern Norway (60◦N, 11◦E). The paper is divided into 6 parts. In the first part, the ground-based UV-visible observations and DOAS set-tings are described. Since the sensitivity of the zenith-sky measurements to the troposphere relies on the choice of an appropriate reference spectrum for the DOAS analysis, this point is extensively discussed. The second part is dedicated to the description of the profiling algorithm based on the OEM. In the third part, the BrO retrievals are characterized regarding the information content, error budget, and retrieval fit results. The consistency between BrO retrievals and cor-relative satellite and balloon data is verified in the fourth part. In the fifth part, tropospheric and stratospheric BrO columns are derived from the retrieved profiles. The consistency of the tropospheric columns with previously published estimates is also discussed. Finally, in the sixth part, the tropospheric and stratospheric columns are compared to model calculations.
2 Ground-based DOAS observations
Ground-based zenith-sky UV-visible observations have been continuously performed by IASB-BIRA at the NDACC sta-tion of Harestua since 1998. The instrument consists of two zenith-sky looking grating spectrometers using cooled photodiode-array detectors and recording radiances in the UV and visible regions (Van Roozendael et al., 1998). Spec-tral range and resolution of the UV spectrometer used for BrO measurements are 330–390 nm and 0.6 nm FWHM, re-spectively. Measured zenith radiance spectra are analyzed using the DOAS technique (Platt, 1994). BrO differential slant column densities (DSCDs), which are the direct prod-uct of the DOAS analysis, are retrieved in the 345–359 nm wavelength range, taking into account the spectral signature of NO2, O3, O4, OClO, and the Ring effect. The BrO
cross-sections are from Wilmouth et al. (1999). A typical example of a BrO DOAS fit is presented in Fig. 1. More details on the DOAS settings can be found in Aliwell et al. (2002) and
Theys et al. (2007). It should also be noted that the instru-ment has been validated through several NDACC campaigns: Lauder 1992 (Hoffman et al., 1995), OHP 1996 (Roscoe et al., 1999; Aliwell et al., 2002), and Andøya 2003 (Vandaele et al., 2005).
In the present study, absolute BrO SCDs covering the 2000–2006 period are provided as input to the profiling al-gorithm. These are evaluated using a fixed noon summer spectrum as reference and the residual amount of BrO in the reference spectrum (RSCD) is calculated prior to the pro-filing step. This is in contrast to the NO2profile retrievals
performed at Harestua (Hendrick et al., 2004) where zenith radiance spectra were analyzed with respect to daily refer-ence spectra and the NO2RSCDs were directly fitted by the
profiling algorithm. Here, a fixed reference spectrum is used for each year of measurement data. Clear-sky noon summer reference spectra are chosen in order to maximize the sig-nal to noise ratio of the measurements and to minimize the residual absorption by BrO in both the troposphere and the stratosphere since the different light paths through the atmo-sphere and hence expected BrO absorption are smallest at noon. Therefore, the use of such fixed reference spectra sig-nificantly enhances the sensitivity of the measurements to the tropospheric BrO content (see also Sect. 4.1).
The BrO RSCDs corresponding to the selected reference spectra are estimated using a two-step method. The prin-ciple of this method is to use two different approaches to calculate the total BrO vertical column densities (VCDs): one approach which depends on the BrO photochemistry but not on the BrO RSCD (photochemically-modified Langley-plot analysis) and a second approach which depends on the BrO RSCD but not on the BrO photochemistry. Evidently, both approaches should give identical total BrO VCDs and this is used to constrain the BrO RSCD value. In the first step, the total BrO vertical columns (VCDs) are calculated at 75◦solar zenith angle (SZA) for both sunrise and sunset for each day of the April–August period (where the SZA at local noon at Harestua is smaller than 50◦SZA) using a modified Langley-plot analysis taking into account the diurnal varia-tion of stratospheric BrO (see Eq. 1). 75◦SZA is chosen to minimize the impact of a possible diurnal variation of tropo-spheric BrO on the Langley-plot analysis.
DSCD(θ )=−RSCD+VCDtotal,75◦SZAAMFtotal,75◦SZA(θ ) (1)
where DSCD(θ ) is the differential SCD at the SZA of
θ , RSCD the residual amount in the reference spectrum,
VCDtotal,75◦SZA the total BrO VCD at 75◦ SZA (slope of
the Langley plot), and AMFtotal,75◦SZA(θ ) is the total
pho-tochemical AMF at SZA of θ and is given by the following expression:
AMFtotal,75◦SZA(θ )
=ftropoAMFtropo(θ )+(1−ftropo)AMFstrato,75◦SZA(θ ) (2)
where ftropois the contribution of the troposphere to the total
BrO column, AMFtropo(θ ) the tropospheric AMF at the SZA
Differential optical density -0.0008
-0.0006 -0.0004 -0.0002 0.0000 0.0002 0.0004 measured fitted Wavelength [nm] 345 350 355 360 -0.0002 0.0000 0.0002 Residual
Fig. 1. Example of a BrO DOAS fit at Harestua (1 June 2004, 86◦
SZA).
of θ , and AMFstrato,75◦SZA(θ ) is the stratospheric AMF at the
SZA of θ photochemically modified with respect to 75◦SZA (AMFstrato,75◦SZA(θ ) = SCDstrato(θ )/VCDstrato(75◦)). Using
such photochemically modified AMFs allows to remove the change in the VCDs due to the photochemistry from the AMFs.
Both tropospheric and stratospheric AMFs are calculated using the radiative transfer model (RTM) UVspec/DISORT (see Sect. 3). In case of tropospheric AMFs, a constant BrO concentration of 1×10⁷molec/cm3in the whole troposphere is used. Stratospheric photochemical AMFs are generated using BrO diurnal variation calculated by the stacked box photochemical model PSCBOX (see Sect. 3).
The contribution of the troposphere to the total BrO col-umn appearing in Eq. (2), ftropo, is adjusted in order to get
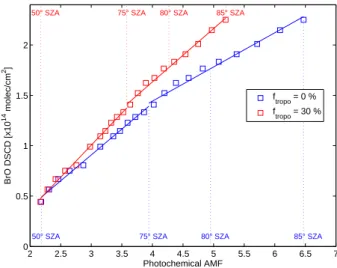
photochemically-modified Langley plots independent of the considered SZA range. Five SZA ranges (50–75◦, 50–77.5◦, 50–80◦, 50–82.5◦, and 50–85◦) and four tropospheric con-tributions relative to the total atmospheric BrO VCD (0, 20, 30, and 40%) are investigated. In Fig. 2, the ratio between the mean of BrO VCDs calculated for the 2000–2006 period in the different SZA ranges at sunset and the mean of BrO VCDs estimated in the 50–75◦ SZA range (taken as refer-ence) is plotted as a function of the upper limit of the dif-ferent SZA ranges. We see that the BrO VCD calculated for a SZA of 75◦ becomes almost independent of the SZA range selected for the Langley-plot analysis when the tro-pospheric contribution to the total column ftroporeaches 30–
40% (impact of the SZA range smaller than 5%). Therefore we have chosen to fix ftropo to 30% for the calculation of
AMFtotal,75◦SZA(θ ). Figure 3 shows an example of Langley
plots obtained with ftropo fixed to 0 and 30%. The marked
Table 1. Residual amount of BrO in the selected reference spectra (RSCDs) estimated using three SZA ranges (50–75◦, 50–80◦, and 50–
85◦SZA) for a tropospheric contribution to the total BrO column amount of 30%. Errors due to the choice of the SZA range and to the
uncertainties on ftropoand the shape of the BrO profile in the troposphere are given. The total error is calculated by adding the three errors in quadrature.
Year Julian day of Mean Error due to Error due to Error due to Total error
ref. spectrum RSCD SZA range ftropofactor profile shape
(×1013molec/cm2) 2000 172 5.96 0.10 0.92 0.50 1.05 (18%) 2001 186 4.94 0.07 0.89 0.34 0.96 (19%) 2002 200 7.98 0.09 0.91 0.36 0.98 (12%) 2003 197 6.80 0.13 0.95 0.47 1.07 (16%) 2004 202 6.83 0.29 0.98 0.39 1.09 (16%) 2005 221 10.38 0.23 1.02 0.34 1.10 (11%) 2006 161 5.44 0.65 1.02 0.47 1.30 (24%) 75 80 85 0.8 0.85 0.9 0.95 1 1.05
SZA max. for Langley plots [°]
Mean BrO VCD (50°−SZA max)/Mean BrO VCD (50°−75°)
ftropo = 0 % ftropo = 20 % f tropo = 30 % f tropo = 40 %
Fig. 2. Impact of the SZA range used in the Langley-plot
analy-ses on the calculated BrO VCDs for different tropospheric contri-butions to the total BrO column (0, 20, 30, and 40%). Mean BrO VCDs calculated at sunset for the 2000–2006 period using five SZA ranges for the Langley-plot analyses (50–75◦, 50–77.5◦, 50–80◦, 50–82.5◦, and 50–85◦) are plotted as a function of the upper limit of the different SZA ranges. Mean BrO VCDs are normalized by
the values obtained for the 50–75◦SZA range.
results from a mismatch in the shape of the BrO profile used to calculate AMFs and we see that a ftropo value of 30%
significantly improves the linearity of the Langley plot. It should be noted that similar results are obtained for sunrise BrO data.
In the second and last step, total BrO VCDs at 75◦SZA are calculated for each day and at both sunrise and sunset using non-photochemically modified AMFs at 75◦SZA:
VCDtotal,75◦SZA=(DSCD(75◦)+RSCD)/AMFtotal(75◦) (3)
2 2.5 3 3.5 4 4.5 5 5.5 6 6.5 7 0 0.5 1 1.5 2 Photochemical AMF BrO DSCD [x10 14 molec/cm 2]
50° SZA 75° SZA 80° SZA 85° SZA
50° SZA 75° SZA 80° SZA 85° SZA
f
tropo = 0 %
f
tropo = 30 %
Fig. 3. Typical example of Langley-plot analyses obtained for the
24 April 2003 sunset case using a tropospheric contribution to the total BrO column of 0 (blue squares) and 30%(red squares). A ftropo value of 30% significantly improves the linearity of the Langley plot.
where AMFtotal(75◦) = ftropo AMFtropo(75◦) + (1–ftropo)
AMFstrato(75◦) and with ftropofixed to 30%.
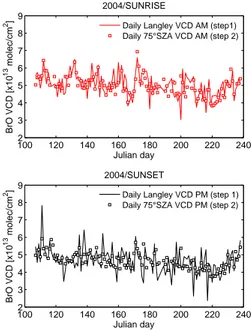
RSCD in Eq. (3) is then fitted in order to get the best match between the BrO VCDtotal,75◦SZA calculated using Eqs. (1)
and (3), respectively. Figure 4 shows an example of fit re-sults (obtained for the year 2004). The BrO RSCDs esti-mated for each reference spectrum and averaged over three different SZA ranges (50–75◦, 50–80◦, and 50–85◦) for the Langley-plot analyses (Eq. 1) are presented in Table 1. Mean BrO RSCD values are added to the BrO DSCDs in order to obtain the absolute BrO SCDs that are used by the retrieval algorithm. In addition to the error on BrO RSCDs associated to the choice of the SZA range for the Langley-plot analyses, we have investigated the impact of two other error sources:
the uncertainties on ftropo and on the shape of the BrO
pro-file used for the calculation of AMFtropo. In order to achieve
that, Langley-plot analyses have been performed by taking a ftropovalue of 20 and 40% instead of 30% (30%±10%) and
for the second parameter, by using a Gaussian profile shape for BrO in the troposphere (peak at 5 km, full width at half maximum (FWHM): 4 km) instead of constant BrO concen-tration in the whole troposphere as in the standard Langley-plot analyses. These errors have been calculated for each year and are presented in Table 1. It appears that the total error on BrO RSCDs is in the 11–25% range.
3 Retrieval algorithm
The retrieval algorithm used here is the IASB-BIRA NO2
profiling algorithm adapted to BrO. Since a detailed descrip-tion of this algorithm can be found in Hendrick et al. (2004), only the main features will be given in the present section.
The inversion method employed is the Optimal Estima-tion (OEM; Rodgers, 2000). In this method, a profile⌢x is
retrieved given an a priori profile xa, the measurements y
(here, a set of absolute BrO SCDs as a function of SZA), their respective uncertainty covariance matrices (Saand Sε), and the matrix K of the weighting functions. Since BrO is an optically thin absorber, the OEM for the linear case can be considered:
⌢
x = xa+SaKT(KSaKT+Sε)−1(y − K xa) with K =
∂y ∂x(4)
The weighting functions indicate the sensitivity of the mea-surements to a change in the vertical profile. The matrix K is determined by consecutively perturbing each layer of the a priori profile and recalculating the set of measurements us-ing the so-called forward model which describes the physics of the measurements. Here, the forward model consists in the stacked box photochemical model PSCBOX (Errera and Fonteyn, 2000; Hendrick et al., 2004) coupled to the RTM UVspec/DISORT (Mayer and Kylling, 2005). A photochem-ical model is required to reproduce the effect of the rapid variation of the BrO concentration at twilight. It also allows us to convert the retrieved profile to any SZA. The RTM is used to calculate slant column abundances from the BrO con-centrations predicted by the photochemical model. PSCBOX has been described in details in Hendrick et al. (2004). Nev-ertheless, it is useful to mention here that (1) PSCBOX is daily initialised at 20 independent altitude levels (between
∼10 and ∼55 km altitude) with 00:00 UT pressure, temper-ature, and chemical species profiles from the SLIMCAT 3-D chemical transport model (Chipperfield, 1999 and 2006; see also Sect. 7), and (2) Updated kinetic and photochemical data are taken from the JPL 2006 compilation (Sander et al., 2006). Concerning the RTM UVspec/DISORT, it includes a treatment of multiple scattering in a pseudo-spherical geom-etry approximation. The variation of the BrO concentration
100 120 140 160 180 200 220 240 2 3 4 5 6 7 8 9 Julian day BrO VCD [x10 13 molec/cm 2] 2004/SUNRISE
Daily Langley VCD AM (step1) Daily 75°SZA VCD AM (step 2)
100 120 140 160 180 200 220 240 2 3 4 5 6 7 8 9 Julian day BrO VCD [x10 13 molec/cm 2] 2004/SUNSET
Daily Langley VCD PM (step 1) Daily 75°SZA VCD PM (step 2)
Fig. 4. Example of fit results obtained in the estimation of BrO
RSCD (year 2004; upper plot for sunrise and lower plot for sunset). BrO RSCD in Eq. (3) is adjusted in order to get the best match
between BrO VCDs at 75◦SZA calculated using Eq. (1) (step 1)
and 3 (step 2). The ftropovalue is fixed to 30% and 50–80◦is the chosen SZA range for the Langley-plot analysis.
along the light-path is also taken into account since it has a large impact on the calculation of the slant column den-sities (Sinnhuber et al., 2002). The wavelength for RTM calculations was fixed to 352 nm and the ground albedo to 25%. Concerning the aerosol extinction profile, it has been constructed from the aerosol model of Shettle (1989) in-cluded in UVspec/DISORT. In the stratosphere, the aerosol settings correspond to typical background conditions while in the boundary layer and troposphere, settings representa-tive of a rural environment have been used (mixture of water soluble and dust-like aerosols). More details on the RTM UVspec/DISORT can be found in Hendrick et al. (2004) and Mayer and Kylling (2005). Both photochemical and radiative transfer models have been validated through several compar-ison exercises (Hendrick et al., 2000 and 2006; Wagner et al., 2007). Concerning the altitude grid, our retrieval is per-formed on a layer basis in the 0–90 km altitude range with a layer thickness of 2 km.
The present retrieval problem is ill-conditioned for two reasons: (1) There exists more elements in the vector x than independent measurements, and (2) the error of some compo-nents of the measurements vector y can be large enough that these components become useless (null space of the mea-surements Rodgers, 2000). Points (1) and (2) lead to the lack of a unique solution of the retrieval problem and therefore, a priori constraints are necessary to reject unrealistic pro-files that may be consistent with the measurements. In the
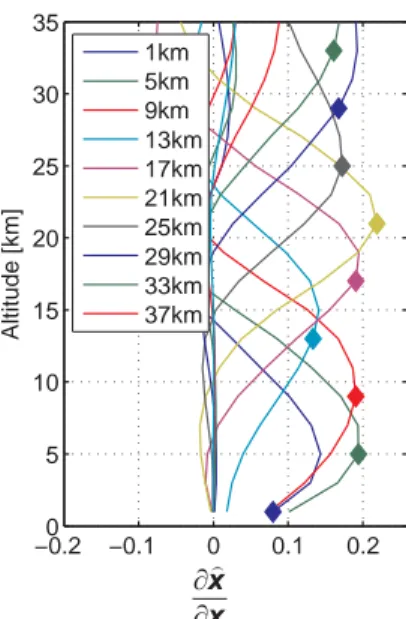
−0.20 −0.1 0 0.1 0.2 5 10 15 20 25 30 35 Altitude [km] 1km 5km 9km 13km 17km 21km 25km 29km 33km 37km x x ¶ ¶ )
Fig. 5. Typical example of ground-based BrO averaging kernels.
These were calculated for the Harestua 12 July 2004 sunrise re-trieval. Plain diamonds indicate the altitude at which each averaging kernel should peak in an ideal case.
present study, the a priori profile (defined as concentration) is constructed as follows: in the stratosphere, the output of the photochemical model PSCBOX at the SZA of the retrieval is taken as a priori. It should be noted that the BrO diurnal vari-ation is also provided as a priori informvari-ation (output of the photochemical model PSCBOX) and is not directly retrieved by the algorithm as in Schofield et al. (2004 and 2006). Due to the uncertainties on the vertical distribution and the diurnal variation of BrO in the troposphere, a constant tropospheric BrO concentration of around 1×10⁷molec/cm3is chosen for the construction of the a priori profile at local noon and the diurnal variation of this profile is assumed to be the same as the one given by the photochemical model PSCBOX in the lower stratosphere. Our approach for the construction of the a priori tropospheric profile is similar to the one used by Schofield et al. (2004).
The measurement covariance matrix Sε is constructed by placing the square of the statistical errors on the BrO DOAS fitting along its diagonal, due to the domination of the DOAS fitting residuals by the random noise of the detector. The a priori covariance matrix Sais empirically determined in or-der to ensure a good fit of the measurements without over-fitting them. An error of 85% is chosen for the stratospheric part of the a priori profile. This value is found as the thresh-old value above which undesired oscillations in the retrieved profiles can occur. In the troposphere, an error of 100% is chosen in order to reduce the weight of a priori informa-tion and therefore to give to the algorithm large freedom to move away from the a priori profile. Saalso contains extra-diagonal terms accounting for correlations between BrO
val-ues at different altitude levels. These terms were added as Gaussian functions as in Hendrick et al. (2004).
4 Characterisation of the retrievals
4.1 Information content analysis
The averaging kernel matrix A is a key parameter for the characterization of the retrievals. The averaging kernels – which are the rows of the A matrix – express the sensitiv-ity of the retrieved profile⌢x with respect to the true
atmo-spheric profile x and are derived using the following expres-sion (Rodgers, 2000): A =∂ ⌢ x ∂x =(K TS−1 ε K + S −1 a ) −1KTS−1 ε K . (5)
Typical BrO ground-based UV-visible averaging kernels are shown in Fig. 5. The FWHM of a given averaging kernel provides a rough estimate of the vertical resolution at the tar-get altitude. From the examination of the averaging kernels corresponding to several dozens of BrO retrievals, it is found that the vertical resolution is 8–10 km at best, the best res-olution being obtained below 25 km altitude. The trace of the averaging kernel matrix gives the number of degrees of freedom for the signal, which is an estimate of the number of independent pieces of information contained in the mea-surements (Rodgers, 2000). Typical values for the trace of
A are close to 3.5. That means that there are roughly 3
in-dependent pieces of information in the measurements. Fig-ures 5 also shows that the averaging kernels in the altitude range corresponding to the troposphere peak reasonably at their nominal altitude, indicating that our BrO retrievals are effectively sensitive to the troposphere.
Tests on the impact of the a priori profile on the retrieval can also give qualitative indications concerning the informa-tion content.
Two tests were performed: in the first one, the standard a priori profile was multiplied by a factor of two and in the second test, the shape of the a priori profile was modified: the standard a priori profile peaking at 15 km altitude was replaced by a new a priori profile peaking at 19 km. The results of these tests, presented in Fig. 6, show that the impact of the a priori profile is small: the profiles retrieved using the modified a priori profiles are similar to those retrieved with the standard a priori profiles. This indicates that the information on the vertical distribution of BrO contained in the measurements is significant.
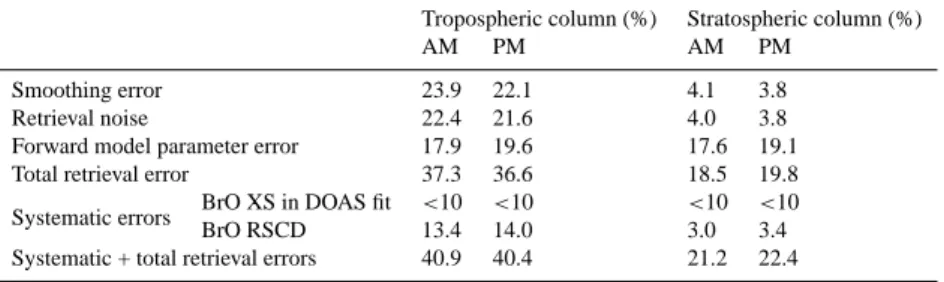
4.2 Error budget
The error analysis is performed as for the NO2 profile
re-trieval at Harestua (see Hendrick et al., 2004). In brief, the total retrieval error is given by the sum of three errors: the smoothing error, the retrieval noise, and the forward model
Table 2. Forward model parameters, their relative errors, and the corresponding forward model parameter errors averaged for the 2000–2006
period. The change in parameters followed by an asterisk (*) corresponds to their variability in March for the 2000–2004 period estimated from the output of the stacked box photochemical model PSCBOX. For the temperature, 10 K is the variability in March at 30 hPa (about 23 km of altitude) derived from the temperature profiles used to initialize both photochemical and radiative transfer models. Concerning the aerosols, 50% corresponds roughly to the estimated uncertainty in the modeled background aerosol surface area in PSCBOX. The error due to the use of a ground albedo of 0.25 is taken from Preston et al. (1997).
Parameter Model (photo- Change in Tropospheric column Stratospheric column
chemical or parameter (×1013molec/cm2) (×1013molec/cm2)
radiative) O3∗ Photochemical ±12% 0.007 0.07 O3* Radiative ±12% 0.0007 0.0001 BrONO2* Photochemical ±19% 0.07 0.29 HOBr* Photochemical ±32% 0.12 0.24 BrCl* Photochemical + 200% 0.10 0.17 Aerosols Photochemical ±50% 0.02 0.09 Aerosols Radiative ±50% 0.01 0.004 Temperature* Photochemical ±10 K 0.03 0.39 Temperature* Radiative ±10 K 0.05 0.09 Albedo Radiative + 0.45 0.13 0.04 Total 0.22 0.59
Table 3. Error budget (in %) for the retrieval of tropospheric and stratospheric BrO columns. The errors correspond to the columns retrieved
at 80◦SZA during sunrise and sunset (see Table 5 in Sect. 6). Systematic and total retrieval errors are added in quadrature in order to give the total error on the columns.
Tropospheric column (%) Stratospheric column (%)
AM PM AM PM
Smoothing error 23.9 22.1 4.1 3.8
Retrieval noise 22.4 21.6 4.0 3.8
Forward model parameter error 17.9 19.6 17.6 19.1
Total retrieval error 37.3 36.6 18.5 19.8
Systematic errors BrO XS in DOAS fit <10 <10 <10 <10
BrO RSCD 13.4 14.0 3.0 3.4
Systematic + total retrieval errors 40.9 40.4 21.2 22.4
parameter error. The smoothing error and retrieval noise are calculated from the a priori and measurement covariance ma-trices used in the retrieval (see Sect. 3). Since the photo-chemistry is fixed in our retrieval, the parameters having an impact on it should be taken into account in the estimation of the forward model parameter error. The number of for-ward model parameters is therefore significantly larger than in the case where the BrO diurnal variation is retrieved (as in Schofield et al., 2004 and 2006). The forward model pa-rameter error Sf is calculated using the following expression (Rodgers, 2000):
Sf =GKbSbKTbGT (6)
where G is the contribution functions or gain matrix, Kbis the sensitivity of the forward model to perturbations of for-ward model parameters b, and Sbis the covariance matrix of
b.
The forward model parameters b, which are used to cal-culate Kb, and their associated errors, which are used to de-rive Sb, have been selected as in Preston et al. (1997) and are listed in Table 2. The relative change in most of the se-lected parameters correspond to their variability in March for the 2000–2004 period derived from the output of the stacked box photochemical model PSCBOX (see legend of Table 2 for details). This month has been chosen because most of the parameters influencing the BrO diurnal variation show their largest variability due to the fact that Harestua can be inside, outside or at the edge of the polar vortex.
The forward model parameter errors corresponding to the different parameters b on tropospheric and stratospheric BrO columns can be derived using the column operator g (Bar-ret et al., 2003; Schofield et al., 2004). The matrix g sums over the relevant altitudes in the state vector to yield tropo-spheric and stratotropo-spheric columns. The covariance matrices
0 1 2 3 4 5 0 5 10 15 20 25 30 35
BrO conc. [x107 molec/cm3]
Altitude [km]
HARESTUA 12.07.2004 AM
std a priori retr. with std a priori std a priori x2 retr. with std a priori x2
TEST 1
0 1 2 3 4 5 0 5 10 15 20 25 30 35BrO conc. [x107 molec/cm3]
Altitude [km]
HARESTUA 10.04.2004 AM
std a priori retr. with std a priori 23/08/02 a priori retr. with 23/08/02 a priori
TEST 2
Fig. 6. Test of the impact of the a priori profile on the BrO retrievals.
In test 1 (upper plot), the standard a priori profile is multiplied by a factor of 2. In the second test (lower plot), the standard a priori profile (output of the stacked box photochemical model PSCBOX
for the 10 April 2004 at 56◦SZA AM) peaking at 15 km altitude is
replaced by a profile peaking at 19 km altitude (output of the
photo-chemical model for the 23 August 2002 at 56◦SZA AM)
Sf cassociated to the forward model parameter errors on the retrieved column quantities can be expressed as:
Sf c=g SfgT (7)
The different contributions to the forward model parameter error averaged for the 2000–2006 period are given in Ta-ble 2. Total forward model parameter errors of 0.22 and 0.59×10¹³molec/cm2are obtained for the tropospheric and stratospheric BrO columns, respectively, which correspond to about 20% of the columns retrieved at 80◦SZA for the 2000-2006 period (see Sect. 6). The smoothing error and the retrieval noise on the retrieved columns have been calculated similarly using Eq. (7) and their mean values are presented in Table 3 as well as the total retrieval error. This table gives also the systematic errors related to the uncertainties on the BrO cross-sections and BrO RSCD. The first systematic
er-70 75 80 85 90 95 0 0.5 1 1.5 2 2.5 3 3.5 4 4.5 SZA [°] BrO SCD [x10 14 molec/cm 2 ] Measurements
Calculated with a priori profile Calculated with retrieved profile
Fig. 7. Comparison between measured SCDs and those calculated
using the a priori and retrieved profiles for the Harestua 24 March 2003 sunset retrieval. The error bars on the measurements corre-spond to 1-sigma standard deviation of the statistical error from the DOAS spectral fitting with in addition, some systematic com-ponents like the error associated to the uncertainties on the cross-sections used in the DOAS analysis (main source of systematic bi-ases)
ror is taken from Theys et al. (2007) while the second one is estimated from the error on BrO RSCD given in Table 1. The total retrieval error and the systematic errors are then added in quadrature in order to give the total errors on the retrieved tropospheric and stratospheric BrO columns, which rise to about 40 and 20%, respectively.
4.3 Retrieval fit results
BrO retrievals are also quality-checked by comparing the measured SCDs to those calculated using the retrieved pro-files. Figure 7 shows an example where the retrieval fit is in good agreement with the measurements. In practice, the selection of BrO retrievals is based on the residual of the retrieval fit: all the retrievals with a residual larger than a threshold value (1×10¹³molec/cm2) are rejected. This
method of selection is roughly equivalent to a selection of clear-sky days based on the diurnal variation of O4. The
mea-sured BrO SCDs corresponding to the rejected retrievals dis-play generally a strongly unsmoothed variation during twi-light due to either a changing cloud cover or strong spec-tral interferences (e.g., O4, NO2, and Ring interferences).
Retrieval residuals larger than the threshold value are often observed in fall and winter. There are several possible rea-sons to explain this feature: (1) The probability for having a
changing cloud cover over Harestua is larger during this pe-riod. (2) Photochemical conditions can also change rapidly due to dynamical effects (Harestua is often close to or at the vortex edge) and therefore providing the BrO diurnal varia-tion as an a priori informavaria-tion as in our profiling algorithm (see Sect. 3) could be a limitation and lead to high retrieval residuals. (3) During this period, the SZA range correspond-ing to the BrO SCD is smaller (SZA at local noon can reach 84◦ at Harestua) and therefore the information content of the measurements is somewhat lower than during summer. For these reasons, we have decided to retrieve BrO profiles only from the ground-based DOAS measurements performed from mid-February to the end of October.
5 Verification of the retrievals
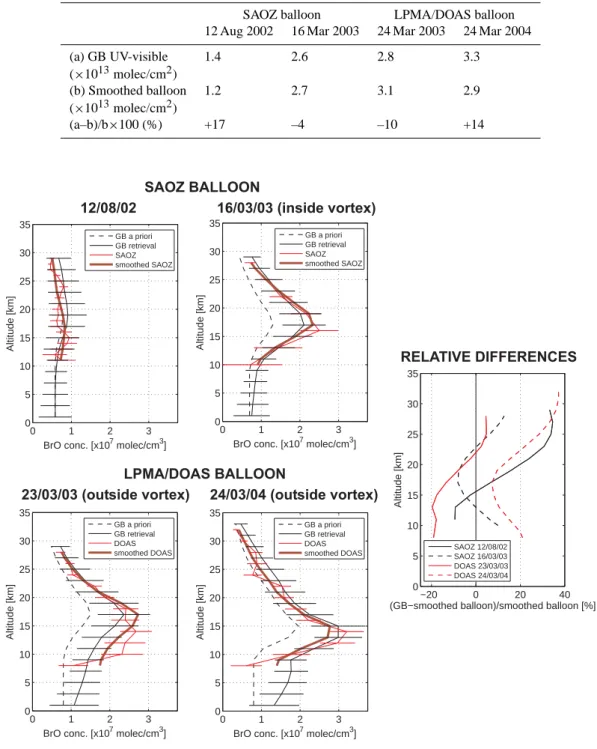
The consistency between our BrO profile retrievals and correlative data has been verified. For this purpose, the stratospheric part of the retrieved profiles is compared to SAOZ and LPMA/DOAS balloon profiles and the total BrO columns integrated from the retrieved profiles to GOME and SCIAMACHY nadir observations.
5.1 Comparison to SAOZ and LPMA/DOAS balloon pro-files
The SAOZ-BrO balloon experiment is designed for mea-suring BrO by solar occultation in the 320–400 nm spectral range during the afternoon ascent and from float at about 30 km (solar occultation). The spectral data are analyzed by the DOAS method and profile retrievals are performed us-ing the onion peelus-ing technique. The BrO fittus-ing window is fixed to 332–370 nm. More details on the instrument and the retrieval algorithm can be found in Pundt et al. (2002) and Dorf et al. (2006b).
As for the SAOZ balloon, the LPMA/DOAS balloon uses the solar occultation technique. The LPMA/DOAS payload consists of three spectrometers (two grating and one FT) en-abling the analysis of direct sunlight from the UV to the mid-IR. The BrO DOAS evaluation is performed in the 346– 360 nm wavelength range and vertical profiles are retrieved using the OEM. A detailed description of the LPMA/DOAS BrO measurements can be found in Harder et al. (1998 and 2000) and Dorf et al. (2006b).
For the present comparisons, all the SAOZ and DOAS bal-loon flights originated from Kiruna (68◦N, 21◦E) in Sweden and only ascent data are taken into account. The selected flights are the following: 12 August 2002 and 16 March 2003 for SAOZ and 23 March 2003 and 24 March 2004 for LPMA/DOAS. It should be noted that for comparison in March, an examination of the potential vorticity (PV) maps at 475 K show that the Harestua and Kiruna stations are in-side the polar vortex on 16 March 2003 and outin-side on 23 March 2003 and 24 March 2004. Ground-based BrO
pro-files are retrieved at 87◦SZA (SAOZ 12 August 2002), 86◦ SZA (SAOZ 16 March 2003), and 80◦SZA (LPMA/DOAS 23 March 2003 and 24 March 2004). These SZA values are reached when the balloons are at an altitude of about 20 km. Due to the variation of the SZA during the ascent of the balloon, a photochemical correction, calculated by using the photochemical model PSCBOX, is applied to the ground-based profiles in order to take into account this photochemi-cal effect.
Since ground-based and balloon profiles have a signifi-cantly different vertical resolution (about 1 km and 8–10 km for balloon and ground-based profiles, respectively), the bal-loon profiles have to be degraded to the vertical resolution of the ground-based retrievals in order to allow direct compari-son (Hendrick et al., 2004). This is done by convolving the balloon profiles with the ground-based averaging kernels us-ing the followus-ing expression (Connor et al., 2004; Hendrick et al., 2004):
xsb=xa+A(xb−xa). (8)
where A is the ground-based averaging kernel matrix, xais the a priori profile used in the ground-based retrieval, xbis the balloon profile, and xsbis the smoothed or convolved bal-loon profile and represents what the retrieval should produce assuming that xb is the true profile and that the only source of error is the smoothing error.
The results of the comparisons between ground-based BrO retrievals and SAOZ and LPMA/DOAS balloon profiles are shown in Fig. 8. Concerning the comparisons with SAOZ balloon profiles, a good agreement is obtained on 16 March 2003 with a relative difference smaller than 12% over the en-tire 10–28 km altitude range. For the 12 August 2002 case, the ground-based retrieval overestimates the SAOZ profile in the 17–29 km altitude range, with a maximum relative dif-ference value of 35% obtained around 25 km altitude. How-ever, the observed differences are within the error bars of the ground-based profile. Concerning the comparison with the LPMA/DOAS balloon profile on 23 March 2003, an under-estimation of about 20% by the ground-based retrieval occurs between 8 and 15 km altitude, both profiles differing by less than 10% (in absolute value) above 18 km. In case of the 24 March 2004 comparison, the ground-based BrO retrieval systematically overestimates the LPMA/DOAS profile in the entire 8–32 km altitude range, with relative difference values between 7 and 21% in the 8–21 km altitude range and be-tween 21 and 37% above 21 km. However, the observed dif-ferences are again within the error bars of the ground-based profile.
The 11–28 km BrO partial column amounts calculated by integrating the ground-based and smoothed SAOZ and LPMA/DOAS balloon profiles have been also compared. The partial column amounts and relative differences are pre-sented in Table 4. The comparison gives a satisfying agree-ment, with partial column values differing respectively by +17% (SAOZ 12 August 2002), –4% (SAOZ 16 March
Table 4. 11–28 km BrO partial column values calculated from ground-based UV-visible BrO profiles retrieved at Harestua and smoothed
SAOZ and LPMA/DOAS balloon profiles. Both SAOZ and LPMA/DOAS balloons were launched from Kiruna in Sweden. The relative differences in % appear in the third row.
SAOZ balloon LPMA/DOAS balloon
12 Aug 2002 16 Mar 2003 24 Mar 2003 24 Mar 2004
(a) GB UV-visible 1.4 2.6 2.8 3.3 (×1013molec/cm2) (b) Smoothed balloon 1.2 2.7 3.1 2.9 (×1013molec/cm2) (a–b)/b×100 (%) +17 –4 –10 +14 −20 0 20 40 0 5 10 15 20 25 30 35
(GB−smoothed balloon)/smoothed balloon [%]
Altitude [km] SAOZ 12/08/02 SAOZ 16/03/03 DOAS 24/03/03 DOAS 24/03/04 RELATIVE DIFFERENCES 3 0 1 2 3 0 5 10 15 20 25 30 35
BrO conc. [x107 molec/cm3]
Altitude [km] GB a priori GB retrieval SAOZ smoothed SAOZ 0 1 2 3 0 5 10 15 20 25 30 35
BrO conc. [x107 molec/cm3]
Altitude [km] GB a priori GB retrieval SAOZ smoothed SAOZ SAOZ BALLOON 12/08/02 16/03/03 (inside vortex) 0 1 2 3 0 5 10 15 20 25 30 35
BrO conc. [x107 molec/cm3]
Altitude [km] GB a priori GB retrieval DOAS smoothed DOAS 0 1 2 3 0 5 10 15 20 25 30 35
BrO conc. [x107 molec/cm3]
Altitude [km] GB a priori GB retrieval DOAS smoothed DOAS LPMA/DOAS BALLOON
23/03/03 (outside vortex) 24/03/04 (outside vortex)
Fig. 8. Comparison between ground-based UV-visible BrO profiles at Harestua and SAOZ and LPMA/DOAS ascent balloon BrO profiles.
All balloon flights originated from Kiruna, Sweden. For direct comparison, balloon profiles have been smoothed by convolving them with the ground-based UV-visible averaging kernels. The relative differences between ground-based retrievals and smoothed balloon profiles appear in the right plot.
2003), –10% (LPMA/DOAS 23 March 2003), and +14% (LPMA/DOAS 24 March 2004). The overall conclusion of these comparisons (profiles and partial columns) is that the
stratospheric part of the ground-based BrO profiles shows a good consistency with SAOZ and LPMA/DOAS balloon profiles.
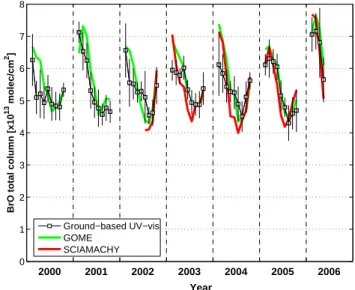
5.2 Comparison to GOME and SCIAMACHY nadir obser-vations
GOME (Global Ozone Monitoring Experiment) is a nadir-viewing spectrometer that measures solar radiation back-scattered from the atmosphere in the 240–790 nm wave-length range (Burrows et al., 1999). The instrument, aboard the ESA/ERS-2 satellite launched in April 1995, flies in a sun-synchronous orbit at an altitude of 780 km with a local crossing time at the Equator of about 10:30 LT. The mea-sured nadir radiances are analysed using the DOAS tech-nique. The GOME BrO data used for the verification of the ground-based BrO retrievals are the total columns retrieved by the scientific (“non-operational”) spectral inversion algo-rithm developed at IASB-BIRA. The DOAS settings follow the recommendations of Aliwell et al. (2002) including a wavelength range from 345 to 359 nm and BrO absorption cross-sections from Wilmouth et al. (1999). A detailed de-scription of the inversion algorithm and DOAS settings can be found in Van Roozendael et al. (1999) and at the following web page: http://www.oma.be/BIRA-IASB/Molecules/BrO/ Documents/BIRA SCIA BrO ADD v1r1.pdf.
SCIAMACHY (SCanning Imaging Absorption spectroM-eter for Atmospheric CHartographY) is the successor of GOME and was launched in March 2002 aboard the ESA/ENVISAT platform. As for ERS-2, ENVISAT flies in a sun-synchronous orbit and the local crossing time at the Equator is about 10:00 LT. The SCIAMACHY imag-ing spectrometer measures the solar radiation transmitted, back-scattered and reflected from the atmosphere in the 240– 2400 nm wavelength range and in three different viewing geometries: nadir, limb, and sun/moon occultations, which yield total column values as well as vertical profiles. As for GOME, the nadir radiances are analysed using the scientific DOAS algorithm developed at IASB-BIRA. The settings are similar to those used for GOME except the wavelength range which is now 336–347 nm. The main reason for this is the presence of a strong anomaly of the polarization response of the SCIAMACHY instrument centered in the middle of the wavelength interval used for BrO retrieval from GOME (346–359 nm). Due to this change in the BrO fitting win-dow, the BrO absorption cross-sections set is taken here from Wahner et al. (1988). Because reliable SCIAMACHY solar spectra were unavailable during the first year of measure-ments, an earthshine radiance selected daily around Equa-tor is used as control spectrum for the BrO slant column re-trieval. The corresponding equatorial offset is assumed to be 7.5×10¹³molec/cm2, which is in good consistency with test BrO retrievals made around the Equator using daily sun reference spectra (see also Theys et al., 2007). More de-tails on the IASB-BIRA SCIAMACHY total BrO columns can be found at http://www.oma.be/BIRA-IASB/Molecules/ BrO/Documents/BIRA SCIA BrO ADD v1r1.pdf.
Air mass factors (AMFs) are needed to convert the GOME and SCIAMACHY nadir BrO slant column densities, which
0 1 2 3 4 5 6 7 8
BrO total column [x10
13 molec/cm 2] 2000 2001 2002 2003 2004 2005 2006 Year Ground−based UV−vis GOME SCIAMACHY
Fig. 9. Comparison between ground-based UV-vis, GOME, and
SCIAMACHY nadir total BrO columns (monthly means). Ground-based VCDs have been calculated by integrating the retrieved BrO profiles. The error bars on the ground-based BrO VCDs correspond to the BrO VCDs natural variability (1-sigma standard deviation).
are the direct product of the DOAS analysis, into vertical columns. AMFs are calculated using the UVspec/DISORT RTM accounting for the SZA as well as the line-of-sight angle of the GOME and SCIAMACHY nadir observations. The ground-based BrO profiles retrieved at the SZA corre-sponding to the satellites overpass time (about 10:30 LT) are also provided as input to the RTM in order to properly take into account the tropospheric contribution to the total BrO columns in the AMF calculation.
Monthly means of ground-based UV-visible, GOME, and SCIAMACHY nadir total BrO columns for the 2000–2006 period are presented in Fig. 9. Mean GOME and SCIA-MACHY BrO column amounts are calculated using all pixels falling within a radius of 200 km around Harestua. Ground-based UV-visible retrievals show good consistency with both satellite measurements in terms of seasonal variation and inter-annual variability. More quantitatively, a good agree-ment is observed between ground-based and GOME total BrO columns with a relative difference generally below 15% (in absolute values), the largest discrepancy being obtained in spring 2000 with ground-based columns 20% smaller than those from GOME. A similar agreement is observed with SCIAMACHY nadir columns except in summer where SCIAMACHY tends to give systematically lower column values than both ground-based and GOME data.
6 Tropospheric and stratospheric BrO columns
Tropospheric and stratospheric BrO columns are calculated by integrating the retrieved profiles in the appropriate altitude
Table 5. Mean tropospheric column values at 80◦SZA obtained for late winter/early spring (15 February–30 April), late spring/summer (1 May–15 August), and late summer/early fall (16 August–15 October) conditions during the 2000–2006 period. Mean columns and their
corresponding 1-sigma standard deviation (values given between brackets) are in units of × 1013molec/cm2and pptv. Values in italic are
the number of measurement days taken into account for the calculation of the mean. Tropospheric BrO column
15/02→30/04 01/05→15/08 16/08→15/10
(×1013molec/cm2) (pptv) (×1013molec/cm2) (pptv) (×1013molec/cm2) (pptv)
80◦SZA am 1.72 (0.60) 1.1 (0.4) 0.92 (0.32) 0.6 (0.2) 1.05 (0.38) 0.7 (0.2)
(208 days) (322 days) (138 days)
80◦SZA pm 1.41 (0.42) 0.9 (0.3) 0.93 (0.31) 0.6 (0.2) 1.01 (0.37) 0.6 (0.2)
(393 days) (391 days) (225 days)
80◦SZA am & pm 1.52 (0.51) 1.0 (0.3) 0.92 (0.31) 0.6 (0.2) 1.03 (0.37) 0.6 (0.2) 80°SZA SUNRISE BrO VCD [x10 13 molec/cm 2] 2000 2001 2002 2003 2004 2005 2006 0 2 4 6 8 Stratospheric BrO VCD Tropospheric BrO VCD 80°SZA SUNSET BrO VCD [x10 13 molec/cm 2] 2000 2001 2002 2003 2004 2005 2006 0 2 4 6 8 Stratospheric BrO VCD Tropospheric BrO VCD
Fig. 10. Stratospheric and tropospheric BrO columns calculated
from profiles retrieved at 80◦SZA sunrise (upper plot) and sunset
(lower plot) for the 2000–2006 period.
ranges. For each day, the tropopause height is estimated us-ing NCEP pressure and temperature profiles and by adoptus-ing the WMO definition of the tropopause: height of the base of a layer at least 2 km thick, in which the rate of decrease of temperature with height is less than 2 K/km.
Tropospheric and stratospheric BrO columns correspond-ing to 80◦ SZA sunrise and sunset for the 2000–2006 pe-riod are shown in Fig. 10. Both tropospheric and strato-spheric columns display a marked seasonality with larger column values in late winter/early spring and fall than in summer (U-shape). Tropospheric BrO columns aver-aged for late winter/early spring (15 February–30 April), late spring/summer (1 May–15 August), and late summer/early
fall (16 August–15 October) conditions are presented in Ta-ble 5. In late winter/early spring, the mean tropospheric BrO column is slightly larger at sunrise than at sunset with values of 1.72±0.60 and 1.41±0.42×10¹³molec/cm2, respectively. Assuming that BrO is uniformly mixed in the troposphere, these column values correspond to volume mixing ratios of 1.1±0.4 and 0.9±0.3 pptv, respectively. The errors on the columns given here correspond to their natural variability (1-sigma standard deviation) but it should be noted that the error budget described in Sect. 4.2 gives slightly larger er-ror values (∼40% of the tropospheric columns).Smaller col-umn amounts are obtained in both late spring/summer and late summer/early fall, with values of about 0.92±0.31 and 1.03±0.37×10¹³molec/cm2, respectively (both correspond-ing to a BrO volume mixcorrespond-ing ratio of 0.6±0.2 pptv). For these periods, column amounts are similar at sunrise and sunset.
Our estimates of the tropospheric BrO column amount show a good consistency with previously published stud-ies. Harder et al. (1998 and 2000), Richter et al. (2002) and Van Roozendael et al. (2002) found that BrO mea-surements from the GOME satellite instrument are consis-tent with a tropospheric BrO column ranging from 1 to 4×10¹³molec/cm2. Using the GOME successor SCIA-MACHY, Sinnhuber et al. (2005) have suggested that the average global tropospheric BrO column below 15 km alti-tude is about 2–4×10¹³molec/cm2. Balloon DOAS mea-surements performed by Fitzenberger et al. (2000) revealed that the tropospheric BrO amount could range from 0.6 to 3.7×10¹³molec/cm2. Tropospheric BrO columns have been also estimated using ground-based DOAS observations. Schofield et al. (2004 and 2006) found “background” tropo-spheric column values lower than the other estimates (about 0.2–0.3×10¹³ molec/cm2) using combined zenith-sky and
direct sun DOAS measurements in Lauder (45◦S) and Ar-rival Heights (78◦S). In contrast, Theys et al. (2007) inferred tropospheric BrO columns of about 1.1×10¹³ molec/cm2 from ground-based MAX-DOAS measurements in Reunion Island (21◦S), consistent with the abovementioned satellite
and balloon estimates and with our tropospheric columns re-trieved at Harestua in late spring/summer. Also from ground-based MAX-DOAS measurements in the tropics (Nairobi, 1◦S), Fietkau et al. (2007) have derived slightly lower tropo-spheric BrO column amounts, in the range of 0.4–0.75×10¹³ molec/cm2.
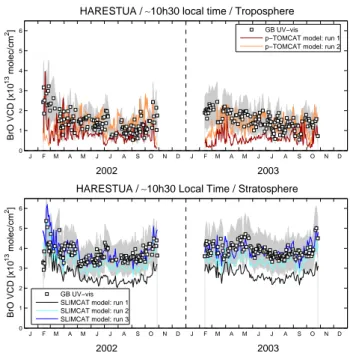
7 Comparison to model calculations
Stratospheric and tropospheric BrO columns calculated from profiles retrieved at the GOME overpass time (∼10:30 LT) are compared to the SLIMCAT stratospheric and p-TOMCAT tropospheric chemical transport models (CTMs), respectively. At Harestua, 10:30 LT corresponds to about 74◦ SZA in mid-February and 39◦ SZA in mid-June. It should be noted that the choice of the GOME overpass time for the comparison (and not 80◦SZA as in Sect. 6) allows us to avoid having to interpolate through the output values of the tropo-spheric CTM (see below).
The p-TOMCAT (parallel-Tropospheric Off-Line Model of Chemistry and Transport) model is an off-line three-dimensional tropospheric CTM with a detailed bromine chemistry scheme that contains gas-phase reactions and het-erogeneous reactions on cloud particles and aerosols. It in-cludes bromine emissions from sea salt and bromocarbon photo-oxidation as well as bromine removal from dry and wet deposition (see Yang et al., 2005 for a detailed descrip-tion of this version of p-TOMCAT). For the present study, the model was run for the years 2002 and 2003 at a horizon-tal spatial resolution of 5.6◦×5.6◦on 31 levels from the sur-face up to 10 hPa using winds and temperature derived from the ECMWF (European Centre for Medium-Range Weather Forecasts) operational analysis. The output frequency is fixed to 2 h from 00:00 UT and the model output at 10:00 UT (∼10:45 LT) is used for the comparison. The tropospheric BrO column amounts are linearly interpolated from the clos-est model grids to Harclos-estua, centered at 63.68◦N, 11.25◦E and 58.14◦N, 11.25◦E. Concerning bromine emission from sea salt, the scenario used for sea-salt production is called SMI and involves particles with dry radii between 0.1 and 10 µm (Yang et al., 2005). Two different model runs are con-sidered in our study: run 1 (standard run) and run 2 which includes the HBr + HOBr reaction on aerosols since this re-action can be important in the troposphere and may increase the BrO level. It should be noted that the current version of the p-TOMCAT model does not include bromine emission from sea-ice (snowpack and frost flowers), which is likely to be an important bromine source in the polar region (e.g., Kaleschke et al., 2004; Simpson et al., 2005).
For the stratosphere, we use the SLIMCAT 3D-CTM (Chipperfield, 1999 and 2006), and more particularly run D from this model (Feng et al., 2007). In this run, the CTM was integrated with a horizontal resolution of 7.5◦×7.5◦on 24 levels from the surface to about 55 km altitude. The
HARESTUA / ∼10h30 Local Time / Stratosphere
BrO VCD [x10 13 molec/cm 2] 2002 2003 J F0 M A M J J A S O N D J F M A M J J A S O N D 1 2 3 4 5 6 GB UV−vis SLIMCAT model: run 1 SLIMCAT model: run 2 SLIMCAT model: run 3
HARESTUA / ∼10h30 local time / Troposphere
BrO VCD [x10 13 molec/cm 2] 2002 2003 J F0 M A M J J A S O N D J F M A M J J A S O N D 1 2 3 4 5 6 GB UV−vis
p−TOMCAT model: run 1 p−TOMCAT model: run 2
Fig. 11. Comparison between ground-based UV-visible and
mod-eled tropospheric and stratospheric BrO columns for the 2002–2003 period. Tropospheric and stratospheric BrO columns are simulated using the p-TOMCAT and SLIMCAT 3D CTMs, respectively. In case of the p-TOMCAT model, two runs are considered: run 1 with SMI scenario for sea-salt production; run 2 with the same SMI sce-nario but including the HOBr + HBr reaction on aerosols. In the SLIMCAT model case, three runs are considered: run 1 (standard run), and runs 2 and 3 with respectively 6 and 8 pptv accounting for VSLS and added directly to the SLIMCAT long-lived bromine source gases profile (see Fig. 12 for a plot of the different Bry pro-files). The grey-shaded area indicates the error on the ground-based columns.
model was forced using ECMWF analyses and the sim-ulation started on 1 January 1977. The halogen loading was specified from observed tropospheric CH3Br and halons
(WMO, 2003) with an additional 6 pptv contribution from very short-lived species (VSLS), added by an empirical scal-ing of CH3Br. Accordingly, the total stratospheric bromine
loading around 2002 is 21.2 pptv. Output was saved at 00:00 UT every two days and linearly interpolated at the lo-cation of Harestua. This output served as input to our stacked box photochemical model PSCBOX in order to calculate the stratospheric BrO profile corresponding to 10:30 LT.
The comparison between ground-based and modeled BrO columns is presented in Fig. 11 for the 2002–2003 period. Concerning the stratosphere, the model run used significantly underestimates (by maximum 30%) the ground-based UV-visible columns. This feature can be partly explained by the fact that in this model run, CH3Br is scaled in order
to represent all bromine source gases, including short-lived sources. Since these source gases are decomposed faster than methyl bromide, this can lead to an underestimation of the
0 5 10 15 20 25 10 15 20 25 30 35 Br y VMR [pptv] Altitude [km] SLIMCAT Scaled SLIMCAT Scaled SLIMCAT + 6 pptv Scaled SLIMCAT + 8 pptv
Fig. 12. Bryprofiles used in the comparison between the ground-based stratospheric BrO column amounts and the SLIMCAT model.
Bryvolume mixing ratio in the lower stratosphere and
there-fore of the integrated BrO vertical column. As in Theys et al. (2007), this effect is investigated by considering the case where the short-lived species are totally converted to Bryat
the tropopause. In order to achieve that, we have applied an offset of 6 and 8 pptv directly to the SLIMCAT Bry
pro-file scaled by the ratio between the contribution of long-lived bromine sources (15 pptv) and the total bromine loading as-sumed in SLIMCAT (21.2 pptv). The different Bryprofiles
are plotted in Fig. 12. We see from Fig. 11 that with a contri-bution of 6 pptv from VSLS, modeled columns are within the error bars associated to the ground-based columns but still underestimate them. A good quantitative agreement is ob-tained when a contribution of 8 pptv from VSLS is assumed in the model. These results are in good consistency with pre-vious studies (Pfeilsticker et al., 2000; Salawitch, 2005; Dorf et al., 2006a). This also confirms the findings of Feng et al. (2007), who have tested different methods of implement-ing the bromine source gases in the SLIMCAT model and found that the agreement between model and balloon data is significantly improved when accounting explicitly for the short-lived source gases.
Concerning the troposphere, run 1 of the p-TOMCAT model systematically underestimates the ground-based BrO columns (with differences sometimes larger than 50%). Us-ing run 2 (also with SMI scenario for sea-salt production but including HOBr + HBr reaction on aerosols), the agree-ment is greatly improved except in February and March where a significant underestimation by the model still per-sists. The non-inclusion in the current version of the model of bromine emissions from frost flowers and snowpack might possibly explain this feature since during this period, air
masses with enhanced BrO concentration due to bromine ex-plosion events could be transported from the polar region to Harestua. Finally, Fig. 11 also shows that the p-TOMCAT model reproduces reasonably well some of the short-term variations in the ground-based BrO columns, especially in 2003.
8 Conclusions
BrO vertical profiles have been retrieved using ground-based zenith-sky DOAS observations performed at the NDACC sta-tion of Harestua (60◦N, 11◦E) during the 2000–2006 pe-riod. The sensitivity to the tropospheric detection of BrO
by zenith-sky UV-visible observations has been increased by choosing for each year a fixed noon summer reference spec-trum for the DOAS analysis. The consistency between our BrOprofile retrievals and correlative data have been verified
and a good agreement has been obtained with SAOZ and LPMA/DOAS balloon profiles (stratospheric part of the re-trieved profiles) and with GOME and SCIAMACHY nadir observations (total columns integrated from the retrieved profiles). The error budget and the information content re-lated to the retrievals have been also carefully characterized and the impact of the a priori profile on the retrievals has been investigated.
Tropospheric BrO column amounts integrated from the
profiles retrieved at 80◦ SZA and averaged for the 2000– 2006 period range from 1.52±0.62×10¹³molec/cm2in late winter/early spring to 0.92±0.38×10¹³molec/cm2 in sum-mer. Assuming that BrO is uniformly mixed in the tropo-sphere, these values correspond to 1.0±0.4 and 0.6±0.2 pptv, respectively, and are consistent with previously published es-timates inferred from balloon, satellite, and ground-based UV-vis observations. Daytime (10:30 LT) tropospheric and stratospheric BrO columns have been also compared to the
p-TOMCAT and SLIMCAT 3-D CTMs for the 2002–2003
period. In case of the p-TOMCAT model, two different runs have been considered: run 1 with SMI scenario for sea-salt production and run 2 with the same SMI scenario but includ-ing the HOBr + HBr reaction on aerosols. Run 1 system-atically underestimates the observations while run 2 shows a good quantitative agreement with the ground-based tropo-spheric columns and reproduces well some of their short-term variations, especially in 2003. However, a system-atic underestimation is obtained in February–March. The non-inclusion in the current version of p-TOMCAT of frost flowers and snowpack as bromine sources could explain this finding. In the stratosphere, the retrieved ground-based BrO
columns have been compared to the SLIMCAT model. The model run used significantly underestimates the retrieved BrO columns. This finding can be partly explained by the
fact that in this model run, CH3Br is scaled in order to
repre-sent all bromine source gases, including short-lived sources. Since these source gases are decomposed faster than methyl
bromide, this can lead to an underestimation of the Bry
vol-ume mixing ratio in the lower stratosphere and therefore of the integrated BrO vertical column. We have shown that a good quantitative agreement can be obtained if 6 to 8 pptv, accounting for very short-lived bromine species, are added directly to the SLIMCAT long-lived bromine source gases profile, which is equivalent to assume that the short-lived species are totally converted to Bryat the tropopause. This
contribution of 6 to 8 pptv from VSLS to the total bromine loading is consistent with recently published studies (e.g., WMO 2007).
Acknowledgements. This research was financially supported by the Belgian Prodex NOy-Bry.
Edited by: R. von Glasow
References
Aliwell, S. R., Van Roozendael, M., Johnston, P. V., Richter, A., Wagner, T., Arlander, D. W., Burrows, J. P., Fish, D. J., Jones, R. L., Tørnkvist, K. K., Lambert, J.-C., Pfeilsticker, K., and Pundt,
I.: Analysis for BrOin zenith-sky spectra: An intercomparison
exercise for analysis improvement, J. Geophys. Res., 107(D14), 4199, doi:10.1029/2001JD000329, 2002.
Barret, B., De Mazi`ere, M., and Mahieu, E.: Ground-based FTIR measurements of CO from the Jungfraujoch : characterisation and comparison with in situ surface and MOPITT data, Atmos. Chem. Phys., 3, 2217–2223, 2003,
http://www.atmos-chem-phys.net/3/2217/2003/.
Bobrowski, N., H¨onninger, G., Galle, B., and Platt, U.: Detection of bromine monoxide in a volcanic plume, Nature, 423, 273–276, 2003.
Brewer, A. W., McElroy, C. T., and Kerr, J. B.: Nitrogen dioxide concentration in the atmosphere, Nature, 246, 129–133, 1973. Burrows, J. P., Weber, M., Buchwitz, M., Rozanov, V.V.,
Ladst¨adter-Weissenmayer, A., Richter, A., de Beek, R., Hoogen, R., Bramstedt, K., Eichmann, K.-U., Eisinger, M., and Perner, D.: The Global Ozone Monitoring Experiment (GOME): Mis-sion concept and first scientific results, J. Atm. Sci., 56, 151–175, 1999.
Chipperfield, M. P. and Pyle, J. A.: Model sensitivity studies of arc-tic ozone depletion, J. Geophys. Res., 103(D21), 28 389–28 403, 1998.
Chipperfield, M. P.: Multiannual simulations with a
three-dimensional chemical transport model, J. Geophys. Res., 104(D1), 1781–1805, 1999.
Chipperfield, M. P.: New version of the TOMCAT/SLIMCAT off-line chemical transport model: Intercomparison of stratospheric tracer experiments, Q. J. R. Meteorol. Soc., 132, 1179–1203, doi:10.1256/qj.05.51, 2006.
Connor, B. J., Siskind, D. E., Tsou, J. J., Parrish, A., and Remsberg, E. E.: Ground-based microwave observations of ozone in the upper stratosphere and mesosphere, J. Geophys. Res., 99(D8), 16 757–16 770, 1994.
Denis, L., Roscoe, H. K., Chipperfield, M. P., Van Roozendael,
M., and Goutail, F.: A new software for NO2 vertical profile
retrieval from ground-based zenith-sky spectrometers, J. Quant. Spectrosc. Radiat. Transfer, 92, 321–333, 2005.
Dorf, M., Butler, J. H., Butz, A., Camy-Peyret, C., Chipperfield, M. P., Kritten, L., Montzka, S. A., Simmes, B., Weidner, F., and Pfeilsticker, K.: Observations of long-term trend in stratospheric bromine reveal slow down in growth, Geophys. Res, Lett., 33, L24803, doi:10.1029/2006GL027714, 2006a.
Dorf, M., B¨osch, H., Butz, A., Camy-Peyret, C., Chipperfield, M. P., Goutail, F., Grunow, K., Hendrick, F., Hrechanyy, S., Naujokat, B., Pommereau, J.-P., Van Roozendael, M., Sioris,
C., Stroh, F., Weidner, F., and Pfeilsticker, K.:
Balloon-borne stratospheric BrO measurements: Comparison with En-visat/SCIAMACHY BrO limb profiles, Atmos. Chem. Phys., 6, 2483–2501, 2006b.
Errera, Q. and Fonteyn, D.: Four-dimensional variational chemi-cal assimilation of CRISTA stratospheric measurements, J. Geo-phys. Res., 106(D11), 12 253–12 265, 2001.
Feng, W., Chipperfield, M. P., Dorf, M., and Pfeilsticker, K., Mid-latitude ozone changes: studies with a 3-D CTM forced by ERA-40 analyses, Atmos. Chem. Phys., 7, 2357–2369, 2007, http://www.atmos-chem-phys.net/7/2357/2007/.
Fietkau, S., Medeke, T., Richter, A., Sheode, N., Sinnhuber, B.-M., Wittrock, F., Theys, N., Van Roozendael, M., and Burrows, J. P.: Ground-based measurements of tropospheric and stratospheric
Bromine monoxide above Nairobi (1◦S, 36◦E), Atmos. Chem.
Phys. Discuss., 7, 6527–6555, 2007,
http://www.atmos-chem-phys-discuss.net/7/6527/2007/. Fitzenberger, R., B¨osch, H., Camy-Peyret, C., Chipperfield, M.P.,
Harder, H., Platt, U., Sinnhuber, B.-M., Wagner, T., and Pfeil-sticker, K.: First profile measurements of tropospheric BrO, Geo-phys. Res. Lett., 27, 2921–2924, 2000.
Frieß, U., Hoowedel, J., K¨onig-Langlo, G., Wagner, T., and Platt, U., Dynamics and chemistry of tropospheric bromine explosion events in the Antarctic coastal region, J. Geophys. Res., 109, D06305, doi:10.1029/2003JD004133, 2004.
Frieß, U., Monks, P. S., Remedios, J. J., Rozanov, A.,
Sinre-ich, R., Wagner, T., and Platt, U.: MAX-DOAS O4
measure-ments: A new technique to derive information on atmospheric aerosols: 2. Modeling studies, J. Geophys. Res., 111, D14203, doi:10.1029/2005JD006618, 2006.
Harder, H., Camy-Peyret, C., Ferlemann, F., Fitzenberger, R., Hawat, T., Osterkamp, H., Perner, D., Platt, U., Schneider, M., Vradelis, P., and Pfeilsticker, K.: Stratospheric BrO profiles mea-sured at different latitudes and seasons: Atmospheric observa-tions, Geophys. Res. Lett., 25, 3843–3846, 1998.
Harder, H., B¨osch, H., Camy-Peyret, C., Chipperfield, M., Fitzen-berger, R., Payan, S., Perner, D., Platt, U., Sinnhuber, B.-M., and Pfeilsticker, K.: Comparison of measured and modeled strato-spheric BrO: Implications for the total amount of stratostrato-spheric bromine, Geophys. Res. Lett., 27 , 3695–3698, 2000.
Hebestreit, K., Stutz, J., Rosen, D., Matveeiv, V., Peleg, M., Luria, M., and Platt, U.: DOAS measurements of tropospheric bromine oxide in mid-latitudes, Science, 283, 55–57, 1999.
Hendrick, F., Mueller, R., Sinnhuber, B.-M., Bruns, M., Burrows, J. P., Chipperfield, M. P., Fonteyn, D., Richter, A., Van Roozen-dael, M., and Wittrock, F.: Simulation of BrO diurnal variation and BrO slant columns : Intercomparison exercise between three model packages, Proceedings of the 5th European Workshop on Stratospheric Ozone, Saint Jean de Luz, France, 27 Sept–1 Oct