HAL Id: hal-00301744
https://hal.archives-ouvertes.fr/hal-00301744
Submitted on 2 Sep 2005HAL is a multi-disciplinary open access
archive for the deposit and dissemination of sci-entific research documents, whether they are pub-lished or not. The documents may come from teaching and research institutions in France or abroad, or from public or private research centers.
L’archive ouverte pluridisciplinaire HAL, est destinée au dépôt et à la diffusion de documents scientifiques de niveau recherche, publiés ou non, émanant des établissements d’enseignement et de recherche français ou étrangers, des laboratoires publics ou privés.
Intercomparison exercise between different radiative
transfer models used for the interpretation of
ground-based zenith-sky and multi-axis DOAS
observations
F. Hendrick, M. van Roozendael, A. Kylling, A. Petritoli, A. Rozanov, S.
Sanghavi, R. Schofield, C. von Friedeburg, T. Wagner, F. Wittrock, et al.
To cite this version:
F. Hendrick, M. van Roozendael, A. Kylling, A. Petritoli, A. Rozanov, et al.. Intercomparison exer-cise between different radiative transfer models used for the interpretation of ground-based zenith-sky and multi-axis DOAS observations. Atmospheric Chemistry and Physics Discussions, European Geo-sciences Union, 2005, 5 (5), pp.7929-7964. �hal-00301744�
ACPD
5, 7929–7964, 2005 Intercomparison exercise between radiative transfer models F. Hendrick et al. Title Page Abstract Introduction Conclusions References Tables Figures J I J I Back CloseFull Screen / Esc
Print Version Interactive Discussion
EGU
Atmos. Chem. Phys. Discuss., 5, 7929–7964, 2005 www.atmos-chem-phys.org/acpd/5/7929/
SRef-ID: 1680-7375/acpd/2005-5-7929 European Geosciences Union
Atmospheric Chemistry and Physics Discussions
Intercomparison exercise between
di
fferent radiative transfer models used
for the interpretation of ground-based
zenith-sky and multi-axis DOAS
observations
F. Hendrick1, M. Van Roozendael1, A. Kylling2,*, A. Petritoli3, A. Rozanov4, S. Sanghavi5, R. Schofield6,**, C. von Friedeburg5, T. Wagner5, F. Wittrock4, D. Fonteyn1, and M. De Mazi `ere1
1
Institut d’A ´eronomie Spatiale de Belgique, Brussels, Belgium
2
Norwegian Institute for Air Research, Kjeller, Norway
3
Institute of Atmospheric Science and Climate, Bologna, Italy
4
Institute of Environmental Physics, University of Bremen, Bremen, Germany
5
Institute of Environmental Physics, University of Heidelberg, Heidelberg, Germany
6
National Institute of Water and Atmospheric Research, Omakau, Central Otago, New Zealand © 2005 Author(s). This work is licensed under a Creative Commons License.
ACPD
5, 7929–7964, 2005 Intercomparison exercise between radiative transfer models F. Hendrick et al. Title Page Abstract Introduction Conclusions References Tables Figures J I J I Back CloseFull Screen / Esc
Print Version Interactive Discussion
EGU
* now at: St. Olavs University Hospital, Trondheim, Norway ** now at: NOAA Aeronomy Laboratory, Boulder, Colorado, USA
Received: 30 June 2005 – Accepted: 23 August 2005 – Published: 2 September 2005 Correspondence to: F. Hendrick ([email protected])
ACPD
5, 7929–7964, 2005 Intercomparison exercise between radiative transfer models F. Hendrick et al. Title Page Abstract Introduction Conclusions References Tables Figures J I J I Back CloseFull Screen / Esc
Print Version Interactive Discussion
EGU
Abstract
We present the results of an intercomparison exercise between six different radiative transfer (RT) models carried out in the framework of QUILT, an EU funded project based on the exploitation of the Network for the Detection of Stratospheric Change (NDSC). RT modeling is an important step in the interpretation of Differential Optical Absorption
5
Spectroscopy (DOAS) observations. It allows the conversion of the slant column den-sities (SCDs) into vertical column denden-sities (VCDs) using calculated air mass factors (AMFs). The originality of our study resides in comparing SCD simulations in multi-axis (MAX) geometry (trace gases: NO2and HCHO) and in taking into account the photo-chemical enhancement for calculating SCDs of rapidly photolysing species (BrO, NO2,
10
and OClO) in zenith-sky geometry. Concerning the MAX simulations, good agreement is observed between the different models with the calculated NO2 and HCHO SCDs differing by no more than 5% in the elevation and solar zenith angles (SZA) ranges investigated (5◦–20◦ and 35◦–85◦, respectively). The impacts of aerosol scattering, ground albedo, and relative azimuth on MAX simulations have also been tested. Large
15
discrepancies appear for the aerosol effect, suggesting differences between models in the treatment of the aerosol scattering. A better agreement is obtained in the case of the ground albedo and relative azimuth effects. In zenith-sky geometry, the different models agree generally well, especially below 90◦SZA. At higher SZA, larger discrep-ancies are observed with relative difference values between 2% and 14% in some
20
cases. All the initialization data and results have been made publicly available through the QUILT project web site (http://nadir.nilu.no/quilt/), enabling the testing of other RT codes designed for the calculation of SCDs/AMFs.
1. Introduction
Since the middle of the 1970s, stratospheric ozone and several trace gases directly or
25
moni-ACPD
5, 7929–7964, 2005 Intercomparison exercise between radiative transfer models F. Hendrick et al. Title Page Abstract Introduction Conclusions References Tables Figures J I J I Back CloseFull Screen / Esc
Print Version Interactive Discussion
EGU
tored from the ground using the Differential Optical Absorption Spectroscopy (DOAS)-technique (Platt, 1994). A significant part of this monitoring effort has been carried out through the framework of the Network for the Detection of Stratospheric Change (NDSC). The NDSC consists of about 20 sites combining complementary observations techniques distributed in five Primary Stations (Arctic, Alpine, Hawaii, New Zealand,
5
and Antarctic) together with many globally distributed complementary sites. Network operations started in January 1991 and have provided a consistent, standardised set of long-term measurements of stratospheric and, more recently, tropospheric trace gases, particles, and physical parameters for detecting atmospheric change, validating space-borne sensors, and testing and improving multidimensional models of both the
10
stratosphere and troposphere (further information athttp://www.ndsc.ncep.noaa.gov/). Concerning the scattered sunlight DOAS instruments, they operated until recently al-most only in zenith-sky geometry, thus probing mainly the altitude region correspond-ing to the stratosphere, especially at large solar zenith angles (SZAs). Over the last decade, new instruments pointing not only at zenith but also towards the horizon (o
ff-15
axis geometry) have been developed (e.g., Heckel et al., 2005; H ¨onninger et al., 2004; Wagner et al., 2004; Wittrock et al., 2004). Pointing at an elevation angle close to the horizon provides sensitivity to the lowest absorption layers and therefore enables the measurement of tropospheric species. The Multi-AXis (MAX-) DOAS technique combines different elevation angles. Due to the variation of the light paths in the
tropo-20
sphere with the elevation angle, the different viewing directions have maximum sensi-tivity at different heights, thus providing some information on the vertical distribution of the absorber.
An important step in the interpretation of DOAS observations is the conversion of the slant column densities (SCDs) – which are the direct product of the DOAS analysis –
25
into vertical column densities (VCDs) using calculated air mass factors (AMFs). The AMF represents the ratio of the effective optical path through the atmosphere to the ver-tical opver-tical path and is given by the ratio SCD/VCD (Noxon et al., 1979; Solomon et al., 1987). In practice, AMFs are calculated using a radiative transfer (RT) model. In the
ACPD
5, 7929–7964, 2005 Intercomparison exercise between radiative transfer models F. Hendrick et al. Title Page Abstract Introduction Conclusions References Tables Figures J I J I Back CloseFull Screen / Esc
Print Version Interactive Discussion
EGU
case of short lived species such as BrO, OClO, and NO2, the calculation of SCDs and therefore AMFs is complicated by the variation of the concentration of these species along a given light path due to the fast diurnal variation of these radicals coupled to the local SZA variation along the light path (Fish et al., 1995). The so-called photochemical enhancement effect is taken into account by initializing RT models with a table
contain-5
ing the concentrations of the absorber for different heights and SZAs. This table is then interpolated to determine the trace gas concentration at the altitudes and local SZAs of the different scatter points considered along a given sun ray path. Such a concentra-tion table is usually generated by running a stacked box photochemical model initialized with the output of a 3-D chemical transport model (CTM) corresponding to the day and
10
location of interest. SCDs calculated by coupling a 3-D CTM to a photochemical box-/RT models interface can also be directly compared to observed SCDs. For example, Sinnhuber et al. (2002) compared ground-based zenith-sky UV-visible observations of BrO obtained at 11 sites with simulations from the 3-D CTM SLIMCAT (Chipperfield, 1999). The RT model used was based on the single scattering ray tracing scheme
15
of Solomon et al. (1987). Recently, several groups have initiated AMF calculations in order to interpret MAX-DOAS measurements. H ¨onninger et al. (2004) have studied the behaviour of AMFs as a function of the solar zenith, elevation, and relative azimuth angles, ground albedo, and aerosol loading for several idealized trace gas profiles. For this purpose, they have used the RT model TRACY based on a Monte Carlo approach
20
(von Friedeburg, 2003). This model has been also used by Wagner et al. (2004) to perform RT modeling for MAX-DOAS O4 observations at different aerosol conditions. Sensitivity tests on O4AMFs were carried out by Wittrock et al. (2004) with SCIATRAN, a RT code based on a combined differential-integral approach involving the Picard iter-ative approximation (CDIPI) (Rozanov et al., 2000, 2001). In this work, SCIATRAN was
25
also used to derive NO2profile information from MAX-DOAS observations. In Heckel et al. (2005), this model generated appropriate AMFs for the conversion of MAX-DOAS measurements of HCHO into VCDs. These examples show that RT modeling plays a central role in the interpretation of ground-based DOAS observations and that different
ACPD
5, 7929–7964, 2005 Intercomparison exercise between radiative transfer models F. Hendrick et al. Title Page Abstract Introduction Conclusions References Tables Figures J I J I Back CloseFull Screen / Esc
Print Version Interactive Discussion
EGU
RT computation schemes are available for this purpose.
The QUILT (Quantification and Interpretation of Long-Term UV-Vis Observations of the Stratosphere) project is an EU funded project based on the exploitation of the NDSC and aimed at quantifying ozone loss and investigating its relation to active halo-gen and nitrohalo-gen species using the existing ground-based, satellite and balloon borne
5
UV-visible data as well as 3-D atmospheric modelling tools. One of the tasks of this project has been to test the consistency between the different RT models existing within the consortium and used to interpret the ground-based and satellite DOAS data. This task has been achieved through several SCD simulations comparison tests performed using identical settings for all the models. Both ground zenith-sky (trace gases: BrO,
10
NO2, and OClO) and MAX geometries (trace gases: NO2and HCHO) have been con-sidered for these tests, the photochemical enhancement being taken into account only in zenith-sky geometry.
Here we report on the results of this intercomparison exercise. It should be noted that our study does not address the issue of the absolute accuracy of the SCD calculations,
15
the consistency between simulated and measured SCDs having already been tested in several papers (e.g., Sinnhuber et al., 2002; Tørnkvist et al., 2002). It can be consid-ered to a certain extent as the continuation of Sarkissian et al. (1995) who calculated O3 and NO2 AMFs with different RT models in zenith-sky geometry but without taking into account the photochemical enhancement effect (use of a single profile for the
ini-20
tialization of the models). Our paper is divided into five parts. In Sect. 2, we describe the different RT models involved in the intercomparison exercise. The comparison tests in zenith-sky and MAX geometries are described in Sects. 3 and 4, respectively, and their corresponding results are discussed therein. Sects. 5 and 6 are dedicated to the impact of the aerosols and ground albedo on MAX simulations, respectively.
ACPD
5, 7929–7964, 2005 Intercomparison exercise between radiative transfer models F. Hendrick et al. Title Page Abstract Introduction Conclusions References Tables Figures J I J I Back CloseFull Screen / Esc
Print Version Interactive Discussion
EGU
2. Description of the RT models
The groups contributing RT calculations to the intercomparison exercise were the re-mote sensing groups at the Universities of Bremen (UBRE) and Heidelberg (UHEI), Norwegian Institute for Air Research (NILU), Institute of Atmospheric Science and Cli-mate (ISAC-CNR), National Institute of Water and Atmospheric Research (NIWA), and
5
Institut d’A ´eronomie Spatiale de Belgique (IASB). A summary of the characteristics of the models used by these groups is given in Table 1. From now on, each model will be referred to by the name of its corresponding group (in brackets here above). All the models include the possibility of taking into account the photochemical enhancement. The solution approaches to the RT equation (RTE) used in the different RT codes are
10
as follows:
• The Finite Difference method (UBRE model): uses the integro-differential equa-tions obtained by the expansion of the RTE in a Fourier cosine series in azimuth. The application of vertical and angular discretizations produces a matrix equation for each Fourier component which can be solved by using a recursion method
15
(Lenoble, 1985; Rozanov et al., 2000 and 2001).
• The Discrete Ordinate method (NILU and IASB models): as in the Finite Di ffer-ence method, the azimuth dependffer-ence of the radiation field is expressed as a Fourier cosine series in azimuth. However, the solution of the Fourier compo-nents is obtained in this case using a numerical quadrature scheme, allowing to
20
replace the integrals by sums and thus reducing the RTE to the solution of a set of coupled linear first-order differential equations (Lenoble, 1985; Stamnes et al., 1988; Spurr, 2001).
• The backward Monte Carlo method (UHEI model): a photon emerges from a detector in an arbitrary line of sight direction and is followed in the backward
di-25
ACPD
5, 7929–7964, 2005 Intercomparison exercise between radiative transfer models F. Hendrick et al. Title Page Abstract Introduction Conclusions References Tables Figures J I J I Back CloseFull Screen / Esc
Print Version Interactive Discussion
EGU
to the photon at various heights in the atmosphere are defined by suitable proba-bility distributions. Random numbers decide on the occurrence of events. At the location of the last scattering event prior to leaving the atmosphere, the impinging radiance is calculated and weighted with the value of the scattering phase function and with the attenuation of the complete path. A large number of such random
5
photon paths will reproduce the light contributing to the simulated measurement (von Friedeburg, 2003; Lenoble, 1985).
• Single scattering ray tracing (ISAC and NIWA models) method: in zenith-sky ge-ometry, it consists of computing the attenuation from the sun through discrete spherical atmospheric shells to “points” where the light beams are scattered into
10
the detector (Solomon et al., 1987).
3. Zenith-sky simulations of BrO, NO2, and OClO SCDs including photochemi-cal enhancement
3.1. Comparison test description
In this test, BrO, OClO, and NO2 SCDs have been calculated in zenith-sky geometry
15
in single scattering (SS) and when possible, in multiple scattering (MS) modes, tak-ing into account the photochemical enhancement effect. The settings imposed for all models are summarized in Table 2. Color plots of the diurnal variation tables (con-centration of BrO, OClO, and NO2as a function of the altitude and SZA) are shown in Figs. 1, 2, and 3, respectively. They are the output of the stacked box photochemical
20
model PSCBOX (Errera and Fonteyn, 2001; Hendrick et al., 2000 and 2004) initialized with the 3-D-CTM SLIMCAT chemical and meteorological fields. Two scenarios have been considered: Harestua (60◦N, Norway) at sunset in summer for NO2SCD calcu-lations and Harestua at sunset under chlorine activated conditions for BrO and OClO. All calculations included absorption by O3 and in the case of BrO and OClO, also the
ACPD
5, 7929–7964, 2005 Intercomparison exercise between radiative transfer models F. Hendrick et al. Title Page Abstract Introduction Conclusions References Tables Figures J I J I Back CloseFull Screen / Esc
Print Version Interactive Discussion
EGU
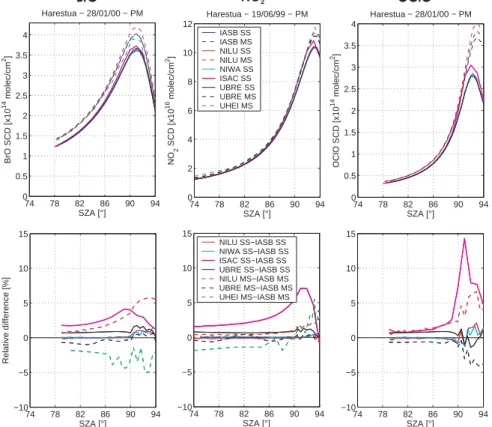
absorption by NO2. 3.2. Results
The results of the zenith-sky simulations of BrO, NO2, and OClO SCDs are presented in Fig. 4. We first concentrate on the general behaviour of the simulated SCDs. Fig-ure 4 shows that the impact of MS is more important for BrO than for NO2, and for
5
OClO, it is mostly significant at large SZA (>92◦). The different behaviours of BrO and NO2 regarding MS effects can be mainly attributed to the different wavelengths used for both calculations (352 nm for BrO and 422 nm for NO2). In the case of OClO, the large impact of MS at SZA larger than ∼92◦ is related to the photochemistry of this species combined with geometrical considerations. Figure 2 shows that OClO is
situ-10
ated in the ∼17–22 km altitude range and only appears at SZA>92◦. At these SZAs, the absorption due to OClO along a given line of sight occurs where the local SZA is the largest, i.e., near the vertical above the observing point. Given that, a significant part of the OClO layer is likely to be in the earth’s shadow region and therefore can only be probed by multiply scattered light. This explains the large impact of MS on OClO
15
SCDs in these conditions. The differences between the photochemical behaviours of BrO, NO2, and OClO are also manifest from Fig. 4. BrO SCDs display a sharp de-crease above ∼92◦ SZA (see Fig. 1), consistent with the rapid conversion of BrO into its night-time reservoirs (mostly BrCl in the present case) in the absence of sunlight. In contrast, the concentrations of OClO and NO2 increase with the SZA (see Figs. 2
20
and 3, respectively), which explains the persistence of relatively large SCD values at corresponding SZAs, especially for MS mode.
Concerning the comparison of simulated SCDs, the relative differences between the results of the different models and the IASB ones arbitrarily taken as reference appear in the lower plots of Fig. 4 and a summary of the maximum difference values obtained
25
is presented in Table 3. In SS mode, good agreement is observed below 90◦ SZA between the NIWA, IASB, NILU, and UBRE models: for the three species, the relative difference between the NIWA, NILU, and UBRE models and the IASB one (reference
ACPD
5, 7929–7964, 2005 Intercomparison exercise between radiative transfer models F. Hendrick et al. Title Page Abstract Introduction Conclusions References Tables Figures J I J I Back CloseFull Screen / Esc
Print Version Interactive Discussion
EGU
model) is smaller than 1%. In the case of the ISAC-CNR model, simulated SCDs are systematically larger and the relative difference rises up to 4% for BrO, 5% for NO2 and 7.5% for OClO. Above 90◦SZA, agreement between the NIWA, IASB, UBRE, and NILU models is still very good with relative difference values smaller than 1.8% for BrO, 1.3% for NO2, and 2.1% for OClO. A maximum spread between models of about 2%
5
is a better agreement than the one obtained by Sarkissian et al. (1995) without tak-ing into account the photochemical enhancement (from Sarkissian et al. (1995), the maximum spread values rise up to 13% for O3 and 8% for NO2 at 94◦ SZA). Con-cerning the ISAC-CNR simulations above 90◦ SZA, the discrepancies with the IASB model are larger than the ones observed for the NIWA and NILU models: the relative
10
differences are smaller than 4% for BrO and rise up to 7.1% for NO2, and 14.3% for OClO. Although these maximum relative difference values are consistent with those of Sarkissian et al. (1995), they suggest that the ISAC-CNR model differs from the other models in the way the optical thickness of each atmospheric shell is calculated. Sarkissian et al. (1995) investigated the influence of the different methods used to
in-15
terpolate the concentration and to calculate the geometrical path in individual shells. They found that the impact of these parameters increases with increasing SZA and can reach 4% above 90◦ SZA. Since the photochemical enhancement is included in the present test, we cannot neglect the impact of differences in interpolating the tables of photochemical species concentrations. This effect is consistent with the observed
20
increase of the relative differences between models with increasing SZA since the step between the SZA values corresponding to the concentration tables is increasing at large SZA. Concerning the calculations in MS mode, agreement below 90◦ SZA be-tween the NILU, IASB, UBRE, and UHEI models is good since the relative differences with the IASB models are smaller than 4.4%. Above 90◦SZA, slightly larger
discrepan-25
cies are generally observed as in SS mode and the maximum relative differences with the IASB model rise up to 6.6% for the NILU model (obtained for OClO SCD calcu-lations), 5.5% for the UHEI model (obtained for NO2 SCD calculations), and 4.2% for the UBRE model (obtained for OClO SCD calculations). It should be noted that UHEI
ACPD
5, 7929–7964, 2005 Intercomparison exercise between radiative transfer models F. Hendrick et al. Title Page Abstract Introduction Conclusions References Tables Figures J I J I Back CloseFull Screen / Esc
Print Version Interactive Discussion
EGU
OClO data are absent from the comparison. This is caused by the fact that too many photons (around 105) would have been required to calculate each SCD with sufficient accuracy and precision. In contrast to the NO2 or BrO profile, the stratospheric OClO is usually confined to a layer of only a few kilometres thickness, and the concentration gradient is very high at its lower and upper ends (see Fig. 2). The Monte Carlo
char-5
acter of the UHEI model causes the scattering point altitude to vary around a given value. For a profile of the shape described, the SCD does react very sensitively to even small scattering altitude variation, i.e., a scattering location just below the profile yields a low SCD, while a slight shift upwards causes the photon to continue the flight on a slant path within the profile, leading to a sharp increase of the SCD. The Monte
10
Carlo approach induced a variation of the scattering altitude, which in the case of OClO results in a strong variation of the SCD itself. This can only be overcome with a very large number of modelled photons, which causes the UHEI model to be inefficient for this specific kind of scenario. With the expected increase in computational power, this disadvantage is likely to become insignificant in a near future.
15
4. Multi-axis simulations of NO2and HCHO SCDs
4.1. Comparison test description
In contrast to the zenith-sky simulations, the photochemical enhancement has not been taken into account in the MAX simulations. The reason is that this effect becomes sig-nificant only during twilight, i.e. above 85◦SZA, and we have limited our comparison in
20
the 38◦–85◦ SZA range because the sensitivity of the MAX-DOAS observations to the troposphere is largest during daytime, i.e. at small SZA. The NO2 and HCHO profiles used for the initialization of the models are shown in Fig. 5. All calculations included absorption by O3and in the case of HCHO, also the absorption by NO2. SCD simula-tions have been performed for 5◦, 10◦, and 20◦ of elevation above the horizon and for
25
ACPD
5, 7929–7964, 2005 Intercomparison exercise between radiative transfer models F. Hendrick et al. Title Page Abstract Introduction Conclusions References Tables Figures J I J I Back CloseFull Screen / Esc
Print Version Interactive Discussion
EGU
been considered: 30◦, 60◦, 90◦, and 120◦. The AzLOS is the relative azimuth angle between the pointing direction of the instrument and the sun azimuth. The other set-tings appear in Table 4. Concerning the HCHO SCD calculations, the layer thickness in the altitude range where the concentration of this species changes rapidly with the altitude (0–3 km) has been fixed to 0.2 km instead of the 1 km thickness used in the
5
case of NO2, reducing interpolation effects. Only models enabling calculations in MS mode have been involved in this test since MS is the only acceptable scattering mode in MAX geometry (Wittrock et al., 2004). These models are: IASB, NILU, UBRE and UHEI.
4.2. Results
10
Figure 6 shows the results of NO2and HCHO SCD simulations for 5◦, 10◦, and 20◦ of elevation and 90◦ of AzLOS. A summary of the maximum difference values between the different models and the IASB one (again taken arbitrarily as reference model) is also presented in Table 5. The agreement between IASB, NILU, UBRE and UHEI is good: when comparing the results for both species over the whole SZA range and for
15
all the elevation angles, the relative differences between the NILU, UBRE, and UHEI models and the IASB one are smaller than 5.1%. Concerning the UBRE model, it underestimates the IASB model results by maximum 4.5% for NO2and 5.1% for HCHO. The relative differences are also almost constant over the whole SZA range. This is in contrast with the relative differences between the UHEI and IASB models which show
20
a SZA dependence, especially at low elevation angles: e.g., for NO2at 5◦of elevation, the UHEI model overestimates the IASB one by 3% at 40◦SZA and underestimates it by 3.6% at 85◦SZA. However, with observed maximum relative difference of 3.8% for NO2and 4.5% for HCHO (see Table 5), the agreement between both models is good. As expected since they are both based on the UVspec/DISORT package, the NILU
25
and the IASB models agree very well: for both NO2and HCHO, the relative difference between the results of both models is smaller than 1.3% over the entire SZA range and for all elevation angles.
ACPD
5, 7929–7964, 2005 Intercomparison exercise between radiative transfer models F. Hendrick et al. Title Page Abstract Introduction Conclusions References Tables Figures J I J I Back CloseFull Screen / Esc
Print Version Interactive Discussion
EGU
The impact of the relative azimuth has been tested through the calculation of NO2 and HCHO SCDs for different AzLOS values (30◦, 60◦, 90◦, and 120◦). Wittrock et al. (2004) have shown in their RT studies on O4AMF in MAX geometry that the AzLOS effect can be very large, especially for AzLOS pointing towards the sun (impact on O4 AMF larger than 10% for AzLOS smaller than 90◦compared to the 90◦ AzLOS case).
5
The AzLOS effect on NO2 SCDs is illustrated in Fig. 7 where the relative differences between the NO2 SCDs at 30◦, 60◦, and 120◦ AzLOS and the SCDs at 90◦ AzLOS (reference) are plotted as a function of the SZA for 5◦ and 20◦ of elevation. As in Wittrock et al. (2004), the largest AzLOS effect is observed at small AzLOS and high elevation angle. However, its magnitude is significantly smaller than for O4: about
10
7% on NO2 SCDs at 50◦ SZA for 30◦ AzLOS and 20◦ of elevation instead of 45% for O4 in similar conditions. It is also observed from Fig. 7 that the consistency between the IASB, NILU, UBRE, and UHEI models with respect to the impact of the AzLOS is reasonably good. In the case of HCHO (not shown here), the AzLOS effect is smaller by 1–2% than the one observed for NO2.
15
5. Impact of aerosol scattering on multi-axis simulations of NO2 and HCHO SCDs
The aerosols have a strong impact on MAX-DOAS observations (Wagner et al., 2004; Wittrock et al., 2004; and Heckel et al., 2005). The most important effect of the aerosol extinction is a reduction of the visibility of the atmosphere and thus a limitation by
20
scattering of the light path of the lowest viewing directions, reducing the difference in tropospheric absorption path between the viewing directions. Given this effect and its impact on MAX-DOAS O4 observations, Wagner et al. (2004) have also shown that O4 observations can provide a new method for deriving information on atmospheric aerosols.
25
In the present study, MAX NO2 and HCHO SCDs have been simulated with and without aerosol scattering in order to test the consistency between the different RT
ACPD
5, 7929–7964, 2005 Intercomparison exercise between radiative transfer models F. Hendrick et al. Title Page Abstract Introduction Conclusions References Tables Figures J I J I Back CloseFull Screen / Esc
Print Version Interactive Discussion
EGU
models regarding the impact of the aerosols in this geometry. The aerosol extinction coefficient profiles used for initializing the models are shown in Fig. 8. They have been constructed from the aerosol model of Shettle (1989) included in the IASB and NILU RT models. Profiles of aerosol absorption coefficient and asymmetry factor have been also imposed in this test. The other settings are the same as the ones described
5
in Sect. 4.1, except that HCHO and NO2 SCDs have been calculated only for 90◦ of AzLOS.
Figure 9 shows the impact of the aerosol scattering on simulated MAX NO2 and HCHO SCDs. Large discrepancies are observed between the UBRE and UHEI mod-els and the IASB and NILU ones regarding the relative differences between simulations
10
with and without aerosol scattering. In the case of HCHO, the impact of the aerosol scattering decreases and the agreement between the different models becomes bet-ter when the elevation angle increases. Similar features are observed for NO2but to a lesser extent. Figure 9 also shows that the impact of the aerosol scattering is smaller on HCHO than NO2SCDs: the relative differences between calculations with and without
15
aerosol scattering are comprised for all models, elevation angles, and SZAs between −13% and+1.5% for HCHO and between −21% and +4% for NO2. These
discrepan-cies could not be resolved satisfactorily so far. Their origin is unlikely to be found in the aerosol settings since all models have been initialized with the same aerosol profiles (extinction and absorption coefficients and asymmetry factor). In order to progress
fur-20
ther in our understanding of these persistent discrepancies, a thorough examination of individual aerosol routines and additional comparison tests appear to be needed, which is beyond the scope of the present intercomparison exercise. This issue, and more generally the impact of the aerosol scattering on MAX DOAS AMF simulations, will be addressed more thoroughly as part of a new exercise, currently led by the University of
25
Heidelberg in the framework of the European Network of Excellence on Atmospheric Composition Change ACCENT.
ACPD
5, 7929–7964, 2005 Intercomparison exercise between radiative transfer models F. Hendrick et al. Title Page Abstract Introduction Conclusions References Tables Figures J I J I Back CloseFull Screen / Esc
Print Version Interactive Discussion
EGU
6. Impact of ground albedo on multi-axis simulations of NO2and HCHO SCDs
Ground albedo has a significant impact on the radiative transfer close to the ground (H ¨onniger et al., 2004; Wittrock et al., 2004). It is particularly important to properly esti-mate this parameter for observational sites displaying large albedo changes depending on the season or viewing direction. The main effect of an increase of the albedo is an
5
increase of the number of scattering events in the layers close to the surface, resulting in longer absorption paths at these altitudes and therefore to higher absolute AMFs. However, the difference in AMF between horizon and zenith-sky viewing directions is reduced, due to the fact that the enhancement of the optical path with increasing albedo is the largest for zenith-sky observations (Wittrock et al., 2004).
10
In order to test the consistency between the different RT models regarding the impact of the ground albedo in MAX geometry, NO2 and HCHO SCDs have been simulated with ground albedo values fixed to 0 and 0.9. The other model settings are the same as those described in Sect. 4.1. As for the test on the impact of aerosol scattering, simulations have been performed only for 90◦AzLOS.
15
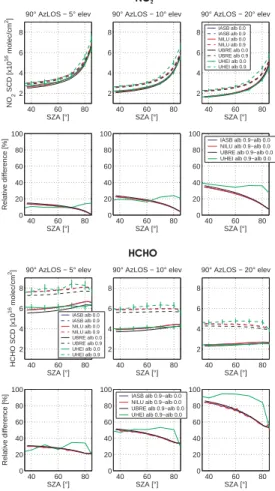
Figure 10 illustrates the ground albedo effect on simulated MAX HCHO and NO2 SCDs. The UBRE, NILU, and IASB models show excellent consistency with similar HCHO and NO2 SCD increases being observed with the three models. An increase of the ground albedo value from 0.0 to 0.9 leads to an increase of the HCHO SCD of about 20% and 55% at 80◦SZA for 5◦ and 20◦of elevation, respectively, whereas the
20
NO2 SCD increases by 5% and 12% in the same conditions. The fact that the HCHO SCDs are more sensitive to the ground albedo is expected since for the present simu-lations, HCHO, in contrast to NO2, is mostly located in the lower part of the troposphere (between 0 and 5 km). The corresponding increase of the SCD values are systemati-cally larger using the UHEI model: 32% and 84% for HCHO SCDs, and 12% and 35%
25
for NO2 SCDs. This behaviour is likely to be attributed to the different concepts used in the Monte Carlo model as compared to the analytical codes and further tests would be needed to find out the detailed reasons of this.
ACPD
5, 7929–7964, 2005 Intercomparison exercise between radiative transfer models F. Hendrick et al. Title Page Abstract Introduction Conclusions References Tables Figures J I J I Back CloseFull Screen / Esc
Print Version Interactive Discussion
EGU
7. Conclusions
In the present intercomparison exercise, we have tested the consistency between six RT models used for interpreting ground-based zenith-sky and MAX-DOAS observa-tions in the QUILT EU project. In the context of this project based on the exploitation of the NDSC, the comparison and optimization of these RT models is of central
impor-5
tance in order to provide accurate time-series of ground-based DOAS observations. This study represents a step forward with respect to previously published work in that it compares RT models in MAX geometry and takes into account the photochemical enhancement effect for calculating SCDs of rapidly photolysing species in zenith-sky geometry.
10
Comparisons of NO2 and HCHO SCDs in MAX geometry and multiple scattering mode show good agreement between all involved models: the calculated NO2 and HCHO SCDs differ generally by no more than 5% in the SZA and elevation angle ranges investigated (35◦–85◦and 5◦–20◦, respectively). The impacts of the relative az-imuth, aerosol scattering, and ground albedo on NO2and HCHO SCDs have been also
15
quantitatively determined. As for O4in the Wittrock et al. (2004) study, the azimuth ef-fect is found to be the largest at small AzLOS and high elevation angles. However, this effect is much smaller for NO2and HCHO than for O4(maximum differences relative to 90◦AzLOS in the 30◦–120◦ AzLOS range and for 20◦ of elevation rising up to 7% and 5% for NO2 and HCHO SCDs, respectively, instead of 45% for O4). The models have
20
also shown reasonably good consistency concerning this effect. This is in contrast to the aerosol scattering effect for which large discrepancies still persist. Since all codes have been initialized in a common way, this result suggests that significant differences exist between the models regarding the treatment of the aerosol scattering. This issue, and more generally the impact of the aerosol scattering on the MAX DOAS AMF
sim-25
ulations, will be addressed more thoroughly as part of a new exercise, currently led by the University of Heidelberg in the framework of the European Network of Excellence ACCENT. Concerning the impact of the ground albedo, very good agreement has been
ACPD
5, 7929–7964, 2005 Intercomparison exercise between radiative transfer models F. Hendrick et al. Title Page Abstract Introduction Conclusions References Tables Figures J I J I Back CloseFull Screen / Esc
Print Version Interactive Discussion
EGU
observed between the IASB, NILU, and UBRE models whereas the albedo effect is sig-nificantly larger using the UHEI model, which is based on a Monte Carlo approach. It should be noted that the conclusions drawn here on the levels of agreement between models in the different comparison tests depend on the assumptions made for the ver-tical profiles. In the case of NO2and HCHO, very different vertical profiles are indeed
5
possible and could lead to different levels of agreement.
The comparisons of zenith-sky BrO, NO2, and OClO SCDs calculated in both single and multiple scattering modes show good overall agreement to a level that is consistent and in some cases better than in the Sarkissian et al. (1995) work. In single scattering mode, the relative difference between the models is smaller than 1% below 90◦ SZA.
10
In the case of the ISAC-CNR model, relative differences rising up to 7.5% have been observed in this SZA range. Above 90◦ SZA, agreement between the IASB, NILU, UBRE, and NIWA models is still very good with a maximum spread value of about 2%. Larger discrepancies have been observed with the ISAC-CNR model, especially in the OClO SCD calculations (relative difference with the IASB model up to 14%).
15
These discrepancies could be partly due to differences in calculating the density in individual atmospheric shells. In multiple scattering mode, the differences between the NILU, UHEI, and UBRE models and the IASB one are smaller than 4.4% below 90◦ SZA for the three species. Above 90◦ SZA, slightly larger discrepancies have been observed with a maximum relative difference with the IASB model of about 6.5%. As
20
in MAX geometry, the assumptions made on the vertical profiles used for the zenith-sky simulations can have an impact on the agreement observed between the models. This is particularly true for OClO, for which a small change in the vertical profiles could change the behaviour of the different models quite a bit.
All the initialization data (profiles and cross sections sets) and results of this
inter-25
comparison exercise have been gathered in a “RT model validation package” enabling the testing of other RT codes aiming to the calculation of SCDs/AMFs. This valida-tion package has been made publicly available through the QUILT project web site
ACPD
5, 7929–7964, 2005 Intercomparison exercise between radiative transfer models F. Hendrick et al. Title Page Abstract Introduction Conclusions References Tables Figures J I J I Back CloseFull Screen / Esc
Print Version Interactive Discussion
EGU
Acknowledgements. This research was financially supported by the European Commission
(contract QUILT, EVK2-2000-00545) and the Belgian Federal Science Policy Office (contracts ESAC II EV/35/3A and MO/35/006 & 012). M. P. Chipperfield (University of Leeds) is acknowl-edged for providing us with the SLIMCAT data. We would like also to thank the coordinators of the QUILT EC project, B. Arlander and G. O. Braathen (NILU).
5
References
Barbe, A., March ´e, P., Secroun, C., and Jouve, P.: Measurements of tropospheric and strato-spheric H2CO by an infrared high resolution technique, Geophys. Res. Lett., 6(6), 463–465, 1979.
Burrows, J. P., Dehn, A., Deters, B., Himmelmann, S., Richter, A., Voigt, S., and Orphal, J.:
10
Atmospheric remote-sensing reference data from GOME: Part 1. Temperature dependent absorption cross sections of NO2 in the 231–794 nm range, J. Quant. Spectrosc. Radiat, Transfer, 60, 1025–1031, 1998.
Burrows, J. P., Richter, A., Dehn, A., Deters, B., Himmelmann, S., Voigt, S., and Orphal, J.: At-mospheric remote-sensing reference data from GOME: Part 2. Temperature dependent
ab-15
sorption cross sections of O3in the 231–794 nm range, J. Quant. Spectrosc. Radiat. Transfer, 61, 509-517, 1999.
Cantrell, C. A., Davidson, J. A., McDaniel, A. H., Shetter, R. E., and Calvert, J. G.: Temperature-dependent formaldehyde cross sections in the near-ultraviolet region, J. Phys. Chem., 94, 3902–3908, 1990.
20
Chipperfield, M. P.: Multiannual simulations with a three-dimensional chemical transport model, J. Geophys. Res., 104(D1), 1781–1805, 1999.
Errera, Q. and Fonteyn, D.: Four-dimensional variational chemical assimilation of CRISTA stratospheric measurements, J. Geophys. Res., 106(D11), 12 253–12 265, 2001.
Ehhalt, D. H. and T ¨onnißen, A.: Hydrogen and carbon compounds in the stratosphere,
Pro-25
ceedings of the NATO Advanced Study Institute on Atmospheric Ozone: Its Variation and Human Influences, edited by: Aikin, A. C., Report No. FAA-EE-80-20, U.S. Federal Aviation Administration, 1979.
Fish, D. J., Jones, R. L., and Strong, E. K.: Midlatitude observations of the diurnal variation of stratospheric BrO, J. Geophys. Res., 100(D9), 18 863–18 871, 1995.
ACPD
5, 7929–7964, 2005 Intercomparison exercise between radiative transfer models F. Hendrick et al. Title Page Abstract Introduction Conclusions References Tables Figures J I J I Back CloseFull Screen / Esc
Print Version Interactive Discussion
EGU
Hendrick, F., Mueller, R., Sinnhuber, B.-M., Bruns, M., Burrows, J. P., Chipperfield, M. P., Fonteyn, D., Richter, A., Van Roozendael, M., and Wittrock, F.: Simulation of BrO Diurnal Variation and BrO Slant Columns: Intercomparison Exercise Between Three Model Pack-ages, Proceedings of the 5th European Workshop on Stratospheric Ozone, Saint Jean de Luz, France, 27 Sept.–1 Oct. 1999, Air Pollution Research Report no. 73, European
Com-5
mission – DG XII, Brussels, 2000.
Hendrick, F., Barret, B., Van Roozendael, M., Boesch, H., Butz, A., De Mazi `ere, M., Goutail, F., Hermans, C., Lambert, J.-C., Pfeilsticker, K., and Pommereau, J.-P.: Retrieval of nitrogen dioxide stratospheric profiles from ground-based zenith-sky UV-visible observations: valida-tion of the technique through correlative comparisons, Atmos. Chem. Phys., 4, 2091–2106,
10
2004,
SRef-ID: 1680-7324/acp/2004-4-2091.
Heckel, A., Richter, A., Tarsu, T., Wittrock, F., Hak, C., Pundt, I., Junkermann, W., and Burrows, J. P.: MAX-DOAS measurements of formaldehyde in the Po-Valley, Atmos. Chem. Phys., 5, 909–918, 2005,
15
SRef-ID: 1680-7324/acp/2005-5-909.
H ¨onninger, G., Friedeburg, C. V., and Platt, U.: Multi Axis Differential Optical Absorption Spec-troscopy (MAX-DOAS), Atmos. Chem. Phys., 4, 231–254, 2004,
SRef-ID: 1680-7324/acp/2004-4-231.
Lenoble, J.: Radiative Transfer in Scattering and Absorbing Atmospheres: Standard
computa-20
tional procedures, A. Deepak Publishing, Hampton, Virginia USA, 1985.
Mayer, B. and Kylling, A.: Technical note: The libRadtran software package for radiative transfer calculations – description and examples of use, Atmos. Chem. Phys., 5, 1855–1877, 2005, SRef-ID: 1680-7324/acp/2005-5-1855.
Noxon, J. F., Whipple, E. C., and Hyde, R. S.: Stratospheric NO2. 1. Observational method and
25
behaviour at midlatitudes, J. Geophys. Res., 84, 5047–5076, 1979.
Petritoli, A., Ravegnani, F., Giovanelli, G., Bortoli, D., Bonaf `e, U., Kostadinov, I., and Oulanovsky, A.: Off-axis measurements of atmospheric trace gases by use of an airborne ultraviolet-visible spectrometer, Appl. Opt., 41(27), 5593–5599, 2002a.
Petritoli, A., Giovanelli, G., Kostadinov, I., Ravegnani, F., Bortoli, D., Bonasoni, P., Evangelisti,
30
F., Bonaf `e, U., and Calzolari, F.: Tropospheric and stratospheric NO2 amount deduced by slant column measurements at Mt. Cimone station, Adv. Space Res., 29(11), 1691–1695, 2002b.
ACPD
5, 7929–7964, 2005 Intercomparison exercise between radiative transfer models F. Hendrick et al. Title Page Abstract Introduction Conclusions References Tables Figures J I J I Back CloseFull Screen / Esc
Print Version Interactive Discussion
EGU
Platt, U: Differential optical absorption spectroscopy (DOAS), in Air Monitoring by Spectro-scopic Techniques, Chem. Anal. Ser., edited by: Sigrist, M. W., 127, 27–84, John Wiley, New York, 1994.
Rozanov, A., Rozanov, V.-V., and Burrows, J.-P.: Combined differential-integral approach for the radiation field computation in a spherical shell atmosphere: Nonlimb geometry, J. Geophys.
5
Res., 105, D18, 22 937, 2000.
Rozanov, A., Rozanov, V.-V., and Burrows J.-P.: A numerical radiative transfer model for a spherical planetary atmosphere: combined differential-integral approach involving the Picard iterative approximation, J. Quant. Spectrosc. Radiat. Transfer, 69, 491, 2001.
Sarkissian, A., Roscoe, H. K., Fish, D., Van Roozendael, M., Gil, M., Chen, H. B., Wang, P.,
10
Pommereau, J.-P., and Lenoble, J.: Ozone and NO2 air-mass factors for zenith-sky spec-trometers: Intercomparison of calculations with different radiative transfer models, Geophys. Res. Lett., 22(9), 1113–1116, 1995.
Schofield, R.: The vertical distribution of atmospheric BrO from ground-based measurements, PhD thesis, University of Auckland, Auckland, 2003.
15
Schofield, R., Connor, B. J., Kreher, K., Johnston, P. V., and Rodgers, C. D.: The retrieval of pro-file and chemical information from ground-based UV-visible spectroscopic measurements, J. Quant. Spectrosc. Radiat. Transfer, 86, 115–131, 2004.
Shettle, E. P.: Models of aerosols, clouds, and precipitation for atmospheric propagation stud-ies, AGARD Conference Proceedings No. 454: Atmospheric propagation in the UV, visible,
20
IR and mm-region and related system aspects, 1989.
Sinnhuber, B.-M., Arlander, D. W., Bovensmann, H., Burrows, J. P., Chipperfield, M. P., Enell, C.-F., Frieß, U., Hendrick, F., Johnston, P. V., Jones, R. L., Kreher, K., Mohamed Tahrin, N., M ¨uller, R., Pfeilsticker, K., Platt, U., Pommereau, J.-P., Pundt, I., Richter, A., South, A. M., Tørnkvist, K.K., Van Roozendael, M., Wagner, T., and Wittrock, F.: Comparison of
25
measurements and model calculations of stratospheric bromine monoxide, J. Geophys. Res., 107(D19), 4398, doi:10.1029/2001JD000940, 2002.
Solomon, S., Schmeltekopf, A. L., and Sanders, R. W.: On the Interpretation of Zenith sky Absorption Measurements, J. Geophys. Res., 92(D7), 8311–8319, 1987.
Spurr, R. J. D.: Linearized Radiative Transfer Theory: A general discrete ordinate approach to
30
the calculation of radiances and analytic weighting functions, with application to atmospheric remote sensing, PhD thesis, Technische Universiteit Eindhoven, 2001.
ACPD
5, 7929–7964, 2005 Intercomparison exercise between radiative transfer models F. Hendrick et al. Title Page Abstract Introduction Conclusions References Tables Figures J I J I Back CloseFull Screen / Esc
Print Version Interactive Discussion
EGU
discrete-ordinate-method radiative transfer in multiple scattering and emitting layered media, Appl. Opt., 27, 2505–2509, 1988.
Tørnkvist, K. K., Arlander, D. W., and Sinnhuber, B.-M.: Ground-based UV measurements of BrO and OClO over Ny- ˚Alesund during Winter 1996 and 1997 and Andøya during Winter 1998/99, J. Atmos. Chem., 43(2), 75–106, 2002.
5
von Friedeburg, C.: Derivation of Trace Gas Information combining Differential Optical Absorp-tion Spectroscopy with Radiative Transfer Modelling, PhD thesis, University of Heidelberg, 2003.
Wagner, T., Dix, B., Friedburg, C. v., Frieß, U., Sanghavi, S., Sinreich, R., and Platt, U.: MAX-DOAS O4 measurements: A new technique to derive information on
atmo-10
spheric aerosols-Principles and information content, J. Geophys. Res., 109, D22205, doi:10.1029/2004JD004904, 2004.
Wahner, A., Ravishankara, A. R., Sander, S. P., and Friedl, R.R.: Absorption cross-section of BrO between 312 and 385 nm at 298 and 223 K, Chem. Phys. Lett., 152, 507–512, 1988. Wahner, A., Tyndall, G. Y., and Ravishankara, A. R.: Absorption cross-section for OClO as
15
a function of temperature in the wavelength range from 240–490 nm, J. Phys. Chem., 91, 2735–2738, 1987.
Wittrock, F., Oetjen, H., Richter, A., Fietkau, S., Medeke, T., Rozanov, A., and Burrows, J. P.: MAX-DOAS measurements of atmospheric trace gases in Ny- ˚Alesund – Radiative transfer studies and their application, Atmos. Chem. Phys., 4, 955–966, 2004,
20
ACPD
5, 7929–7964, 2005 Intercomparison exercise between radiative transfer models F. Hendrick et al. Title Page Abstract Introduction Conclusions References Tables Figures J I J I Back CloseFull Screen / Esc
Print Version Interactive Discussion
EGU Table 1. Short description of the RT models involved in the intercomparison exercise. Note that
both IASB and NILU models are based on the UVspec/DISORT package. However, they are not strictly identical since they have been adapted separately by each group in order to allow SCD/AMF calculations taking into account the photochemical enhancement.
Group Model main features Scattering mode(s) Reference(s)
UBRE SCIATRAN model: SS+MS Rozanov et al. (2000, 2001);
–Combining Differential-Integral approach using the Wittrock et al. (2004) Picard-Iterative approximation (CDIPI)
–Treatment of MS in a full spherical geometry including refraction –Chemistry included (2-D array of profile variation with SZA) –Treatment for aerosol and cloud scattering, and ground albedo –Raman scattering included
UHEI TRACY model: SS+MS von Friedeburg (2003);
–Backward Monte Carlo approach (only MS H ¨onninger et al. (2004)
–Treatment of MS in a full spherical geometry including refraction in this study) –Chemistry included (2-D array of profile variation with SZA)
–Treatments for aerosol and cloud scattering, and ground albedo –Raman scattering included
NILU and UVspec/DISORT package: SS+MS Mayer and Kylling (2005)
IASB –Discrete ordinate method
–Chemistry included (2-D array of profile variation with SZA) –Treatment of MS and refraction in a pseudo-spherical geometry (direct beam only)
–Treatment for aerosol and cloud scattering, and ground albedo
ISAC-CNR AMEFCO model: SS Petritoli et al. (2002a, b)
–Single scattering model in a 2-D atmosphere (profile variation with SZA)
–Treatment in full spherical geometry including refraction and aerosol scattering
NIWA –Single scattering model in a 2-D atmosphere SS Schofield (2003);
(profile variation with SZA) Schofield et al. (2004)
–Treatment in full spherical geometry including refraction and aerosol scattering
ACPD
5, 7929–7964, 2005 Intercomparison exercise between radiative transfer models F. Hendrick et al. Title Page Abstract Introduction Conclusions References Tables Figures J I J I Back CloseFull Screen / Esc
Print Version Interactive Discussion
EGU Table 2. Model settings for the comparison test in zenith-sky geometry. All the initialisation
data are available on the QUILT web site (http://nadir.nilu.no/quilt/).
Altitude grid 0–120 km/1 km thick
Wavelength 352 nm (BrO)
368 nm (OClO) 422 nm (NO2)
Diurnal variation table (see Figs. 1, 2, and 3) From PSCBOX model
p, T profiles From SLIMCAT 3-D-CTM; interpolation
using AFGL 1976 outside the SLIMCAT altitude range
O3profile From PSCBOX model; interpolation
using AFGL 1976 outside the SLIMCAT altitude range
NO2profile (for BrO and OClO SCDs calculations) From PSCBOX model; interpolation using AFGL 1976 outside the SLIMCAT altitude range
Mie scattering Not included
Refraction Not included
Cross sections sets BrO: Wahner et al. (1988)
OClO: Wahner et al. (1987) NO2: Burrows et al. (1998) O3: Burrows et al. (1999)
Ground albedo 0.20
ACPD
5, 7929–7964, 2005 Intercomparison exercise between radiative transfer models F. Hendrick et al. Title Page Abstract Introduction Conclusions References Tables Figures J I J I Back CloseFull Screen / Esc
Print Version Interactive Discussion
EGU
Table 3. Maximum relative difference observed between the different RT models and the IASB
one – arbitrarily taken as reference – for the comparison test in zenith-sky geometry. Note that the SS and MS models have been compared to the IASB model in SS and MS modes, respectively. BrO [%] NO2[%] OClO [%] NILU SS +1.0 +0.5 +2.1 ISAC SS +4.1 +7.1 +14.3 NIWA SS +1.5 +0.7 +1.6 UBRE SS +1.8 +1.3 −1.4 NILU MS +5.8 +2.7 +6.6 UHEI MS −5.0 +5.5 – UBRE MS −1.0 −0.6 −4.2
ACPD
5, 7929–7964, 2005 Intercomparison exercise between radiative transfer models F. Hendrick et al. Title Page Abstract Introduction Conclusions References Tables Figures J I J I Back CloseFull Screen / Esc
Print Version Interactive Discussion
EGU Table 4. Model settings for the comparison test in MAX geometry. All the initialisation data are
available on the QUILT web site (http://nadir.nilu.no/quilt/).
Altitude grid NO2: 0–120 km/1 km thick
HCHO: 0–120 km/0.2 km thick between 0 and 3 km and 1 km thick above 3 km
Wavelength 356 nm (HCHO)
422 nm (NO2)
p, T profiles From SLIMCAT 3-D-CTM; interpolation using
AFGL 1976 outside the SLIMCAT altitude range
O3profile From PSCBOX model; interpolation using
AFGL 1976 outside the SLIMCAT altitude range NO2profile (for HCHO SCDs calculations) From PSCBOX model; interpolation using
AFGL 1976 outside the SLIMCAT altitude range HCHO and NO2profiles (see Fig. 5) HCHO: Barbe et al. (1979);
Ehhalt and T ¨onnißen (1979) NO2: from PSCBOX model
Mie scattering Not included
Refraction Not included
Cross sections sets HCHO: Cantrell et al. (1990) NO2: Burrows et al. (1998) O3: Burrows et al. (1999)
Ground albedo 0.20
Elevation angle 5◦, 10◦, and 20◦
Azimuth angle of line of sight 30◦, 60◦, 90◦, and 120◦
ACPD
5, 7929–7964, 2005 Intercomparison exercise between radiative transfer models F. Hendrick et al. Title Page Abstract Introduction Conclusions References Tables Figures J I J I Back CloseFull Screen / Esc
Print Version Interactive Discussion
EGU
Table 5. Maximum relative difference observed between the different RT models and the IASB
one – arbitrarily taken as reference – for the comparison test in MAX geometry.
5◦of elevation [%] 10◦of elevation [%] 20◦of elevation [%]
NILU MS NOHCHO2 −0.2+1.0 +0.2+1.3 +0.3+1.1
UHEI MS NOHCHO2 −3.6−3.0 −3.2−3.0 −3.8−4.5
ACPD
5, 7929–7964, 2005 Intercomparison exercise between radiative transfer models F. Hendrick et al. Title Page Abstract Introduction Conclusions References Tables Figures J I J I Back CloseFull Screen / Esc
Print Version Interactive Discussion
EGU Fig. 1. Color plot of the BrO profiles table used to initialize the models in the comparison test
in zenith-sky geometry. The variation of the BrO profiles as a function of the SZA has been calculated for Harestua (60◦N, Norway) at sunset under chlorine activated conditions.
ACPD
5, 7929–7964, 2005 Intercomparison exercise between radiative transfer models F. Hendrick et al. Title Page Abstract Introduction Conclusions References Tables Figures J I J I Back CloseFull Screen / Esc
Print Version Interactive Discussion
EGU Fig. 2. Color plot of the OClO profiles table used to initialize the models in the comparison test
in zenith-sky geometry. The variation of the OClO profiles as a function of the SZA has been calculated for Harestua (60◦N, Norway) at sunset under chlorine activated conditions.
ACPD
5, 7929–7964, 2005 Intercomparison exercise between radiative transfer models F. Hendrick et al. Title Page Abstract Introduction Conclusions References Tables Figures J I J I Back CloseFull Screen / Esc
Print Version Interactive Discussion
EGU
Fig. 3. Color plot of the NO2profiles table used to initialize the models in the comparison test
in zenith-sky geometry. The variation of the NO2 profiles as a function of the SZA has been calculated for Harestua (60◦N, Norway) at sunset in summer.
ACPD
5, 7929–7964, 2005 Intercomparison exercise between radiative transfer models F. Hendrick et al. Title Page Abstract Introduction Conclusions References Tables Figures J I J I Back CloseFull Screen / Esc
Print Version Interactive Discussion EGU NO2 OClO BrO 74 78 82 86 90 94 −10 −5 0 5 10 15 SZA [°] 74 78 82 86 90 94 0 2 4 6 8 10 12 SZA [°] NO 2 SCD [x10 16 molec/cm 2] Harestua − 19/06/99 − PM IASB SS IASB MS NILU SS NILU MS NIWA SS ISAC SS UBRE SS UBRE MS UHEI MS 74 78 82 86 90 94 0 0.5 1 1.5 2 2.5 3 3.5 4 SZA [°] OClO SCD [x10 14 molec/cm 2] Harestua − 28/01/00 − PM 74 78 82 86 90 94 0 0.5 1 1.5 2 2.5 3 3.5 4 SZA [°] BrO SCD [x10 14 molec/cm 2] Harestua − 28/01/00 − PM 74 78 82 86 90 94 −10 −5 0 5 10 15 SZA [°] Relative difference [%] 74 78 82 86 90 94 −10 −5 0 5 10 15 SZA [°] NILU SS−IASB SS NIWA SS−IASB SS ISAC SS−IASB SS UBRE SS−IASB SS NILU MS−IASB MS UBRE MS−IASB MS UHEI MS−IASB MS
Fig. 4. Sunset BrO, NO2, and OClO SCDs calculated in the comparison test in zenith-sky
ge-ometry. The upper plots correspond to the SCDs and the lower plots to the relative differences between the results from the different models and those from the IASB model arbitrarily chosen as reference. Solid and dashed lines correspond to calculations in SS and MS modes, respec-tively. Note that the UHEI OClO data are missing (see Sect. 3.2) and in the upper plots, the blue, red, and cyan solid lines corresponding to, respectively, the IASB, NILU, and NIWA SCD calculations in SS mode are almost superimposed.
ACPD
5, 7929–7964, 2005 Intercomparison exercise between radiative transfer models F. Hendrick et al. Title Page Abstract Introduction Conclusions References Tables Figures J I J I Back CloseFull Screen / Esc
Print Version Interactive Discussion EGU 0 1 2 3 4 5 0 10 20 30 40 50 60 NO 2 conc. [x10 9 molec/cm3] Altitude [km] 0 20 40 60 0 10 20 30 40 50 60
HCHO conc. [x109 molec/cm3]
0 1 2 3 4 0 10 20 30 40 50 60 NO 2 VMR [ppbv] Altitude [km] 0 0.5 1 1.5 2 2.5 0 10 20 30 40 50 60 HCHO VMR [ppbv]
Fig. 5. NO2 (left) and HCHO (right) profiles in concentration (upper plots) and VMR (lower
ACPD
5, 7929–7964, 2005 Intercomparison exercise between radiative transfer models F. Hendrick et al. Title Page Abstract Introduction Conclusions References Tables Figures J I J I Back CloseFull Screen / Esc
Print Version Interactive Discussion EGU NO2 HCHO 40 60 80 2 4 6 SZA [°] NO 2 SCD [x10 16 molec/cm 2] 90° AzLOS − 5° elev 40 60 80 2 4 6 SZA [°] 90° AzLOS − 10° elev 40 60 80 2 4 6 SZA [°] 90° AzLOS − 20° elev IASB MS NILU MS UBRE MS UHEI MS 40 60 80 −10 −5 0 5 10 SZA [°] Relative difference [%] 40 60 80 −10 −5 0 5 10 SZA [°] 40 60 80 −10 −5 0 5 10 SZA [°] NILU MS−IASB MS UBRE MS−IASB MS UHEI MS−IASB MS 40 60 80 2 4 6 SZA [°] HCHO SCD [x10 16 molec/cm 2] 90° AzLOS − 5° elev 40 60 80 2 4 6 SZA [°] 90° AzLOS − 10° elev 40 60 80 2 4 6 SZA [°] 90° AzLOS − 20° elev IASB MS NILU MS UBRE MS UHEI MS 40 60 80 −10 −5 0 5 10 SZA [°] Relative difference [%] 40 60 80 −10 −5 0 5 10 SZA [°] 40 60 80 −10 −5 0 5 10 SZA [°] NILU MS−IASB MS UBRE MS−IASB MS UHEI MS−IASB MS
Fig. 6. NO2and HCHO SCDs calculated in MS mode in the comparison test in MAX geometry.
For each species, the upper plots correspond to the SCDs and the lower plots to the relative differences between the different models and the IASB one arbitrarily chosen as reference. Results for 90◦AzLOS and for 5◦, 10◦, and 20◦of elevation are plotted here.
ACPD
5, 7929–7964, 2005 Intercomparison exercise between radiative transfer models F. Hendrick et al. Title Page Abstract Introduction Conclusions References Tables Figures J I J I Back CloseFull Screen / Esc
Print Version Interactive Discussion EGU 40 60 80 −10 −5 0 5 5° elev 30° AzLOS IASB MS NILU MS UBRE MS UHEI MS 40 60 80 −10 −5 0 5 20° elev 40 60 80 −10 −5 0 5
Relative difference [%]; Reference: 90° AzLOS
5° elev 60° AzLOS 40 60 80 −10 −5 0 5 20° elev 40 60 80 −10 −5 0 5 SZA [°] 5° elev 120° AzLOS 40 60 80 −10 −5 0 5 SZA [°] 20° elev
Fig. 7. Impact of the relative azimuth on the NO2 SCDs calculated in MAX geometry. Here
are plotted the relative differences between the NO2SCDs calculated at 30 ◦
(upper plots), 60◦ (middle plots), and 120◦ (lower plots) AzLOS and those calculated at 90◦ AzLOS (reference case). Left and right plots correspond to results for 5◦and 20◦of elevation, respectively. Note that the IASB blue lines are superimposed to the NILU red lines.
ACPD
5, 7929–7964, 2005 Intercomparison exercise between radiative transfer models F. Hendrick et al. Title Page Abstract Introduction Conclusions References Tables Figures J I J I Back CloseFull Screen / Esc
Print Version Interactive Discussion EGU 0 0.01 0.02 0.03 0.04 0 5 10 15 20 25 30 35 Extinction coefficient [km−1] Altitude [km] 356 nm − HCHO 422 nm − NO 2
Fig. 8. Profiles of the aerosol extinction coefficient at 356 nm and 422 nm used for testing the
ACPD
5, 7929–7964, 2005 Intercomparison exercise between radiative transfer models F. Hendrick et al. Title Page Abstract Introduction Conclusions References Tables Figures J I J I Back CloseFull Screen / Esc
Print Version Interactive Discussion EGU HCHO 40 60 80 2 4 6 SZA [°] NO 2 SCD [x10 16 molec/cm 2] 90° AzLOS − 5° elev 40 60 80 2 4 6 SZA [°] 90° AzLOS − 10° elev 40 60 80 2 4 6 SZA [°] 90° AzLOS − 20° elev IASB no aero IASB aero NILU no aero NILU aero UBRE no aero UBRE aero UHEI no aero UHEI aero 40 60 80 −20 −15 −10 −5 0 5 SZA [°] Relative difference [%] 40 60 80 −20 −15 −10 −5 0 5 SZA [°] 40 60 80 −20 −15 −10 −5 0 5 SZA [°]
IASB aero−no aero NILU aero−no aero UBRE aero−no aero UHEI aero−no aero
40 60 80 2 4 6 SZA [°] HCHO SCD [x10 16 molec/cm 2] 90° AzLOS − 5° elev 40 60 80 2 4 6 SZA [°] 90° AzLOS − 10° elev 40 60 80 2 4 6 SZA [°] 90° AzLOS − 20° elev IASB no aero IASB aero NILU no aero NILU aero UBRE no aero UBRE aero UHEI no aero UHEI aero 40 60 80 −20 −15 −10 −5 0 5 SZA [°] Relative difference [%] 40 60 80 −20 −15 −10 −5 0 5 SZA [°] 40 60 80 −20 −15 −10 −5 0 5 SZA [°]
IASB aero−no aero NILU aero−no aero UBRE aero−no aero UHEI aero−no aero
Fig. 9. Impact of the aerosol scattering on simulated MAX NO2 and HCHO SCDs. For each
species, the upper plots correspond to the SCDs and the lower plots to the relative differences between SCDs calculated with and without aerosol scattering (reference: without aerosol scat-tering). Results for 90◦AzLOS and for 5◦, 10◦, and 20◦ of elevation are plotted here.
ACPD
5, 7929–7964, 2005 Intercomparison exercise between radiative transfer models F. Hendrick et al. Title Page Abstract Introduction Conclusions References Tables Figures J I J I Back CloseFull Screen / Esc
Print Version Interactive Discussion EGU HCHO 40 60 80 2 4 6 8 SZA [°] NO 2 SCD [x10 16 molec/cm 2] 90° AzLOS − 5° elev 40 60 80 2 4 6 8 SZA [°] 90° AzLOS − 10° elev 40 60 80 2 4 6 8 SZA [°] 90° AzLOS − 20° elev IASB alb 0.0 IASB alb 0.9 NILU alb 0.0 NILU alb 0.9 UBRE alb 0.0 UBRE alb 0.9 UHEI alb 0.0 UHEI alb 0.9 40 60 80 0 20 40 60 80 100 SZA [°] Relative difference [%] 40 60 80 0 20 40 60 80 100 SZA [°] 40 60 80 0 20 40 60 80 100 SZA [°]
IASB alb 0.9−alb 0.0 NILU alb 0.9−alb 0.0 UBRE alb 0.9−alb 0.0 UHEI alb 0.9−alb 0.0
40 60 80 2 4 6 8 SZA [°] HCHO SCD [x10 16 molec/cm 2] 90° AzLOS − 5° elev IASB alb 0.0 IASB alb 0.9 NILU alb 0.0 NILU alb 0.9 UBRE alb 0.0 UBRE alb 0.9 UHEI alb 0.0 UHEI alb 0.9 40 60 80 2 4 6 8 SZA [°] 90° AzLOS − 10° elev 40 60 80 2 4 6 8 SZA [°] 90° AzLOS − 20° elev 40 60 80 0 20 40 60 80 100 SZA [°] Relative difference [%] 40 60 80 0 20 40 60 80 100 SZA [°]
IASB alb 0.9−alb 0.0 NILU alb 0.9−alb 0.0 UBRE alb 0.9−alb 0.0 UHEI alb 0.9−alb 0.0
40 60 80 0 20 40 60 80 100 SZA [°]
Fig. 10. Impact of the ground albedo on simulated MAX NO2 and HCHO SCDs. For each
species, the upper plots correspond to the SCDs and the lower plots to the relative differences between SCDs calculated with ground albedo values of 0.9 and 0.0 (reference: albedo=0.0). Results for 5◦, 10◦, and 20◦of elevation and 90◦AzLOS are plotted here.