HAL Id: hal-00328206
https://hal.archives-ouvertes.fr/hal-00328206
Submitted on 21 Jun 2007HAL is a multi-disciplinary open access
archive for the deposit and dissemination of sci-entific research documents, whether they are pub-lished or not. The documents may come from teaching and research institutions in France or abroad, or from public or private research centers.
L’archive ouverte pluridisciplinaire HAL, est destinée au dépôt et à la diffusion de documents scientifiques de niveau recherche, publiés ou non, émanant des établissements d’enseignement et de recherche français ou étrangers, des laboratoires publics ou privés.
Retrieval of stratospheric and tropospheric BrO profiles
and columns using ground-based zenith-sky DOAS
observations at Harestua, 60° N
F. Hendrick, M. van Roozendael, M. P. Chipperfield, M. Dorf, Florence
Goutail, X. Yang, C. Fayt, C. Hermans, K. Pfeilsticker, Jean-Pierre
Pommereau, et al.
To cite this version:
F. Hendrick, M. van Roozendael, M. P. Chipperfield, M. Dorf, Florence Goutail, et al.. Retrieval of stratospheric and tropospheric BrO profiles and columns using ground-based zenith-sky DOAS obser-vations at Harestua, 60° N. Atmospheric Chemistry and Physics Discussions, European Geosciences Union, 2007, 7 (3), pp.8663-8708. �hal-00328206�
ACPD
7, 8663–8708, 2007
BrO profiling using ground-based UV-vis observations at 60◦N F. Hendrick et al. Title Page Abstract Introduction Conclusions References Tables Figures ◭ ◮ ◭ ◮ Back Close
Full Screen / Esc
Printer-friendly Version Interactive Discussion
EGU
Atmos. Chem. Phys. Discuss., 7, 8663–8708, 2007 www.atmos-chem-phys-discuss.net/7/8663/2007/ © Author(s) 2007. This work is licensed
under a Creative Commons License.
Atmospheric Chemistry and Physics Discussions
Retrieval of stratospheric and
tropospheric BrO profiles and columns
using ground-based zenith-sky DOAS
observations at Harestua, 60
◦
N
F. Hendrick1, M. Van Roozendael1, M. P. Chipperfield2, M. Dorf3, F. Goutail4, X. Yang5, C. Fayt1, C. Hermans1, K. Pfeilsticker3, J.-P. Pommereau4, J. A. Pyle5, N. Theys1, and M. De Mazi `ere1
1
Institut d’A ´eronomie Spatiale de Belgique (IASB-BIRA), Brussels, Belgium
2
Institute for Atmospheric Science, School of Earth and Environment, University of Leeds, Leeds, UK
3
Institute for Environmental Physics, University of Heidelberg, Heidelberg, Germany
4
Service d’A ´eronomie du CNRS, Verri `eres le Buisson, France
5
Centre for Atmospheric Science, Department of Chemistry, University of Cambridge, Cambridge, UK
Received: 1 June 2007 – Accepted: 7 June 2007 – Published: 21 June 2007 Correspondence to: F. Hendrick ([email protected])
ACPD
7, 8663–8708, 2007
BrO profiling using ground-based UV-vis observations at 60◦N F. Hendrick et al. Title Page Abstract Introduction Conclusions References Tables Figures ◭ ◮ ◭ ◮ Back Close
Full Screen / Esc
Printer-friendly Version Interactive Discussion
EGU
Abstract
A profiling algorithm based on the optimal estimation method is applied to ground-based zenith-sky UV-visible measurements from Harestua, Southern Norway (60◦N, 11◦E) in order to retrieve BrO vertical profiles. The sensitivity of the zenith-sky ob-servations to the tropospheric BrO detection is increased by using for the spectral
5
analysis a constant reference spectrum corresponding to clear-sky noon summer con-ditions. The information content and retrieval errors are characterized and it is shown that the retrieved stratospheric profiles and total columns are consistent with correlative balloon and satellite observations, respectively. Tropospheric BrO columns are derived from profiles retrieved at 80◦solar zenith angle during sunrise and sunset for the 2000–
10
2006 period. They show a marked seasonality with mean column value ranging from 1.52±0.51×10¹³molec/cm2in late winter/early spring to 0.92±0.31×10¹³molec/cm2in summer, which corresponds to 1.0±0.3 and 0.6±0.2 pptv, respectively, if we assume that BrO is uniformly mixed in the troposphere. These column values are also con-sistent with previous estimates made from balloon, satellite, and other ground-based
15
observations. Daytime (10h30 local time) tropospheric BrO columns are compared to the p-TOMCAT 3-D tropospheric chemical transport model (CTM) for the 2002– 2003 period. p-TOMCAT shows a good agreement with the retrieved columns except in late winter/early spring where an underestimation by the model is obtained. This feature could be explained by the non-inclusion of sea-ice bromine sources in the
cur-20
rent version ofp-TOMCAT, which can therefore not reproduce the possible transport from the polar region to Harestua of air-masses with enhanced BrO concentration due to bromine explosion events in late winter/early spring. The corresponding daytime stratospheric BrO columns are compared to the SLIMCAT 3-D stratospheric CTM. The model run used, which assumes 21.2 pptv for the Bry loading (15 pptv for long-lived
25
bromine species + 6 extra pptv for very short-lived species (VSLS) added by a scaling of CH3Br), significantly underestimates the retrieved BrO columns. A sensitivity study shows that a good quantitative agreement can only be obtained if 8 pptv accounting for
ACPD
7, 8663–8708, 2007
BrO profiling using ground-based UV-vis observations at 60◦N F. Hendrick et al. Title Page Abstract Introduction Conclusions References Tables Figures ◭ ◮ ◭ ◮ Back Close
Full Screen / Esc
Printer-friendly Version Interactive Discussion
EGU
VSLS are added directly (and not by a scaling of CH3Br) to the SLIMCAT long-lived bromine species profile. This contribution of the VSLS to the total bromine loading is also consistent with recently published studies.
1 Introduction
Bromine monoxide (BrO) is a key atmospheric trace gas known to cause significant
5
ozone destruction in both the stratosphere and troposphere. In the stratosphere, BrO contributes to ozone depletion through its catalytic reactions with ClO, HO2, NO2, and O (e.g., Lary, 1996). At mid-latitude these catalytic cycles account for about 25% of the ozone loss while in polar regions this contribution may reach 50%, mainly through the BrO/ClO cycle (Chipperfield and Pyle, 1998; Lee et al., 2002; Sinnhuber et al.,
10
2006). BrO is also the most abundant inorganic bromine species during daytime (BrO/Bry ∼0.6 with Bry=Br+BrO+BrONO2+HBr+HOBr+BrCl). The sources of
inor-ganic bromine in the stratosphere are natural, with methyl bromide (CH3Br), and an-thropogenic with CH3Br and halons. Several studies (Pfeilsticker et al., 2000; Salawitch et al., 2005; Sinnhuber et al., 2005, WMO 2007) have suggested that the transport to
15
the stratosphere of very short-lived organic compounds like CHBr3, CH2BrCl, CHBrCl2 or CH2BrCH2Br would have a significant contribution (4 to 8 pptv) to the total strato-spheric bromine loading. This could at least partly explain inconsistencies obtained between stratospheric Bryinferred from BrO observations (between 18±3 and 21.5±3 parts per trillion by volume, pptv (e.g., Schofield et al., 2006; Dorf et al., 2006, and
20
references therein)) and the delivery of bromine to the stratosphere by the long-lived species CH3Br and halons estimated to about 15 pptv (WMO, 2003).
In the troposphere, BrO also directly affects ozone by destroying it or by reducing its production (e.g., von Glasow et al., 2004). Large BrO enhancements associated with low ozone levels have been found in spring in the polar boundary layer by
satel-25
lite and ground-based DOAS observations (e.g., Kreher et al., 1997; Wagner et al., 2001; Frieß et al., 2004). Frost flowers, which are highly saline crystals appearing on
ACPD
7, 8663–8708, 2007
BrO profiling using ground-based UV-vis observations at 60◦N F. Hendrick et al. Title Page Abstract Introduction Conclusions References Tables Figures ◭ ◮ ◭ ◮ Back Close
Full Screen / Esc
Printer-friendly Version Interactive Discussion
EGU
top of the sea ice surface, are believed to play a major role in the production of the reactive bromine at the origin of these so-called “bromine explosion events”. High BrO mixing ratios associated with low ozone levels have been also detected in the marine boundary layer (Leser et al., 2003), over salt lakes (Hebestreit et al., 1999), and in vol-canic plumes (Bobrowski et al., 2003). In the free troposphere, several satellite (e.g.,
5
Richter et al., 2002; Van Roozendael et al., 2002), balloon (Harder et al., 2000; Fitzen-berger et al., 2000), and ground-based DOAS observations (e.g., Van Roozendael et al., 2002; Schofield et al., 2004 and 2006; Theys et al., 2007), have shown evidences for the presence of a global background of tropospheric BrO. However, there are still speculations about the BrO volume mixing ratio corresponding to this background:
ac-10
cording the different observations, the tropospheric BrO vertical column amount can range from 0.3 to 3.7×10¹³ molec/cm2, corresponding to 0.2–2.3 pptv if we assume that BrO is uniformely mixed in the troposphere.
The ground-based DOAS (Differential Optical Absorption Spectroscopy) technique (Platt, 1994) has been extensively used to study and monitor ozone depletion in the
15
stratosphere and more recently in the troposphere (see H ¨onninger et al., 2004 for a comprehensive description of the different applications of the DOAS technique). A sig-nificant part of this monitoring effort has been carried out through the UV-vis network of the NDACC (Network of the Detection of Atmospheric Composition Change, formerly NDSC). The NDACC/UV-vis network consists in more than 35 spectrometers
operat-20
ing from pole to pole and providing time-series of total vertical columns of O3, NO2, and, in a near future, of BrO (further information at http://www.ndsc.ncep.noaa.gov/). Since the early 1970s, several studies have shown the ability to retrieve information on the vertical distribution of trace gas species like NO2 and O3 from ground-based zenith-sky DOAS observations (Brewer et al., 1973; Noxon, 1975; McKenzie et al.,
25
1991; Preston et al., 1997; Hendrick et al., 2004, and Denis et al., 2005). In most of the aforementioned studies, the retrieval algorithm was based on the Optimal Estima-tion Method (OEM), which is a widely used technique for solving atmospheric remote sensing inverse problems (Rodgers, 2000). In Schofield et al. (2004 and 2006), the
ACPD
7, 8663–8708, 2007
BrO profiling using ground-based UV-vis observations at 60◦N F. Hendrick et al. Title Page Abstract Introduction Conclusions References Tables Figures ◭ ◮ ◭ ◮ Back Close
Full Screen / Esc
Printer-friendly Version Interactive Discussion
EGU
OEM has been also applied to combined ground-based zenith-sky and direct sun ob-servations in order to retrieve tropospheric and stratospheric BrO columns at Lauder (45◦S) and Arrival Height (78◦S). The sensitivity to the stratosphere was provided by the zenith-sky geometry, while the direct sun geometry ensured adequate sensitivity to the troposphere. Very recently in a theoretical study, Frieß et al. (2006) used the
5
OEM to derive vertically-resolved information on atmospheric aerosols from Multi-AXis (MAX) DOAS measurements of the oxygen collision complex (O4).
Here we report on the retrieval of the vertical distribution of BrO in the atmosphere using ground-based zenith-sky DOAS observations performed during the 2000–2006 period at the NDACC station of Harestua, Southern Norway (60◦N, 11◦E). The paper
10
is divided into 6 parts. In the first part, the ground-based UV-visible observations and DOAS settings are described. Since the sensitivity of the zenith-sky measurements to the troposphere relies on the choice of an appropriate reference spectrum for the DOAS analysis, this point is extensively discussed. The second part is dedicated to the description of the profiling algorithm based on the OEM. In the third part, the BrO
15
retrievals are characterized regarding the information content, error budget, and re-trieval fit results. The consistency between BrO rere-trievals and correlative satellite and balloon data is verified in the fourth part. In the fifth part, tropospheric and strato-spheric BrO columns are derived from the retrieved profiles. The consistency of the tropospheric columns with previously published estimates is also discussed. Finally,
20
in the sixth part, the tropospheric and stratospheric columns are compared to model calculations.
2 Ground-based DOAS observations
Ground-based zenith-sky UV-visible observations have been continuously performed by IASB-BIRA at the NDACC station of Harestua since 1998. The instrument consists
25
of two zenith-sky looking grating spectrometers using cooled photodiode-array detec-tors and recording radiances in the UV and visible regions (Van Roozendael et al.,
ACPD
7, 8663–8708, 2007
BrO profiling using ground-based UV-vis observations at 60◦N F. Hendrick et al. Title Page Abstract Introduction Conclusions References Tables Figures ◭ ◮ ◭ ◮ Back Close
Full Screen / Esc
Printer-friendly Version Interactive Discussion
EGU
1998). Spectral range and resolution of the UV spectrometer used for BrO measure-ments are 330–390 nm and 0.6 nm FWHM, respectively. Measured zenith radiance spectra are analyzed using the DOAS technique (Platt, 1994). BrO differential slant column densities (DSCDs), which are the direct product of the DOAS analysis, are re-trieved in the 345–359 nm wavelength range, taking into account the spectral signature
5
of NO2, O3, O4, OClO, and the Ring effect. The BrO cross-sections are from Wilmouth et al. (1999). More details on the DOAS settings can be found in Aliwell et al. (2002) and Theys et al. (2007). It should also be noted that the instrument has been validated through several NDACC campaigns: Lauder 1992 (Hoffman et al., 1995), OHP 1996 (Roscoe et al., 1999; Aliwell et al., 2002), and Andøya 2003 (Vandaele et al., 2005).
10
In the present study, absolute BrO SCDs covering the 2000–2006 period are pro-vided as input to the profiling algorithm. These are evaluated using a constant noon summer spectrum as reference and the residual amount of BrO in the reference spec-trum (RSCD) is calculated prior to the profiling step. This is in contrast to the NO2 profile retrievals performed at Harestua (Hendrick et al., 2004) where zenith radiance
15
spectra were analyzed with respect to daily reference spectra and the NO2 RSCDs were directly fitted by the profiling algorithm. Here, a different reference spectrum is used for each year of measurement data. Clear-sky noon summer reference spectra are chosen in order to maximize the signal to noise ratio of the measurements and to minimize the residual absorption by BrO in both the troposphere and the
strato-20
sphere since the different light paths through the atmosphere and hence expected BrO absorption are smallest at noon. Therefore, the use of such constant reference spec-tra significantly enhances the sensitivity of the measurements to the tropospheric BrO content (see also Sect. 4.1).
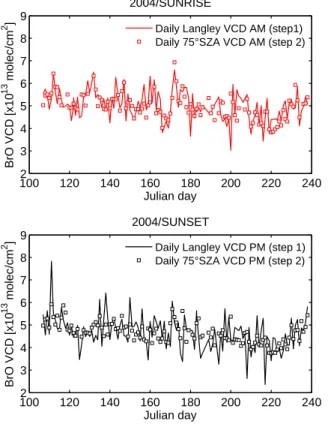
The BrO RSCDs corresponding to the selected reference spectra are estimated
us-25
ing a two-step method. The principle of this method is to use two different approaches to calculate the total BrO vertical column densities (VCDs): one approach which de-pends on the BrO photochemistry but not on the BrO RSCD (photochemically-modified Langley-plot analysis) and a second approach which depends on the BrO RSCD but
ACPD
7, 8663–8708, 2007
BrO profiling using ground-based UV-vis observations at 60◦N F. Hendrick et al. Title Page Abstract Introduction Conclusions References Tables Figures ◭ ◮ ◭ ◮ Back Close
Full Screen / Esc
Printer-friendly Version Interactive Discussion
EGU
not on the BrO photochemistry. Evidently, both approaches should give identical total BrO VCDs and this is used to constrain the BrO RSCD value. In the first step, the total BrO vertical columns (VCDs) are calculated at 75◦ solar zenith angle (SZA) for both sunrise and sunset for each day of the April-August period (where the SZA at local noon at Harestua is smaller than 50◦SZA) using a modified Langley-plot analysis
5
taking into account the diurnal variation of stratospheric BrO (see Eq. 1). 75◦ SZA is chosen to minimize the impact of a possible diurnal variation of tropospheric BrO on the Langley-plot analysis.
DSCD(θ)=−RSCD + VCDtotal,75◦SZAAMFtotal,75◦SZA(θ) (1)
where DSCD(θ) is the differential SCD at the SZA of θ, RSCD the residual amount
10
in the reference spectrum, VCDtotal,75◦SZA the total BrO VCD at 75◦ SZA (slope of the
Langley-plot), and AMFtotal,75◦SZA(θ) is the total photochemical AMF at SZA of θ and is
given by the following expression:
AMFtotal,75◦SZA(θ)=ftropoAMFtropo(θ) + (1−ftropo)AMFstrato,75◦SZA(θ) (2)
where ftropois the contribution of the troposphere to the total BrO column, AMFtropo(θ)
15
the tropospheric AMF at the SZAθ, and AMFstrato,75◦SZA(θ) is the stratospheric AMF
at the SZAθ photochemically modified with respect to 75◦ SZA (AMF
strato,75◦SZA(θ) =
SCDstrato(θ)/VCDstrato(75◦)).
Both tropospheric and stratospheric AMFs are calculated using the RT model UVspec/DISORT (see Sect. 3). In case of tropospheric AMFs, a constant BrO
concen-20
tration of 1×10¹³molec/cm3between 0 and 10 km altitude is used. Stratospheric pho-tochemical AMFs are generated using BrO diurnal variation calculated by the stacked box photochemical model PSCBOX (see Sect. 3).
The contribution of the troposphere to the total BrO column appearing in Eq. 2, ftropo, is adjusted in order to get photochemically-modified Langley plots independent of the
25
considered SZA range. Five SZA ranges (50–75◦, 50–77.5◦, 50–80◦, 50–82.5◦, and 50–85◦) and four tropospheric contributions relative to the total atmospheric BrO VCD
ACPD
7, 8663–8708, 2007
BrO profiling using ground-based UV-vis observations at 60◦N F. Hendrick et al. Title Page Abstract Introduction Conclusions References Tables Figures ◭ ◮ ◭ ◮ Back Close
Full Screen / Esc
Printer-friendly Version Interactive Discussion
EGU
(0, 20, 30, and 40%) are investigated. In Fig. 1, the ratio between the mean of BrO VCDs calculated for the 2000–2006 period in the different SZA ranges at sunset and the mean of BrO VCDs estimated in the 50–75◦ SZA range (taken as reference) is plotted as a function of the upper limit of the different SZA ranges. We see that the BrO VCD calculated for a SZA of 75◦ becomes almost independent of the SZA range
5
selected for the Langley-plot analysis when the tropospheric contribution to the total column ftropo reaches 30–40% (impact of the SZA range smaller than 5%). Therefore we have chosen to fix ftropo to 30% for the calculation of AMFtotal,75◦SZA(θ). Figure 2
illustrates the fact that a ftropo value of 30% also significantly improves the linearity of the Langley plots. It should be noted that similar results are obtained for sunrise BrO
10
data.
In the second and last step, total BrO VCDs at 75◦SZA are calculated for each day and at both sunrise and sunset using non-photochemically modified AMFs at 75◦SZA:
VCDtotal,75◦SZA=(DSCD(75◦) + RSCD)/AMFtotal(75◦) (3)
where AMFtotal(75◦) = f
tropo AMFtropo(75◦) + (1 – ftropo) AMFstrato(75◦) and with ftropo
15
fixed to 30%.
RSCD in Eq. (3) is then fitted in order to get the best match between the BrO
VCDtotal,75◦SZA calculated using Eqs. (1) and (3), respectively. Figure 3 shows an
ex-ample of fit results (obtained for the year 2004). The BrO RSCDs estimated for each reference spectrum and using three different SZA ranges (50–75◦, 50–80◦, and 50–
20
85◦) for the Langley-plot analyses (Eq. 1) are presented in Table 1. BrO RSCD values
averaged over the three SZA ranges are added to the BrO DSCDs in order to obtain the absolute BrO SCDs that are used by the retrieval algorithm.
3 Retrieval algorithm
The retrieval algorithm used here is the IASB-BIRA NO2 profiling algorithm adapted
25
ACPD
7, 8663–8708, 2007
BrO profiling using ground-based UV-vis observations at 60◦N F. Hendrick et al. Title Page Abstract Introduction Conclusions References Tables Figures ◭ ◮ ◭ ◮ Back Close
Full Screen / Esc
Printer-friendly Version Interactive Discussion
EGU
al. (2004), only the main features will be given in the present section.
The inversion method employed is the Optimal Estimation (OEM; Rodgers, 2000). In this method, a profile⌢xis retrieved given an a priori profile xa, the measurements y (here, a set of absolute BrO SCDs as a function of SZA), their respective uncertainty covariance matrices (Sa and Sε), and the matrix K of the weighting functions. Since
5
BrO is an optically thin absorber, the OEM for the linear case can be considered: ⌢
x = xa+ SaKT(KSaKT + Sε)−1(y − K xa) with K =
∂y
∂x (4)
The weighting functions indicate the sensitivity of the measurements to a change in the vertical profile. The matrix K is determined by consecutively perturbing each layer of the a priori profile and recalculating the set of measurements using the
so-10
called forward model which describes the physics of the measurements. Here, the forward model consists in the stacked box photochemical model PSCBOX (Errera and Fonteyn, 2000; Hendrick et al., 2004) coupled to the radiative transfer (RT) model UVspec/DISORT (Mayer and Kylling, 2005). A photochemical model is required to re-produce the effect of the rapid variation of the BrO concentration at twilight. It also
15
allows us to convert the retrieved profile to any SZA. The RT model is used to calculate slant column abundances from the BrO concentrations predicted by the photochemical model. PSCBOX has been described in details in Hendrick et al. (2004). Neverthe-less, it is useful to mention here that (1) PSCBOX is daily initialised at 20 independent altitude levels (between ∼10 and ∼55 km altitude) with 0 h UT pressure, temperature,
20
and chemical species profiles from the SLIMCAT 3-D chemical transport model (Chip-perfield, 1999 and 2006; see also Sect. 7), and (2) Updated kinetic and photochemical data are taken from the JPL 2006 compilation (Sander et al., 2006). Concerning the RT model UVspec/DISORT, it includes a treatment for the multiple scattering in a pseudo-spherical geometry approximation. The variation of the BrO concentration along the
25
light-path is also taken into account since it has a large impact on the calculation of the slant column densities (Sinnhuber et al., 2002). The wavelength for RT calculations was fixed to 352 nm. More details on the RT model UVspec/DISORT can be found in
ACPD
7, 8663–8708, 2007
BrO profiling using ground-based UV-vis observations at 60◦N F. Hendrick et al. Title Page Abstract Introduction Conclusions References Tables Figures ◭ ◮ ◭ ◮ Back Close
Full Screen / Esc
Printer-friendly Version Interactive Discussion
EGU
Hendrick et al. (2004) and Mayer and Kylling (2005). Both photochemical and RT mod-els have been validated through several comparison exercises (Hendrick et al., 2000 and 2006; Wagner et al., 2007).
The present retrieval problem is ill-conditioned for two reasons: (1) There exists more elements in the vector⌢x than independent measurements, and (2) the error of some
5
components of the measurements vector y can be large enough that these compo-nents become useless (null space of the measurements, Rodgers, 2000). Points (1) and (2) lead to the lack of unique solution to the retrieval problem and therefore, a pri-ori constraints are necessary to reject unrealistic profiles that may be consistent with the measurements. In the present study, the a priori profile (defined as concentration)
10
is constructed as follows: in the stratosphere, the output of the photochemical model PSCBOX at the SZA of the retrieval is taken as a priori. It should be noted that the BrO diurnal variation is also provided as a priori information (output of the photochem-ical model PSCBOX) and is not directly retrieved by the algorithm as in Schofield et al. (2004 and 2006). Due to the uncertainties on the vertical distribution and the
diur-15
nal variation of BrO in the troposphere, a constant tropospheric BrO concentration of around 1×10⁷molec/cm3 is chosen for the construction of the a priori profile at local noon and the diurnal variation of this profile is assumed to be the same as the one given by the photochemical model PSCBOX in the lower stratosphere. Our approach for the construction of the a priori tropospheric profile is similar to the one used by
20
Schofield et al. (2004).
The measurement covariance matrix Sε is constructed by placing the statistical er-rors on the BrO DOAS fitting along its diagonal, due to the domination of the DOAS fitting residuals by the random noise of the detector. The a priori covariance matrix Sa is generally not known and often acts as a tuning parameter (Schofield et al., 2004). A
25
variance value of 85% for the stratospheric part of the a priori profile is placed along the diagonal of Sa. This empirically determined value is found as the threshold value above which undesired oscillations in the retrieved profiles can occur. In the troposphere, a variance value of 100% is chosen in order to reduce the weight of a priori information
ACPD
7, 8663–8708, 2007
BrO profiling using ground-based UV-vis observations at 60◦N F. Hendrick et al. Title Page Abstract Introduction Conclusions References Tables Figures ◭ ◮ ◭ ◮ Back Close
Full Screen / Esc
Printer-friendly Version Interactive Discussion
EGU
and therefore to give the algorithm large freedom to move away from the a priori pro-file. Sa also contains extra-diagonal terms accounting for correlations between BrO values at different altitude levels. These terms were added as Gaussian functions as in Hendrick et al. (2004).
4 Characterisation of the retrievals 5
4.1 Information content analysis
The averaging kernel matrix A is a key parameter in the characterization of the re-trievals. The averaging kernels – which are the rows of the A matrix – express the sensitivity of the retrieved profile⌢xwith respect to the true atmospheric profile x and are derived using the following expression (Rodgers, 2000):
10 A = ∂ ⌢ x ∂x = (K TS−1 ε K + S−1a )−1KTS−1ε K. (5)
Typical BrO ground-based UV-visible averaging kernels are shown in Fig. 4. The full width at half maximum (FWHM) of a given averaging kernel provides a rough estimate of the vertical resolution at the target. From the examination of the averaging kernels corresponding to several dozens of BrO retrievals, it is found that the vertical resolution
15
is 8–10 km at best, the best resolution being obtained below 25 km altitude. The trace of the averaging kernels matrix gives the number of degrees of freedom for the signal, which is an estimate of the number of independent pieces of information contained in the measurements (Rodgers, 2000). Typical values for the trace of A are close to 3.5. That means that there are roughly 3 independent pieces of information in the
20
measurements. Figure 4 also shows that the averaging kernels in the altitude range corresponding to the troposphere peak reasonably at their nominal altitude, indicating that our BrO retrievals are effectively sensitive to the troposphere.
ACPD
7, 8663–8708, 2007
BrO profiling using ground-based UV-vis observations at 60◦N F. Hendrick et al. Title Page Abstract Introduction Conclusions References Tables Figures ◭ ◮ ◭ ◮ Back Close
Full Screen / Esc
Printer-friendly Version Interactive Discussion
EGU
Tests on the impact of the a priori profile on the retrieval can also give qualitative indications concerning the information content. Two tests were performed: in the first one, the standard a priori profile was multiplied by a factor of two and in the second test, the shape of the a priori profile was modified: the standard a priori profile peaking at 15 km altitude was replaced by a new a priori profile peaking at 19 km. The results
5
of these tests, presented in Fig. 5, show that the impact of the a priori profile is limited: the profiles retrieved using the modified a priori profiles are similar to those retrieved with the standard a priori profiles. This indicates that the information on the vertical distribution of BrO contained in the measurements is in fact significant.
4.2 Error budget
10
The error analysis is performed as for the NO2 profile retrieval at Harestua (see Hen-drick et al., 2004). In brief, the total retrieval error is given by the sum of three errors: the smoothing error, the measurement noise (also called the measurement error), and the forward model parameter error. The smoothing error, which is the largest source of uncertainty, is calculated here from the a priori covariance matrix used in the retrieval
15
(see Sect. 3). The reason for this is that a realistic covariance matrix of the true BrO profile can not be estimated because, in contrast to NO2, a large set of measured BrO profiles does not exist so far. The measurement error is computed using the mea-surement covariance matrix described in Sect. 3 (statistical errors on the DOAS fitting on the diagonal and extra-diagonal terms set to zero). Concerning the forward model
20
parameter error, we use in the present study, the estimation derived by Schofield et al. (2004 and 2006). They found that the contribution of this error to the total retrieval error is about 12% at 80◦SZA for both tropospheric and stratospheric columns and can be mainly attributed to the uncertainty on the temperature profile. In a first approxima-tion, a contribution of 12% of the total retrieval error accounting for the forward model
25
parameter error is applied on the whole altitude range.
Smoothing and measurement errors on tropospheric and stratospheric BrO columns can also be derived using the column operator g (Barret et al., 2003; Schofield et
ACPD
7, 8663–8708, 2007
BrO profiling using ground-based UV-vis observations at 60◦N F. Hendrick et al. Title Page Abstract Introduction Conclusions References Tables Figures ◭ ◮ ◭ ◮ Back Close
Full Screen / Esc
Printer-friendly Version Interactive Discussion
EGU
al., 2004). The matrix g sums over the relevant altitude in the state vector to yield tropospheric and stratospheric columns. The covariance matrices Sc associated to the smoothing and measurement errors on the retrieved column quantities can be ex-pressed as:
Sc = gSgt 5
where S is the smoothing or measurement error covariance matrix and t indicates the transpose of the g matrix. Concerning the forward model parameter error on BrO columns, it is fixed to 12% of the total retrieval error as mentioned above. The mean smoothing, measurement, forward model parameter, and total retrieval errors of the stratospheric and tropospheric BrO columns retrieved at 80◦ SZA for the 2000–2006
10
period (see Sect. 6) are presented in Table 2. This table gives also the systematic errors related to the uncertainties on the BrO cross-sections and residual amount of BrO in the reference spectra (RSCD). The first systematic error is taken from Theys et al. (2007) while the second one is estimated from the mean and standard deviation of BrO RSCD for the year 2006 where the largest uncertainty is obtained (see Table 1).
15
The total retrieval error and the systematic errors are then added in quadrature in order to give the total error on the retrieved tropospheric and stratospheric BrO columns.
4.3 Retrieval fit results
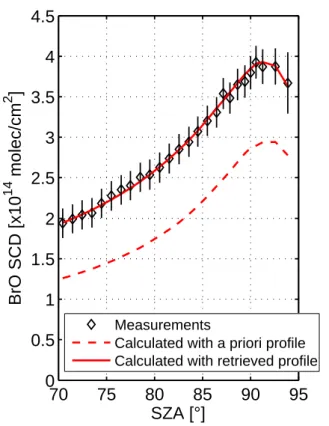
BrO retrievals are also quality-checked by comparing the measured SCDs to those calculated using the retrieved profiles. Figure 6 shows an example where the retrieval
20
fit is in good agreement with the measurements. In practice, the selection of BrO re-trievals is based on the residual of the retrieval fit: all the rere-trievals with a residual larger than a threshold value (1×10¹³molec/cm2) are rejected. This method of selection is roughly equivalent to a selection of clear-sky days based on the diurnal variation of O4. The measured BrO SCDs corresponding to the rejected retrievals display
gen-25
erally a strongly unsmoothed variation during twilight due to either a changing cloud cover or strong spectral interferences (e.g., O4, NO2, and Ring interferences).
ACPD
7, 8663–8708, 2007
BrO profiling using ground-based UV-vis observations at 60◦N F. Hendrick et al. Title Page Abstract Introduction Conclusions References Tables Figures ◭ ◮ ◭ ◮ Back Close
Full Screen / Esc
Printer-friendly Version Interactive Discussion
EGU
trieval residuals larger than the threshold value are often observed in fall and winter. There are several possible reasons to explain this feature: (1) The probability for having a changing cloud cover over Harestua is larger during this period. (2) Photochemical conditions can also change rapidly due to dynamical effects (Harestua is often close to or at the vortex edge) and therefore providing the BrO diurnal variation as an a priori
5
information as in our profiling algorithm (see Sect. 3) could be a limitation and lead to high retrieval residuals. (3) During this period, the SZA range corresponding to the BrO SCD is smaller (SZA at local noon can reach 84◦ at Harestua) and therefore the
information content of the measurements is somewhat lower than during summer. For these reasons, we have decided to retrieve BrO profiles only from the ground-based
10
DOAS measurements performed from mid-February to the end of October.
5 Verification of the retrievals
The consistency between our BrO profile retrievals and correlative data has been ver-ified. For this purpose, the stratospheric part of the retrieved profiles is compared to SAOZ and LPMA/DOAS balloon profiles and the total BrO columns integrated from the
15
retrieved profiles to GOME and SCIAMACHY nadir observations. 5.1 Comparison to SAOZ and LPMA/DOAS balloon profiles
The SAOZ-BrO balloon experiment is designed for measuring BrO by solar occultation in the 320–400 nm spectral range during the afternoon ascent and from float at about 30 km (solar occultation). The spectral data are analyzed by the DOAS method and
20
profile retrievals are performed using the onion peeling technique. The BrO fitting win-dow is fixed to 332–370 nm. More details on the instrument and the retrieval algorithm can be found in Pundt et al. (2002) and Dorf et al. (2006b).
As for the SAOZ balloon, the LPMA/DOAS balloon uses the solar occultation tech-nique. The LPMA/DOAS payload consists of three spectrometers (two grating and
ACPD
7, 8663–8708, 2007
BrO profiling using ground-based UV-vis observations at 60◦N F. Hendrick et al. Title Page Abstract Introduction Conclusions References Tables Figures ◭ ◮ ◭ ◮ Back Close
Full Screen / Esc
Printer-friendly Version Interactive Discussion
EGU
one FT) enabling the analysis of direct sunlight from the UV to the mid-IR. The BrO DOAS evaluation is performed in the 346–360 nm wavelength range and vertical pro-files are retrieved using the Optimal Estimation Method. A detailed description of the LPMA/DOAS BrO measurements can be found in Harder et al. (1998 and 2000) and Dorf et al. (2006b).
5
For the present comparisons, all the SAOZ and DOAS balloon flights originated from Kiruna (68◦N, 21◦E) in Sweden and only ascent data are taken into account. The selected flights are the following: 12 August 2002 and 16 March 2003 for SAOZ and 23 March 2003 and 24 March 2004 for LPMA/DOAS. It should be noted that for com-parison in March, an examination of the potential vorticity (PV) maps at 475 K show
10
that the Harestua and Kiruna stations are inside the polar vortex on 16 March 2003 and outside on 23 March 2003 and 24 March 2004. Ground-based BrO profiles are retrieved at 87◦ SZA (SAOZ 12 August 2002), 86◦ SZA (SAOZ 16 March 2003), and 80◦ SZA (LPMA/DOAS 23 March 2003 and 24 March 2004). These SZA values are
reached when the balloons are at an altitude of about 20 km. Due to the variation of the
15
SZA during the ascent of the balloon, a photochemical correction, calculated by using the photochemical model PSCBOX, is applied to the ground-based profiles in order to take into account this photochemical effect.
Since ground-based and balloon profiles have a significantly different vertical reso-lution (about 1 km and 8–10 km for balloon and ground-based profiles, respectively),
20
the balloon profiles have to be degraded to the vertical resolution of the ground-based retrievals in order to allow direct comparison (Hendrick et al., 2004). This is done by convolving the balloon profiles with the ground-based averaging kernels using the following expression (Connor et al., 2004; Hendrick et al., 2004):
xsb= xa+ A(xb− xa). (6)
25
where A is the ground-based averaging kernels matrix, xa is the a priori profile used in the ground-based retrieval, xb is the balloon profile, and xsb is the smoothed or convolved balloon profile and represents what the retrieval should produce assuming that xbis the true profile and that the only source of error is the smoothing error.
ACPD
7, 8663–8708, 2007
BrO profiling using ground-based UV-vis observations at 60◦N F. Hendrick et al. Title Page Abstract Introduction Conclusions References Tables Figures ◭ ◮ ◭ ◮ Back Close
Full Screen / Esc
Printer-friendly Version Interactive Discussion
EGU
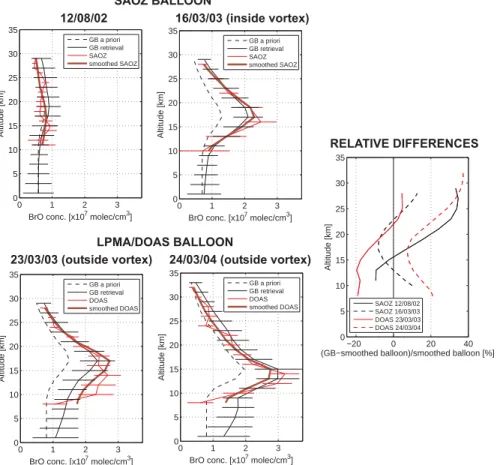
The results of the comparisons between ground-based BrO retrievals and SAOZ and LPMA/DOAS balloon profiles are shown in Fig. 7. Concerning the comparisons with SAOZ balloon profiles, a good agreement is obtained on 16 March 2003 with a relative difference smaller than 12% over the entire 10–28 km altitude range. For the 12 August 2002 case, the ground-based retrieval overestimates the SAOZ profile in the 17–29 km
5
altitude range, with a maximum relative difference value of 35% obtained around 25 km altitude. However, the observed differences are within the error bars of the ground-based profile. Concerning the comparison with the LPMA/DOAS balloon profile on 23 March 2003, an underestimation of about 20% by the ground-based retrieval is observed between 8 and 15 km altitude, both profiles differing by less than 10% (in
10
absolute value) above 18 km. In case of the 24 March 2004 comparison, the ground-based BrO retrieval systematically overestimates the LPMA/DOAS profile in the entire 8–32 km altitude range, with relative difference values between 7 and 21% in the 8– 21 km altitude range and between 21 and 37% above 21 km. However, the observed differences are again within the error bars of the ground-based profile.
15
The 11-28 km BrO partial column amounts calculated by integrating the ground-based and smoothed SAOZ and LPMA/DOAS balloon profiles have been also com-pared. The partial column amounts and relative differences are presented in Table 3. The comparison gives a satisfying agreement, with partial column values differing respectively by +17% (SAOZ 12 August 2002), –4% (SAOZ 16 March 2003), –10%
20
(LPMA/DOAS 23 March 2003), and +14% (LPMA/DOAS 24 March 2004). The over-all conclusion of these comparisons (profiles and partial columns) is that the strato-spheric part of the ground-based BrO profiles show a good consistency with SAOZ and LPMA/DOAS balloon profiles.
5.2 Comparison to GOME and SCIAMACHY nadir observations
25
GOME (Global Ozone Monitoring Instrument) is a nadir-viewing spectrometer that measures solar radiation back-scattered from the atmosphere in the 240–790 nm wave-length range (Burrows et al., 1999). The instrument, aboard the ESA/ERS-2 satellite
ACPD
7, 8663–8708, 2007
BrO profiling using ground-based UV-vis observations at 60◦N F. Hendrick et al. Title Page Abstract Introduction Conclusions References Tables Figures ◭ ◮ ◭ ◮ Back Close
Full Screen / Esc
Printer-friendly Version Interactive Discussion
EGU
launched in April 1995, flies in a sun-synchronous orbit at an altitude of 780 km with a local crossing time at the equator of about 10h30. The measured nadir radiances are analysed using the DOAS technique. The GOME BrO data used for the verifi-cation of the ground-based BrO retrievals are the total columns retrieved by the sci-entific (“non-operational”) spectral inversion algorithm developed at IASB-BIRA. The
5
DOAS settings follow the recommendations of Aliwell et al. (2002) including a wave-length range from 345 to 359 nm and BrO absorption cross-sections from Wilmouth et al. (1999). A detailed description of the inversion algorithm and DOAS settings can be found in Van Roozendael et al. (1999) and at the following web page:http://www.oma.
be/BIRA-IASB/Molecules/BrO/Documents/BIRA SCIA BrO ADD v1r1.pdf.
10
SCIAMACHY (SCanning Imaging Absorption spectroMeter for Atmospheric CHar-tographY) is the successor of GOME and was launched in March 2002 aboard the ESA/ENVISAT platform. As for ERS-2, ENVISAT flies in a sun-synchronous orbit and the local crossing time at the equator is about 10h00. The SCIAMACHY imaging spec-trometer measures the solar radiation transmitted, back-scattered and reflected from
15
the atmosphere in the 240–2400 nm wavelength range and in three different viewing geometries: nadir, limb, and sun/moon occultations, which yield total column values as well as vertical profiles. As for GOME, the nadir radiances are analysed using the sci-entific DOAS algorithm developed at IASB-BIRA. The settings are similar to those used for GOME except the wavelength range which is now 336–347 nm. The main raison
20
for this is the presence of a strong anomaly of the polarization response of the SCIA-MACHY instrument centered in the middle of the wavelength interval used for BrO re-trieval from GOME (346–359 nm). Due to this change in the BrO fitting window, the BrO absorption cross-sections set is taken here from Wahner et al. (1988). Because reliable SCIAMACHY solar spectra were unavailable during the first year of measurements,
25
an earthshine radiance selected daily around equator is used as control spectrum for the BrO slant column retrieval. The corresponding equatorial off-set is assumed to be 7.5×10¹³molec/cm2, which is in good consistency with test BrO retrievals made around the equator using daily sun reference spectra (see also Theys et al., 2007).
ACPD
7, 8663–8708, 2007
BrO profiling using ground-based UV-vis observations at 60◦N F. Hendrick et al. Title Page Abstract Introduction Conclusions References Tables Figures ◭ ◮ ◭ ◮ Back Close
Full Screen / Esc
Printer-friendly Version Interactive Discussion
EGU
More details on the IASB-BIRA SCIAMACHY total BrO columns can be found athttp://
www.oma.be/BIRA-IASB/Molecules/BrO/Documents/BIRA SCIA BrO ADD v1r1.pdf. Air mass factors (AMFs) are needed to convert the GOME and SCIAMACHY nadir BrO slant column densities, which are the direct product of the DOAS analysis, into vertical columns. AMFs are calculated using the UVspec/DISORT RT model
account-5
ing for the SZA as well as the line-of-sight angle of the GOME and SCIAMACHY nadir observations. The ground-based BrO profiles retrieved at the SZA corresponding to the satellites overpass time (about 10h30 local time) are also provided as input to the RT model in order to properly take into account the tropospheric contribution to the total BrO columns in the AMF calculation.
10
Monthly means of ground-based UV-visible, GOME, and SCIAMACHY nadir total BrO columns for the 2000–2006 period are presented in Fig. 8. Mean GOME and SCIAMACHY BrO column amounts are calculated using all pixels falling within a radius of 200 km around Harestua. Ground-based UV-visible retrievals show good consis-tency with both satellite measurements in terms of seasonal variation and inter-annual
15
variability. More quantitatively, a good agreement is observed between ground-based and GOME total BrO columns with a relative difference generally below 15% (in ab-solute values), the largest discrepancy being obtained in spring 2000 with an under-estimation of 20% by ground-based retrievals. A similar agreement is observed with SCIAMACHY nadir columns except in summer where SCIAMACHY tends to
system-20
atically underestimate both ground-based and GOME data.
6 Tropospheric and stratospheric BrO columns
Tropospheric and stratospheric BrO columns are calculated by integrating the retrieved profiles in the appropriate altitude ranges. For each day, the tropopause height is estimated using NCEP pressure and temperature profiles and by adopting the WMO
25
definition of the tropopause: height of the base of a layer at least 2 km thick, in which the rate of decrease of temperature with height is less than 2 K/km.
ACPD
7, 8663–8708, 2007
BrO profiling using ground-based UV-vis observations at 60◦N F. Hendrick et al. Title Page Abstract Introduction Conclusions References Tables Figures ◭ ◮ ◭ ◮ Back Close
Full Screen / Esc
Printer-friendly Version Interactive Discussion
EGU
Tropospheric and stratospheric BrO columns corresponding to 80◦SZA sunrise and
sunset for the 2000–2006 period are shown in Fig. 9. Both tropospheric and strato-spheric columns display a marked seasonality with larger column values in late win-ter/early spring and fall than in summer (U-shape). Tropospheric BrO columns aver-aged for late winter/early spring (15 February–30 April), late spring-summer (1 May–15
5
August), and late summer-early fall conditions are presented in Table 4. In late win-ter/early spring, the mean tropospheric BrO column is slightly larger at sunrise than at sunset with values of 1.72±0.60 and 1.41±0.42×10¹³ molec/cm2, respectively. As-suming that BrO is uniformly mixed in the troposphere, these column values corre-spond to volume mixing ratios of 1.1±0.4 and 0.9±0.3 pptv, respectively. Smaller
col-10
umn amounts are obtained in both late spring-summer and late summer-early fall, with values of about 0.92±0.31 and 1.03±0.37×10¹³ molec/cm2, respectively (both corre-sponding to a BrO volume mixing ratio of 0.6±0.2 pptv). For these periods, column amounts are also similar at sunrise and sunset.
Our estimates of the tropospheric BrO column amount show a good consistency
15
with previously published studies. Harder et al. (1998 and 2000), Richter et al. (2002) and Van Roozendael et al. (2002) found that BrO measurements from the GOME satellite instrument are consistent with a tropospheric BrO column ranging from 1 to 4×10¹³ molec/cm2. Using the GOME successor SCIAMACHY, Sinnhuber et al. (2005) have suggested that the average global tropospheric BrO column below 15 km altitude
20
is about 2–4×10¹³molec/cm2. Balloon DOAS measurements performed by Fitzen-berger et al. (2000) revealed that the tropospheric BrO amount could range from 0.6 to 3.7×10¹³ molec/cm2. Tropospheric BrO columns have been also estimated using ground-based DOAS observations. Schofield et al. (2004 and 2006) found “background” tropospheric column values lower than the other estimates (about 0.2–
25
0.3×10¹³molec/cm2) using combined zenith-sky and direct sun DOAS measurements in Lauder (45◦S) and Arrival Heights (78◦S). In contrast, Theys et al. (2007) inferred tro-pospheric BrO columns of about 1.1×10¹³ molec/cm2from ground-based MAX-DOAS measurements in Reunion Island (21◦S), consistent with the abovementioned
ACPD
7, 8663–8708, 2007
BrO profiling using ground-based UV-vis observations at 60◦N F. Hendrick et al. Title Page Abstract Introduction Conclusions References Tables Figures ◭ ◮ ◭ ◮ Back Close
Full Screen / Esc
Printer-friendly Version Interactive Discussion
EGU
lite and balloon estimates and with our tropospheric columns retrieved at Harestua in late spring-summer. Also from ground-based MAX-DOAS measurements in the trop-ics (Nairobi, 1◦S), Fietkau et al. (2007) have derived slightly lower tropospheric BrO
column amounts, in the range of 0.4–0.75×10¹³molec/cm2.
7 Comparison to model calculations 5
Stratospheric and tropospheric BrO columns calculated from profiles retrieved at the GOME overpass time (∼10h30 local time) are compared to the SLIMCAT stratospheric andp-TOMCAT tropospheric CTMs, respectively. At Harestua, 10h30 local time cor-responds to about 74◦ SZA in mid-February and 39◦ SZA in mid-June. It should be
noted that the choice of the GOME overpass time for the comparison (and not 80◦SZA
10
as in Sect. 6) allows us to avoid having to interpolate through the output values of the tropospheric CTM (see below).
The p-TOMCAT (parallel-Tropospheric Off-Line Model of Chemistry and Transport) model is an off-line three-dimensional tropospheric CTM with a detailed bromine chem-istry scheme that contains gas-phase reactions and heterogeneous reactions on cloud
15
particles and aerosols. It includes bromine emissions from sea salt and bromocarbon photo-oxidation as well as bromine removal from dry and wet deposition (see Yang et al., 2005 for a detailed description of this version ofp-TOMCAT). For the present study, the model was run for the years 2002 and 2003 at a horizontal spatial resolution of 5.6◦
×5.6◦ on 31 levels from the surface up to 10 hPa using winds and temperature
20
derived from the ECMWF (European Centre for Medium-Range Weather Forecasts) operational analysis. The output frequency is fixed to 2 hours from 0 h UT and the model output at 10 h UT (∼10h45 local time) is used for the comparison. The tropo-spheric BrO column amounts are linearly interpolated from the closest model grids to Harestua, centered at 63.68◦N, 11.25◦E and 58.14◦N, 11.25◦E. Concerning bromine
25
emission from sea salt, the scenario used for sea-salt production is called SMI and involves particles with dry radii between 0.1 and 10µm (Yang et al., 2005). Two
differ-ACPD
7, 8663–8708, 2007
BrO profiling using ground-based UV-vis observations at 60◦N F. Hendrick et al. Title Page Abstract Introduction Conclusions References Tables Figures ◭ ◮ ◭ ◮ Back Close
Full Screen / Esc
Printer-friendly Version Interactive Discussion
EGU
ent model runs are considered in our study: In run 1, the bromine depletion factor DF, which represents the fraction of bromine in sea-salt aerosols released in gaseous form into the atmosphere, is constant and fixed to 50%. In the second run (run 2), the HBr + HOBr reaction on aerosols is included since this reaction can be important in the troposphere and may increase the BrO level. The DF factor is also modified compared
5
to run 1 and is now aerosol-size dependent, based on measurements (Sander et al., 2003). This is believed to produce less Br flux from large particles. It should be noted that the current version of thep-TOMCAT model does not include bromine emission from sea-ice (snowpack and frost flowers), which is likely to be an important bromine source in the polar region (e.g., Kaleschke et al., 2004; Simpson et al., 2005).
10
For the stratosphere, we use the SLIMCAT 3D-CTM (Chipperfield, 1999 and 2006), and more particularly run D from this model (Feng et al., 2007). In this run, the CTM was integrated with a horizontal resolution of 7.5◦×7.5◦ on 24 levels from the surface to about 55 km altitude. The model was forced using ECMWF analyses and the sim-ulation started on 1 January 1977. The halogen loading was specified from observed
15
tropospheric CH3Br and halons (WMO, 2003) with an additional 6 pptv contribution from very short-lived species (VSLS), added by an empirical scaling of CH3Br. Ac-cordingly, the total stratospheric bromine loading around 2002 is 21.2 pptv. Output was saved at 00:00 UT every two days and linearly interpolated at the location of Harestua. This output served as input to our stacked box photochemical model PSCBOX in order
20
to calculate the stratospheric BrO profile corresponding to 10h30 local time.
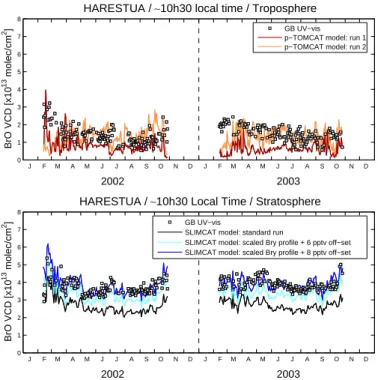
The comparison between ground-based and modeled BrO columns is presented in Fig. 10 for the 2002–2003 period. Concerning the stratosphere, the model run used significantly underestimates (by maximum 30%) the ground-based UV-visible columns. This feature can be partly explained by the fact that in this model run, CH3Br is scaled
25
in order to represent all bromine source gases, including short-lived sources. Since these source gases are decomposed faster than methyl bromide, this can lead to an underestimation of the Bryvolume mixing ratio in the lower stratosphere and therefore of the integrated BrO vertical column. As in Theys et al. (2007), this effect is
ACPD
7, 8663–8708, 2007
BrO profiling using ground-based UV-vis observations at 60◦N F. Hendrick et al. Title Page Abstract Introduction Conclusions References Tables Figures ◭ ◮ ◭ ◮ Back Close
Full Screen / Esc
Printer-friendly Version Interactive Discussion
EGU
tigated by considering the case where the short-lived species are totally converted to Bryat the tropopause. In order to achieve this, we have applied an offset of 6 and 8 pptv directly to the SLIMCAT Bryprofile scaled by the ratio between the contribution of long-lived bromine sources (15 pptv) and the total bromine loading assumed in SLIMCAT (21.2 pptv). The different Bry profiles are plotted in Fig. 11. We see from Fig. 10 that
5
a good agreement is obtained between the modeled and ground-based BrO columns when a contribution of 8 pptv from short-lived species is assumed in the model, in good consistency with previous studies (Pfeilsticker et al., 2000; Salawitch, 2005; Dorf et al., 2006a). This also confirms the findings of Feng et al. (2007), who have tested different methods of implementing the bromine source gases in the SLIMCAT model and found
10
that the agreement between model and balloon data is significantly improved when accounting explicitly for the short-lived source gases.
Concerning the troposphere, run 1 of thep-TOMCAT model systematically underes-timates the ground-based BrO columns (with differences sometimes larger than 50%). Using run 2 (also with SMI scenario for sea-salt production but including HOBr + HBr
15
reaction on aerosols and aerosol-size dependent DF factor), the agreement is greatly improved except in February and March where a significant underestimation by the model still persists. The non-inclusion in the current version of the model of bromine emissions from frost flowers and snowpack might possibly explain this feature since during this period, air masses with enhanced BrO concentration due to bromine
explo-20
sion events could be transported from the polar region to Harestua. Finally, Fig. 10 also shows that thep-TOMCAT model reproduces reasonably well some of the short-term variations in the ground-based BrO columns, especially in 2003.
8 Conclusions
BrO vertical profiles have been retrieved using ground-based zenith-sky DOAS
obser-25
vations performed at the NDACC station of Harestua (60◦N) during the 2000–2006 period. The sensitivity to the tropospheric detection of BrO by zenith-sky UV-visible
ACPD
7, 8663–8708, 2007
BrO profiling using ground-based UV-vis observations at 60◦N F. Hendrick et al. Title Page Abstract Introduction Conclusions References Tables Figures ◭ ◮ ◭ ◮ Back Close
Full Screen / Esc
Printer-friendly Version Interactive Discussion
EGU
observations has been increased by choosing for each year a constant noon summer reference spectrum for the DOAS analysis. The consistency between our BrO pro-file retrievals and correlative data have been verified and a good agreement has been obtained with SAOZ and LPMA/DOAS balloon profiles (stratospheric part of the re-trieved profiles) and with GOME and SCIAMACHY nadir observations (total columns
5
integrated from the retrieved profiles). The error budget and the information content related to the retrievals have been also carefully characterized and the impact of the a priori profile on the retrievals has been investigated.
Tropospheric BrO column amounts integrated from the profiles retrieved at 80◦SZA
and averaged for the 2000-2006 period range from 1.52±0.51×10¹³molec/cm2in late
10
winter/early spring to 0.92±0.31×10¹³molec/cm2in summer. Assuming that BrO is uni-formly mixed in the troposphere, these values correspond to 1.0±0.3 and 0.6±0.2 pptv, respectively, and are consistent with previously published estimates inferred from bal-loon, satellite, and ground-based UV-vis observations. Daytime (10h30 local time) tro-pospheric and stratospheric BrO columns have been also compared to thep-TOMCAT
15
and SLIMCAT 3-D CTMs for the 2002-2003 period. In case of thep-TOMCAT model, two different runs have been considered: run 1 with SMI scenario for sea-salt produc-tion and a constant bromine depleproduc-tion factor (DF =50%) and run 2 with the same SMI scenario but including the HOBr + HBr reaction on aerosols and an aerosol-size de-pendent DF factor based on measurements. Run 1 systematically underestimates the
20
observations while run 2 shows a good quantitative agreement with the ground-based tropospheric columns and reproduces well some of their short-term variations, espe-cially in 2003. However, a systematic underestimation is obtained for February–March. The non-inclusion in the current version ofp-TOMCAT of frost flowers and snowpack as bromine sources could explain this feature. In the stratosphere, the retrieved
ground-25
based BrO columns have been compared to the SLIMCAT model. The model run used significantly underestimates the retrieved BrO columns. This feature can be partly ex-plained by the fact that in this model run, CH3Br is scaled in order to represent all bromine source gases, including short-lived sources. Since these source gases are
ACPD
7, 8663–8708, 2007
BrO profiling using ground-based UV-vis observations at 60◦N F. Hendrick et al. Title Page Abstract Introduction Conclusions References Tables Figures ◭ ◮ ◭ ◮ Back Close
Full Screen / Esc
Printer-friendly Version Interactive Discussion
EGU
decomposed faster than methyl bromide, this can lead to an underestimation of the Bry volume mixing ratio in the lower stratosphere and therefore of the integrated BrO vertical column. We have shown that a good quantitative agreement can be obtained if 8 pptv, accounting for very short-lived bromine species, are added directly to the SLIM-CAT long-lived bromine source gases profile, which is equivalent to assume that the
5
short-lived species are totally converted to Bry at the tropopause. This contribution of 8 pptv for VSLS to the total bromine loading is consistent with recently published studies (e.g., WMO 2007).
Acknowledgements. This research was financially supported by the Belgian Prodex NOy-Bry.
References 10
Aliwell, S. R., Van Roozendael, M., Johnston, P. V., Richter, A., Wagner, T., Arlander, D. W., Burrows, J. P., Fish, D. J., Jones, R. L., Tørnkvist, K. K., Lambert, J.-C., Pfeilsticker, K., and Pundt, I.: Analysis for BrO in zenith-sky spectra: An intercomparison exercise for analysis improvement, J. Geophys. Res., 107(D14), 4199, doi:10.1029/2001JD000329, 2002. Barret, B., De Mazi `ere, M., and Mahieu, E.: Ground-based FTIR measurements of CO from 15
the Jungfraujoch : characterisation and comparison with in situ surface and MOPITT data, Atmos. Chem. Phys., 3, 2217–2223, 2003,
http://www.atmos-chem-phys.net/3/2217/2003/.
Bobrowski, N., H ¨onninger, G., Galle, B., and Platt, U.: Detection of bromine monoxide in a volcanic plume, Nature, 423, 273–276, 2003.
20
Brewer, A. W., McElroy, C. T., and Kerr, J. B.: Nitrogen dioxide concentration in the atmosphere, Nature, 246, 129–133, 1973.
Burrows, J. P., Weber, M., Buchwitz, M., Rozanov, V.V., Ladst ¨adter-Weissenmayer, A., Richter, A., de Beek, R., Hoogen, R., Bramstedt, K., Eichmann, K.-U., Eisinger, M., and Perner, D.: The Global Ozone Monitoring Experiment (GOME): Mission Concept and First Scientific 25
Results, J. Atm. Sci., 56, 151–175, 1999.
Chipperfield, M. P., and Pyle, J. A.: Model sensitivity studies of arctic ozone depletion, J. Geo-phys. Res., 103(D21), 28 389–28 403, 1998.
ACPD
7, 8663–8708, 2007
BrO profiling using ground-based UV-vis observations at 60◦N F. Hendrick et al. Title Page Abstract Introduction Conclusions References Tables Figures ◭ ◮ ◭ ◮ Back Close
Full Screen / Esc
Printer-friendly Version Interactive Discussion
EGU
Chipperfield, M. P.: Multiannual simulations with a three-dimensional chemical transport model, J. Geophys. Res., 104(D1), 1781–1805, 1999.
Chipperfield, M. P.: New Version of the TOMCAT/SLIMCAT Off-Line Chemical Transport Model: Intercomparison of Stratospheric Tracer Experiments, Q. J. R. Meteorol. Soc., 132, 1179– 1203, doi:10.1256/qj.05.51, 2006.
5
Connor, B. J., Siskind, D. E., Tsou, J. J., Parrish, A., and Remsberg, E. E.: Ground-based microwave observations of ozone in the upper stratosphere and mesosphere, J. Geophys. Res., 99(D8), 16 757–16 770, 1994.
Denis, L., Roscoe, H. K., Chipperfield, M. P., Van Roozendael, M., and Goutail, F.: A new software for NO2 vertical profile retrieval from ground-based zenith-sky spectrometers, J.
10
Quant. Spectrosc. Radiat. Transfer, 92, 321–333, 2005.
Dorf, M., Butler, J. H., Butz, A., Camy-Peyret, C., Chipperfield, M. P., Kritten, L., Montzka, S. A., Simmes, B., Weidner, F., and Pfeilsticker, K.: Observations of long-term trend in stratospheric bromine reveal slow down in growth, Geophys. Res, Lett., 33, L24803, doi:10.1029/2006GL027714, 2006a.
15
Dorf, M., B ¨osch, H., Butz, A., Camy-Peyret, C., Chipperfield, M. P., Goutail, F., Grunow, K., Hendrick, F., Hrechanyy, S., Naujokat, B., Pommereau, J.-P., Van Roozendael, M., Sioris, C., Stroh, F., Weidner, F., and Pfeilsticker, K.: Balloon-borne stratospheric BrO measurements: Comparison with Envisat/SCIAMACHY BrO limb profiles, Atmos. Chem. Phys., 6, 2483– 2501, 2006b.
20
Errera, Q. and Fonteyn, D.: Four-dimensional variational chemical assimilation of CRISTA stratospheric measurements, J. Geophys. Res., 106(D11), 12 253–12 265, 2001.
Feng, W., Chipperfield, M. P., Dorf, M., and Pfeilsticker, K., Mid-latitude ozone changes: studies with a 3-D CTM forced by ERA-40 analyses, Atmos. Chem. Phys., 7, 2357–2369, 2007,
http://www.atmos-chem-phys.net/7/2357/2007/. 25
Fietkau, S., Medeke, T., Richter, A., Sheode, N., Sinnhuber, B.-M., Wittrock, F., Theys, N., Van Roozendael, M., and Burrows, J. P.: Ground-based measurements of tropospheric and stratospheric Bromine monoxide above Nairobi (1◦S, 36◦E), Atmos. Chem. Phys. Discuss.,
7, 6527–6555, 2007,
http://www.atmos-chem-phys-discuss.net/7/6527/2007/. 30
Fitzenberger, R., B ¨osch, H., Camy-Peyret, C., Chipperfield, M.P., Harder, H., Platt, U., Sinnhu-ber, B.-M., Wagner, T., and Pfeilsticker, K.: First profile measurements of tropospheric BrO, Geophys. Res. Lett., 27, 2921–2924, 2000.
ACPD
7, 8663–8708, 2007
BrO profiling using ground-based UV-vis observations at 60◦N F. Hendrick et al. Title Page Abstract Introduction Conclusions References Tables Figures ◭ ◮ ◭ ◮ Back Close
Full Screen / Esc
Printer-friendly Version Interactive Discussion
EGU
Frieß, U., Hoowedel, J., K ¨onig-Langlo, G., Wagner, T., and Platt, U., Dynamics and chemistry of tropospheric bromine explosion events in the Antarctic coastal region, J. Geophys. Res., 109, D06305, doi:10.1029/2003JD004133, 2004.
Frieß, U., Monks, P. S., Remedios, J. J., Rozanov, A., Sinreich, R., Wagner, T., and Platt, U.: MAX-DOAS O4 measurements: A new technique to derive information on atmospheric
5
aerosols: 2. Modeling studies, J. Geophys. Res., 111, D14203, doi:10.1029/2005JD006618, 2006.
Harder, H., Camy-Peyret, C., Ferlemann, F., Fitzenberger, R., Hawat, T., Osterkamp, H., Perner, D., Platt, U., Schneider, M., Vradelis, P., and Pfeilsticker, K.: Stratospheric BrO Profiles Measured at Different Latitudes and Seasons: Atmospheric Observations, Geophys. Res. 10
Lett., 25, 3843–3846, 1998.
Harder, H., B ¨osch, H., Camy-Peyret, C., Chipperfield, M., Fitzenberger, R., Payan, S., Perner, D., Platt, U., Sinnhuber, B.-M., and Pfeilsticker, K.: Comparison of measured and modeled stratospheric BrO: Implications for the total amount of stratospheric bromine, Geophys. Res. Lett., 27 , 3695–3698, 2000.
15
Hebestreit, K., Stutz, J., Rosen, D., Matveeiv, V., Peleg, M., Luria, M., and Platt, U.: DOAS measurements of tropospheric bromine oxide in mid-latitudes, Science, 283, 55–57, 1999. Hendrick, F., Mueller, R., Sinnhuber, B.-M., Bruns, M., Burrows, J. P., Chipperfield, M. P.,
Fonteyn, D., Richter, A., Van Roozendael, M., and Wittrock, F.: Simulation of BrO Diurnal Variation and BrO Slant Columns : Intercomparison Exercise Between Three Model Pack-20
ages, Proceedings of the 5th European Workshop on Stratospheric Ozone, Saint Jean de Luz, France, 27 Sept.–1 Oct. 1999, Air Pollution Research Report n◦73, European
Commis-sion - DG XII, Brussels, 2000.
Hendrick, F., Barret, B., Van Roozendael, M., Boesch, H., Butz, A., De Mazi `ere, M., Goutail, F., Hermans, C., Lambert, J.-C., Pfeilsticker, K., and Pommereau, J.-P.: Retrieval of nitrogen 25
dioxide stratospheric profiles from ground-based zenith-sky UV-visible observations: Valida-tion of the technique through correlative comparisons, Atmos. Chem. Phys., 4, 2091–2106, 2004,
http://www.atmos-chem-phys.net/4/2091/2004/.
Hendrick, F., Van Roozendael, M., Kylling, A., Petritoli, A., Rozanov, A., Sanghavi, S., Schofield, 30
R., von Friedeburg, C., Wagner, T., Wittrock, F., Fonteyn, D., and De Mazi `ere, M.: Intercom-parison exercise between different radiative transfer models used for the interpretation of ground-based zenith-sky and multi-axis DOAS observations, Atmos. Chem. Phys., 6, 93–
ACPD
7, 8663–8708, 2007
BrO profiling using ground-based UV-vis observations at 60◦N F. Hendrick et al. Title Page Abstract Introduction Conclusions References Tables Figures ◭ ◮ ◭ ◮ Back Close
Full Screen / Esc
Printer-friendly Version Interactive Discussion
EGU
108, 2006,
http://www.atmos-chem-phys.net/6/93/2006/.
Hoffman, D., Bonasoni, P., De Mazi `ere, M., Evangelisti, F., Giovanelli, G., Goldman, A., Goutail, F., Harder, J., Jakoubek, R., Johnston, P., Kerr, J., Matthews, A., Mc Elroy, T., Mc Kenzie, R., Mount, G., Platt, U., Pommereau, J.-P., Sarkissian, A., Simon, P., Solomon, S., Stutz, J., 5
Thomas, A., and Van Roozendael, M.: Intercomparison of UV/Visible spectrometers for mea-surements of stratospheric NO2 for the Network for the Detection of Stratospheric Change, J. Geophys. Res., 100, 16 765–16 791, 1995.
H ¨onninger, G., von Friedeburg, C., and Platt, U.: Multi-axis differential absorption spectroscopy (MAX-DOAS), Atmos. Chem. Phys., 4, 231–254, 2004,
10
http://www.atmos-chem-phys.net/4/231/2004/.
Lary, D. J., Gas phase atmospheric bromine photochemistry, J. Geophys. Res., 101(D1), 1505– 1516, 1996.
Lee, A. M., Jones, R. L., Kilbane-Dawe, and Pyle, J. A.: Diagnosing ozone loss in the extrat-ropical lower stratosphere, J. Geophys. Res., 107(D11), 4110, doi:10.1029/2001JD000538, 15
2002.
Leser, H., H ¨onninger, G., and Platt, U.: MAX-DOAS measurements of BrO and NO2 in the marine boundary layer, Geophys. Res. Lett., 30, 1537, doi:10.129/2002GL015811, 2003. Kaleschke, L., Richter, A., Burrows, J. P., Afe, O., Heygster, G. Notholt, J., Rankin, A. M.,
Roscoe, H. K., Hollwedel, J., Wagner, T., and Jacobi, H. W.: Frost flowers on sea ice as 20
a source of sea salt and their influence on tropospheric halogen chemistry, Geophys. Res. Lett., 31, L16114, doi:10.129/2004GL020655, 2004.
Kreher, K., Johnston, P. V., Wood, S. W., and Platt, U.: Ground-based measurements of tro-pospheric and stratospheric BrO at Arrival Heights (78 ˚ S), Antarctica, Geophys. Res. Lett., 24, 3021–3024, 1997.
25
McKenzie, R., Johnston, P. V., McElroy, C. T., Kerr, J. B., and Solomon, S.: Altitude distributions of stratospheric constituents from ground-based measurements at twilight, J. Geophys. Res., 96, 15 499–15 511, 1991.
Mayer, B. and Kylling, A.: Technical note: The libRadtran software package for radiative transfer calculations – description and examples of use, Atmos. Chem. Phys., 5, 1855–1877, 2005, 30
http://www.atmos-chem-phys.net/5/1855/2005/.
Noxon, J. F.: Nitrogen dioxide in the stratosphere and troposphere measured by ground-based absorption spectroscopy, Science, 189, 547–549, 1975.


![[Anti-EGFR and anti-HER2 monoclonal antibodies against pancreatic carcinomas]](data:image/gif;base64,R0lGODlhAQABAIAAAP///wAAACH5BAEAAAAALAAAAAABAAEAAAICRAEAOw==)