HAL Id: cea-02339717
https://hal-cea.archives-ouvertes.fr/cea-02339717
Submitted on 9 Dec 2019
HAL is a multi-disciplinary open access
archive for the deposit and dissemination of
sci-entific research documents, whether they are
pub-lished or not. The documents may come from
teaching and research institutions in France or
abroad, or from public or private research centers.
L’archive ouverte pluridisciplinaire HAL, est
destinée au dépôt et à la diffusion de documents
scientifiques de niveau recherche, publiés ou non,
émanant des établissements d’enseignement et de
recherche français ou étrangers, des laboratoires
publics ou privés.
Dislocation analysis of a complex sub-grain boundary
using accurate electron channeling contrast imaging in a
scanning electron microscope
H. Mansour, M. Crimp, N. Gey, X. Iltis, N. Maloufi
To cite this version:
H. Mansour, M. Crimp, N. Gey, X. Iltis, N. Maloufi. Dislocation analysis of a complex sub-grain
boundary using accurate electron channeling contrast imaging in a scanning electron microscope.
Ceramics International, Elsevier, 2019, 45 (15), pp.18666-18671. �10.1016/j.ceramint.2019.06.091�.
�cea-02339717�
Dislocation analysis of a complex sub-grain boundary in UO
2
ceramic using
accurate electron channelling contrast imaging in a scanning electron
microscope
H. Mansour
a,∗,1, M.A. Crimp
b, N. Gey
a,c, X. Iltis
d, N. Maloufi
a,c,∗∗aUniversité de Lorraine, CNRS, Arts et Métiers Paris Tech, LEM3, F-57070, Metz, France
bChemical Engineering and Materials Science, Michigan State University, East Lansing, MI, 48824-1226, USA cUniv Lorraine, Lab Excellence Design Alloy Met Low MAss Struct D, F-57070, Metz, France
dCEA, DEN, DEC, Cadarache, 13108, Saint-Paul-Lez-Durance, France
A R T I C L E I N F O
Keywords:
C and D
Crept uranium dioxide B
Sub-grain boundary structure B
Scanning electron microscopy B
Accurate-electron channelling contrast imaging B
Dislocations
A B S T R A C T
In this work, accurate electron channelling contrast imaging (A-ECCI) assisted by high resolution selected area channelling patterns (HR-SACP) was used to characterize the structure of a complex low sub-grain boundary in a creep deformed uranium dioxide (UO2) ceramic. The dislocations were characterized using TEM-style g·b = 0
and g·b × u = 0 contrast criteria. Misorientations across the boundary were measured using HR-SACPs with 0.04° precision and high accuracy EBSD. The boundary was determined to be asymmetric and mixed in nature, composed of two distinct regions with different dislocation morphologies and a misorientation below 0.5°. The A-ECCI, HR-SACP, and HR-EBSD results are consistent, confirming A-ECCI as a powerful tool for characterizing even complex dislocations structures using scanning electron microscopy. This is particularly true for UO2, since
this material is very difficult to thin, which makes TEM examination of sub-boundaries over the scale of several micrometers difficult. Furthermore, in this study, the change in dislocations arrangement along the breath of the complex low angle sub-grain boundary is related to the misorientation across the boundary.
1. Introduction
Electron Channelling Contrast Imaging (ECCI) is an SEM-based technique that allows direct observation of crystallographic defects such as dislocations, twins, stacking faults, and low angle sub-grain boundaries. The technique has seen increasing use in the last decade, due to the now widespread availability of high quality field emission gun scanning electron microscopes (FEG-SEMs), which deliver an electron beam with the very small convergence, high brightness, and small spot size that are required for ECC imaging [1–5]. In order to optimize ECC image contrast and to characterize crystallographic de-fects, it is necessary to control the channelling conditions to so-called two-beam conditions, which requires the crystal orientation with re-spect to the incoming electron beam to be controlled with an angular accuracy of at least 0.1° [4,6].
In the past, these electron channelling conditions were established using electron channelling patterns (ECPs), selected area channelling patterns (SACPs), or electron backscattered diffraction patterns (EBSD),
but all of these techniques have either spatial or angular resolution limitations that restricted the applicability to ECCI [7–10].
A novel approach for collecting high resolution selected area channelling patterns (HR-SACP), with an angular accuracy of 0.04° and a spatial resolution below 500 nm, was developed a few years ago [11,12], opening the way to Accurate-ECCI assisted by HR-SACP. Re-cently, we have applied this technique to unambiguously characterize dislocations and low angle sub-grains using the g·b = 0 and
g·b × u = 0 invisibility criteria for the first time in fine-grained bulk
polycrystals [12,13].
Indeed, understanding the development and structure of low angle grain boundaries is essential for establishing the relationships between materials processing and behavior. In the case of sintered uranium di-oxide (UO2), the latest advanced EBSD characterizations have lead to
the quantification of the deformation substructure in term of mis-orientation maps and mean GNDs densities [14]. Past studies of the creep behavior of UO2using transmission electron microscopy (TEM)
have shown microstructures typically characterized by arrangement of
∗Corresponding author.
∗∗Corresponding author. Université de Lorraine, CNRS, Arts et Métiers Paris Tech, LEM3, F-57070, Metz, France. E-mail addresses:[email protected](H. Mansour),[email protected](N. Maloufi).
1Now at Oxford Instruments SAS, 77 ZA de Montvoisin, 91,400 Gômetz la Ville, France.
2. Experimental
UO2 pellets are commonly used in nuclear pressurized water
re-actors, due to their high melting temperature and radiation stability. During power transients, the temperature in the center of the pellets can exceed 1500 °C, while the surfaces of the pellets only reach 600 °C. Consequently, not only are the pellets subjected to significant thermal stresses, but their centers are hot enough to undergo significant plastic deformation through creep mechanisms [17,18]. Thus, developing an understanding of the relationships between microstructure and pro-cessing of UO2has the potential to increase their lifetimes and enhance
reactor performance.
In this study, the conditions inside a reactor were mimicked by deforming UO2 samples under uniaxial compression at 1500 °C and
50 MPa, which is known to be within the dislocation creep regime [19]. The surface of the sample was subsequently prepared by mechanical polishing. Imaging was carried out using a Zeiss Auriga FIB/SEM, with ECC images collected using a standard 4-quadrant pole-piece mounted backscattered electron detector. Imaging conditions were set up using the approach outlined in Ref. [12] using the standard tilt-rotate stage of the Zeiss Auriga.
3. Results and discussion
UO2is a ceramic with the fluorine (CaF2) crystallographic structure
(space group Fm3m). The primary slip system is 1/2 < 110 > {100}, but slip on {110} and {111} planes can be activated with the same 1/ 2 < 110 > glide direction as the temperature increases, [16,20-22]. The 1/2 < 110 > {111} glide system is often activated by cross slip [16,23].
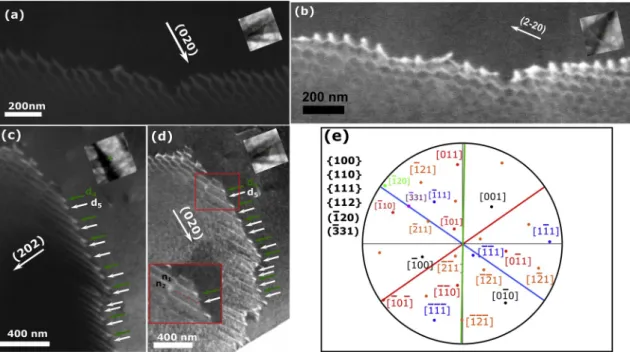
Fig. 1(a), (b) and (c) show A-ECC images of several configurations of dislocations (bright lines contrast against a dark background) in UO2
crept bulk samples highlighting the complexity and diversity of these networks. In this study we focus on the low angle sub-grain boundary of
Fig. 1(c), observed by A-ECCI at g= (202). As the boundary orientation varies, it is evident that the corresponding dislocation structure changes, with two significantly different regions. The first, labeled re-gion 1 in Fig. 1(c), is oriented roughly horizontal in the image, ex-tending from the left side past the center of the image. The second re-gion, labeled region 2, extends downward along the right side of the image. Region 1 is made up of a roughly hexagonal dislocation net-work, while region 2, is made up of linear, individual dislocations.
A schematic representation of the dislocation structures along the entire boundary is illustrated inFig. 2(a), whileFig. 2(b) schematically shows details of the hexagonal dislocation arrangement in region 1 of the boundary, with three dislocation types (identified later), labeled as d1(red), d2(green), and d3(blue). There is a smooth transition in the
dislocation structure between the two regions, as the hexagonal net-work becomes elongated and eventually one of the netnet-work dislocation types, d3, becomes a significant fraction of the long, straight
disloca-tions in region 2.
To identify the nature of the dislocations, an A-ECC analysis of the dislocations making up regions 1 and 2 of the sub-grain boundary has been carried out by imaging with a variety of channelling conditions and applying the g·b = 0 invisibility criterion and line trace analysis. This analysis has been complemented with HR-SACP to determine the disorientation across the boundary.
Region 1 of the sub-grain boundary is shown under three different channeling conditions inFigs. 1(c), 3(a) and 3(b). The dislocation line traces are plotted with different colors (d1in red, d2in green, and d3in
blue) on the stereographic projection inFig. 3(e). Dislocations d1are
visible at g = (202) (Fig. 1(c)) and g = (2–20) (Fig. 3(b)), but dis-appear with g = (020) inFig. 3(a), satisfying g·b = 0 (note that g is perpendicular to the dislocation line inFig. 3(a)), consistent with the Burgers vector being b1= 12[−10−1]. The trace analysis inFig. 3(e)
shows that the d1dislocation line lies in the (−121) plane, consistent
with the line direction being [−10−1] and indicating the dislocations are screw in character. Dislocations d2are visible with g = (202) and g
= (020), but disappear with g = (2–20), which is perpendicular to the dislocation line, so the d2dislocations have the12[110] Burgers vector
(b2). The d2 dislocations line trace lies approximately in the (1–11)
plane, consistent with the line direction being close to [110], as illu-strated in Fig. 3(e), again suggesting the dislocations are screw in character.
Using all of the g-vectors available within the tilt-rotate constraints of the stage, dislocations d3in the region 1 of the sub-grain did not
completely disappear, with their contrast only decreasing with
g = [111] (almost perpendicular to the dislocations line). Nevertheless,
because of the network nature of the dislocations in region 1 of the boundary, the Burgers vector of the d3dislocations can be determined
by summing the Burgers vectors at any of the dislocation nodes in the boundary, i.e. b=0 + + = b1 b2 b3 0 = + b3 (b1 b2) = b 1 2[01¯1] 3
Dislocations d3 cannot be pure screw dislocations because the
[0–11] direction does not lie on the trace of the dislocation line, as shown in the stereographic projection (blue line inFig. 3(e). If these dislocations exhibit pure edge character, their line direction would be [−211] and the only g-vector satisfying the g·b = 0 and g·bxu = 0 edge dislocation invisibility criteria would be g = (−422). Un-fortunately, given the stage limitations, it was not possible to reach this
g-vector (more than 50° of tilt). Other possible line directions for the d3
dislocations would result in mixed character and include [−120] or [−331] (seeFig. 3(e)). Regardless, the lack of complete invisibility for these dislocations in the available imaging conditions is consistent with dislocations d3being mixed or edge in character.
In summary, region 1 of the sub-grain consists of a hexagonal location network of 2 screw dislocations and an edge/or mixed dis-location, indicating that it is an asymmetric twist boundary.
Region 2 of the sub-grain boundary was likewise characterized under a variety of different channelling conditions. This A-ECC analysis reveals that region 2 of the sub-grain boundary is made of two different types of dislocations (d4and d5) that remain parallel under all of the tilt
conditions, indicating they share the same dislocation line direction.
Fig. 3(c) shows an A-ECC image of the boundary using g= (202), with dislocations d4and d5labeled by green and white arrows, respectively.
These two dislocation types appear to also have the same dislocation line direction as d3, with their trace also labeled in blue in the
stereo-graphic projection (see Fig. 3 (e)). Dislocations d4 reveal the same
dislocations into low angle grain boundaries [15,16]. Nevertheless, because of the high density and brittle character of UO2, large thinned
areas could not be obtained by ion milling. Thus, previous TEM ob-servations were limited. Furthermore, these sub-structures can be very complicated and have not typically been thoroughly analyzed by TEM. Revealing and characterizing the complex nature of the deformation sub-grain boundaries in UO2 will allow the development of more
rea-listic models of the dislocation creep behavior and will improve the UO2
creep understanding.
In this work we demonstrate that intricate and complex sub-grain boundary structures are formed in UO2 during high temperature creep.
Using the A-ECCI, HR-SACP, and high precision EBSD analyses, a complex sub-grain boundary in a bulk UO2 sample was precisely
characterized for the first time. Furthermore, the approach offered here has significant advantages over the TEM approach in that it does not require the TEM thin foil preparation and consequently eliminates the potential artifacts associated with the preparation of ceramic speci-mens.
visibility under different imaging conditions g as dislocation d3.
Fol-lowing the dislocation network node rules between regions 1 and 2, reinforces that dislocations d4must have the same Burgers vector as
dislocations d3(b4= b3). Dislocations d5became invisible at g = (020)
inFig. 3(d), consistent with a b5=± [101]12 , possibly the same as b1.
This g-vector is neither perpendicular nor parallel to the line direction, indicating that dislocations d5are mixed dislocations. Like dislocations
d4, dislocations d5appear to connect back to the network connecting
regions 1 and 2. However, the manner in which dislocations d5connect
is not readily apparent, withFig. 3(d) showing both broken and strong contrast at the node where the uppermost d5dislocation comes in to the
network. Thus, unfortunately, the spatial resolution of the SEM and ECCI technique in this case is not fine enough to unambiguously image the node, and it is not possible to fully characterize the nature of dis-location d5.
It is important to note that the distribution of dislocations d4and d5
is irregular, with varying spacing and order of these dislocations along the boundary, as indicated by the green and white lines inFig. 3(c) and (d). Furthermore, it can be seen that with each d4dislocation, there is a
step or facet on the sub-grain boundary. This indicates the boundary is asymmetric and made up of two different sets of dislocations. Ad-ditionally, as at least one of the dislocation types that makes up the boundary in Region 2 is mixed in character, the boundary most likely has mixed twist and tilt characteristics.
Fig. 4 shows a relatively low magnification A-ECC image of the region containing the sub-grain boundary of interest. Differences in BSE intensity between the outer primary grain region, in higher intensity, and the region enclosed by the sub-grain boundary, in lower intensity, indicate a significant misorientation across the boundary. Closer ex-amination reveals that the misorientation between the inner (lower) sub-grain and outer grain varies, with large differences in BSE intensity across the right and upper portions of the boundary, and smaller var-iations in intensity across the left hand portion of the boundary. Of particular note, the intensity of the enclosed sub-grain is seen to vary significantly from right to left, suggesting that the orientation of the sub-grain varies. This orientation variation may result from elastic strains in the sub-grain and/or may be related to the small residual dislocation content that can be observed in the sub-grain (note that similar residual dislocations are observed in the primary grain and there may also be orientation variations in the primary grain, but these are not as evident in the channelling contrast).
To quantify the misorientation variations across the sub-grain boundary, HR-SACP was used to measure the orientations of both the primary grain and the sub-grain. Six of these HR-SACPs, labeled 1–6, are superimposed onFig. 4. Misorientations between the different re-gions were determined by superposing pairs of the HR-SACPs using the image analysis software “ImageJ” and allowing the number of pixels and direction of the shift between two patterns to be determined. Cross-correlation of the patterns shows a misorientation of θ1-2= θ3-4= 0.3°
in region 1 of the boundary. The direction of the shift between two HR-SACPs is indicated by red dotted lines inFig. 4, with the angle of the red dotted relative to the horizon of the image also indicated in red. Be-cause of the small angular range of HR-SACP pattern, small rotation axes are hard to measure, especially for the rotations perpendicular to the pattern. In contrast, rotational components about axes lying in the plane of the pattern can be measured with high accuracy. Therefore, the measured shift can be considered a qualitative estimate of the crystal rotations across the boundary. While the misorientation angle between positions 1 and 2 is very similar to the angle between positions 3 and 4, ∼0.3° the direction of the shift varies slightly, from 29 to 37°, in-dicating that the misorientation axis varies also slightly.
When the misorientation is measured between HR-SACPs 5 and 6, a significantly larger misorientation angle of ∼0.44° is revealed, con-sistent with the larger change in channelling intensity across the right hand side of the sub-grain boundary. The misorientation axis also continues to rotate at this point to approximately 50° from the Fig. 1. A-ECC images of several sub-grain boundaries observed in a UO2crept bulk sample. The g = (202) diffraction condition is indicated for the sub-grain to which
the study related.
Fig. 2. (a) Schematic representation of the dislocation structures within the
sub-grain boundary. (b) Schematic representation of the three dislocations types (d1, d2, d3) forming the hexagonal network in Region 1 of the sub-grain
horizontal. Note that at this point, the misorientation axis nearly lies in the plane of the sub-grain boundary, with the axis nearly parallel with the line direction of the dislocations that make up the boundary, con-sistent with the boundary being mostly tilt in character in this region. The measured misorientations along the boundary can be compared to calculated misorientations based on the spacing between disloca-tions, based on a Burgers vector length in UO2 of b = 1/
2*a*[110] = 1/2*0.547* 2 = 0.387 nm. According to Read [24], the formula θ≈b/D is applicable to both tilt and twist boundaries. In the regions between HR-SACP pairs 1 and 2 and 3 and 4, the perpendicular dislocation spacing D ≈ 82 nm, while between HR-SACPs 5 and 6, D ≈ 48 nm was measured. These measurement result in calculated misorientations of: θ1≈ 0.387/82≈ 0.27° along the upper twist region
of the boundary and θ2≈ 0.387/48 ≈ 0.47° in the right hand near tilt
portion of the boundary, both similar to the misorientations determined from HR-SACPs.
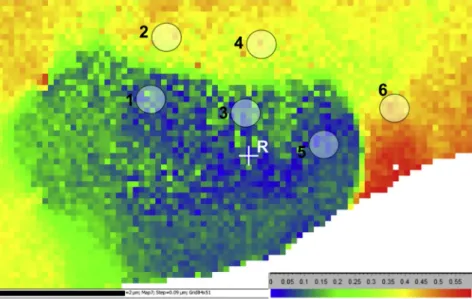
An EBSD map (Fig. 5) with a step size of 90 nm was acquired around the sub-grain boundary using a “NordlysNano” Oxford instruments EBSD system. The patterns were indexed using “Refined Accuracy” in the EBSD acquisition software AZtec. After primary band detection was performed using an optimized variant of the classical Hough transform approach, each pattern was indexed, which leads to a first estimation of the crystal orientation with a precision in the range of 0.2–0.5°. Then an additional step (“Refined Accuracy”) was performed to refine the so-lution: here the initial proposed solution was used to model the ex-pected positions of the Kikuchi band edges using Bragg's theory, taking into account their hyperbolic nature. Detailed image analysis along the band edges in the original diffraction pattern was then used to refine the original solution, optimizing the fit between the solution and the original pattern (see US patent No 9,671,354 B2 (2017)). The angular precision of the EBSD analysis can thus routinely be improved down to Fig. 3. A-ECC image of region 1 of the sub-grain boundary at (a) g= (020) and (b) (2–20), and of region 2 at (c) g= (202) and (d) g= (020). (e) Stereographic
projection showing {100}, {110}, {111}, {112}, (−120), (−331) poles. The straight lines correspond to the traces of the dislocations: d1(red); d2(green); d3, and d4
and d5(blue). (For interpretation of the references to color in this figure legend, the reader is referred to the Web version of this article.)
Fig. 4. (a) A-ECC image of the sub-grain boundary.
Misorientation across the boundary is indicated by the many HR-SACP (1–6) collected on either side of the boundary. The shift direction between HR-SACPs is labeled in red dotted lines. The misorientation across the boundary was calculated based on the distance between dislocations, as shown for side 1 of the sub-grain boundary in (b) and side 2 of the boundary in (c). (For interpretation of the references to color in this figure legend, the reader is referred to the Web ver-sion of this article.)
0.05° or even better with high pattern quality.
Nevertheless, the sub-grain boundary is not detectable in the high precision EBSD map using the usual boundary detection algorithms, because of its small misorientation (< 0.5°). Therefore to reveal the existence of the sub-grain, the angular misorientation relative to a re-ference point, labeled R in the middle of the sub-grain, is plotted in
Fig. 5. The misorientation map was scaled from 0 to 0.6°. Areas iden-tical to the ones measured by HR-SACP around the sub-grain boundary were labeled as circles from 1 to 6. The misorientation between these areas were measured (the orientations were determined by averaging over 20 pixels in each area): θEBSD1-2= 0.39°, θEBSD3-4= 0.37° and
θEBSD5-6= 0.46°.
The misorientation values measured by high accuracy EBSD are very consistent with those measured by HR-SACP and those calculated based on the ECCI characterization of the dislocations in the boundary.
4. Conclusion
In summary, a complex low angle sub-grain boundary in a creep deformed polycrystalline UO2was characterized using an innovative
procedure combining HR-SACPs and A-ECCI. TEM style dislocations contrast criteria and line analysis were used to determine their Burgers vectors and nature. Two distinct boundary regions were observed, one with a hexagonal-like arrangement of three dislocation types and the other made up of parallel dislocations with different Burgers vectors. The analysis unambiguously revealed a mixed character of the boundary in both regions. In addition, the calculated misorientations based on the dislocations analysis are in good agreement with both HR-SACP and high precision EBSD measurements. Furthermore, the change in dislocations arrangement along the breath of the boundary is related to the misorientation across the boundary, which has never been de-monstrated by TEM in this ceramic. Moreover, this work pushes the boundary of applications of ECCI as an SEM-based technique and shows the potential of such a technique as an alternative to transmission electron microscopy for ceramics, and particularly those difficult to prepare for TEM examination. Understanding the complex nature of the sub-grain boundaries in UO2ceramic will brings new insights for
vali-dating numerical models, and will improve the understanding of creep mechanisms in these materials.
Author contributions
ECCI observations were performed by H.M. H.M. wrote the main manuscript text. H.M., M.A.C. and N.M. worked on the analysis and writing of the manuscript. All the authors participate in the discussion
and they reviewed the manuscript.
Formatting of funding sources
This research did not receive any specific grant from funding agencies in the public, commercial, or not-for-profit sectors.
Acknowledgment
M.A. Crimp would like to acknowledge the University of Lorraine and LABEX DAMAS for financial support as a visiting Professor.
References
[1] F. Ram, Z. Li, S. Zaefferer, S.M.H. Haghighat, Z. Zhu, D. Raabe, On the origin of creep dislocations in a Ni-base, single-crystal superalloy: an ECCI, EBSD, and dis-location dynamics-based study, Acta Mater. 109 (2016) 151–161.
[2] A. Weidner, H. Biermann, Case studies on the application of high-resolution elec-tron channelling contrast imaging–investigation of defects and defect arrangements in metallic materials, Philos. Mag. 95 (2015) 759–793.
[3] M.A. Crimp, B.A. Simkin, B.C. Ng, Demonstration of the g · b x u = 0 edge dis-location invisibility criterion for electron channelling contrast imaging, Phil. Mag. Lett. 81 (2001) 833–837.
[4] H. Kriaa, A. Guitton, N. Maloufi, Fundamental and experimental aspects of dif-fraction for characterizing dislocations by electron channeling contrast imaging in scanning electron microscope, Sci. Rep. 7 (2017) 9742–9750.
[5] Y.N. Picard, R. Kamaladasa, M. De Graef, N.T. Nuhfer, W.J. Mershon, T. Owens, L. Sedlacek, F. Lopour, Future prospects for defect and strain analysis in the SEM via electron channeling, Microsc. Today 20 (2012) 12–16.
[6] A.J. Wilkinson, P.B. Hirsch, Electron diffraction based techniques in scanning electron microscopy of bulk materials, Micron 28 (1997) 279–308. [7] G. Naresh-Kumar, B. Hourahine, P.R. Edwards, A.P. Day, A. Winkelmann,
A.J. Wilkinson, P.J. Parbrook, G. England, C. Trager-Cowan, Rapid nondestructive analysis of threading dislocations in wurtzite materials using the scanning electron microscope, Phys. Rev. Lett. 108 (2012) 135503.
[8] M.A. Crimp, Scanning electron microscopy imaging of dislocations in bulk mate-rials, using electron channeling contrast, Microsc. Res. Tech. 69 (2006) 374–381. [9] I. Gutierrez-Urrutia, S. Zaefferer, D. Raabe, Electron channeling contrast imaging of
twins and dislocations in twinning-induced plasticity steels under controlled dif-fraction conditions in a scanning electron microscope, Scripta Mater. 61 (2009) 737–740.
[10] F.J. Humphreys, Review - grain and subgrain characterisation by electron back-scatter diffraction, J. Mater. Sci. 36 (2001) 3833–3854.
[11] J. Guyon, H. Mansour, N. Gey, M.A. Crimp, S. Chalal, N. Maloufi, Sub-micron re-solution selected area electron channeling patterns, Ultramicroscopy 149 (2015) 34–44.
[12] H. Mansour, J. Guyon, M.A. Crimp, N. Gey, B. Beausir, N. Maloufi, Accurate elec-tron channeling contrast analysis of dislocations in fine grained bulk materials, Scripta Mater. 84–85 (2014) 11–14.
[13] H. Mansour, M.A. Crimp, N. Gey, N. Maloufi, Accurate electron channeling contrast analysis of a low angle sub-grain boundary, Scripta Mater. 109 (2015) 76–79. [14] M. Ben Saada, N. Gey, B. Beausir, X. Iltis, H. Mansour, N. Maloufi, Sub-boundaries
induced by dislocational creep in uranium dioxide analyzed by advanced diffraction and channeling electron microscopy, Mater. Char. 133 (2017) 112–121.
Fig. 5. High precision EBSD map of the grain containing the
sub-grain boundary, measured with a step size of 90 nm. The misorientation relative to a reference point “R” is plotted using a scale from 0° to 0.6°. The misorientations across 1–2, 3–4 and 5–6 were measured by averaging the orientations of 20 pixels around those areas (1–6) (labeled as circles).
[15] F. Dherbey, F. Louchet, A. Mocellin, S. Leclercq, Elevated temperature creep of polycrystalline uranium dioxide: from microscopic mechanisms to macroscopic behaviour, Acta Mater. 50 (2002) 1495–1505.
[16] A. Alamo, J.M. Lefebvre, J. Soullard, Plasticdeformation of uraniumdioxide -observation of dislocation substructures, J. Nucl. Mater. 75 (1978) 145–153. [17] S. Aas, Mechanical interaction between fuel and cladding, Nucl. Eng. Des. 21 (1972)
237–253.
[18] B. Michel, J. Sercombe, C. Nonon, O. Fandeur, Modeling of pellet cladding inter-action, Compr. Nucl. Mater. 3 (2012) 677–712.
[19] X. Iltis, N. Gey, C. Cagna, A. Hazotte, Ph Sornay, Microstructural evolution of ur-anium dioxide following compression creep tests: an EBSD and image analysis
study, J. Nucl. Mater. 456 (2015) 426–435.
[20] A.G. Evans, P.L. Pratt, Dislocations in fluorite structure, Philos. Mag. 20 (1969) 1213–1237.
[21] J. Friedel, Dislocations, Pergamon Press ed., Oxford_New york, 1964. [22] P.T. Sawbridge, E.C. Sykes, Electrostatic charges on dislocations in uranium
di-oxide, J. Nucl. Mater. 35 (1970) 122–125.
[23] E.J. Rapperport, A.M. Huntress, Nuclear Metals (USA) Report NMI, 1242 (1960), pp. 1–29.
[24] W.T. Read Jr., Dislocations in Crystals, McGraw-Hill, Book Company, INC, New York, Toronto, London, 1953.