HAL Id: hal-00686007
https://hal.archives-ouvertes.fr/hal-00686007
Submitted on 6 Apr 2012
HAL is a multi-disciplinary open access archive for the deposit and dissemination of sci-entific research documents, whether they are pub-lished or not. The documents may come from teaching and research institutions in France or abroad, or from public or private research centers.
L’archive ouverte pluridisciplinaire HAL, est destinée au dépôt et à la diffusion de documents scientifiques de niveau recherche, publiés ou non, émanant des établissements d’enseignement et de recherche français ou étrangers, des laboratoires publics ou privés.
Properties of knowledge base and firm survival:
Evidence from a sample of French manufacturing firms
Alessandra Colombelli, Jackie Krafft, Francesco Quatraro
To cite this version:
Alessandra Colombelli, Jackie Krafft, Francesco Quatraro. Properties of knowledge base and firm survival: Evidence from a sample of French manufacturing firms. Technological Forecasting and Social Change, Elsevier, 2013, 80 (8), pp.1469-1483. �10.1016/j.techfore.2013.03.003�. �hal-00686007�
1
Properties of knowledge base and firm survival: Evidence from a
sample of French manufacturing firms
1Alessandra Colombellia,b – Jackie Krafftb – Francesco Quatrarob*
a) Dipartimento di Sistemi di Produzione ed Economia del’Azienda, Politecnico di Torino
b) University of Nice Sophia Antipolis and CNRS-GREDEG
ABSTRACT.
The paper analyzes the effects of the properties of firms’ knowledge base on the survival likelihood of firms. Drawing upon the analysis of the patterns of co-occurrence of technological classes in patent applications, we derive the coherence, variety and cognitive distance indexes, accounting respectively for technological complementarity, differentiation and (dis)similarity in the firms’ patent portfolios. The results of our analysis are in line with the previous literature, showing that innovation enhances the survival likelihood of firms. In addition, we show that the search strategies at work in the development of firms’ knowledge base matter in reducing the likelihood of a failure event. Knowledge coherence and variety appear to be positively related to firms’ survival, while cognitive distance exerts a negative effect. We conclude that firms able to exploit the accumulated technological competences have more chances to be successful in competing durably in the market arena, and derive some policy implications concerning the role of public intervention in the orientation of search efforts in local contexts.
JEL Classification codes: O32, L10, L20
Keywords: Knowledge coherence, variety, cognitive distance, firms’ survival
1 The authors acknowledge the financial support of the European Union D.G. Research with the Grant number
266959 to the research project ‘Policy Incentives for the Creation of Knowledge: Methods and Evidence’ (PICK-ME), within the context Cooperation Program / Theme 8 / Socio-economic Sciences and Humanities (SSH).
2
1 Introduction
The mechanisms underlying the process of new firms’ creation and their post-entry performances have been the focus of a wide body of theoretical and empirical literature (Santarelli and Vivarelli, 2007). Indeed, the intrinsic heterogeneity of firms, as well as of the sectors and the regions in which they operate, generates quite differentiated post-entry dynamics.
Most of the analyses carried out in industrial economics provides explanations of the survival patterns of firms based on firms’ age and size. Some others also stress the influence of the economic environment, and hence of the geographical localization of firms.
The role played by innovation has been initially addressed by Audretsch (1991) and Audretsch and Mahmood (1995), as firms’ survival rates change according to the belonging to innovative or non-innovative industries. More recently, a number of contributions based on the product lifecycle approach have investigated the effects of innovation on the patterns of firms survival (Cefis and Marsili, 2005 and 2006). The data used in these works are drawn from the Community Innovation Surveys (CIS) and concern (self-reported) innovation efforts of firms, distinguishing between the introduction of product and process innovations. While these studies provide important evidence, Helmers and Rogers (2010) raise some concerns on their utilization due to the possible biases generated by self-reported innovation measures. Instead they use measures related to intellectual property assets of the firms, like patents and trademarks, confirming that innovation enhances the likelihood of firms’ survival.
However, the existing literature on innovation and firm survival tends to treat new technologies as a sort of black boxes. When one tries to go beyond self-reported measures, the proxies used in the analysis boil down to some dummies related to the observation of a patent or a trademark in the intangible assets of the firm.
In this paper we aim at providing an empirical account of the role played by the knowledge creation process in the dynamics of firm survival. In particular we analyze the effects of different kinds of firms’ search strategies in the technological landscape by drawing upon a collective knowledge approach. In this perspective new knowledge is the outcome of a process in which different knowledge inputs dispersed in the economy are combined together. The degree of complementarity and similarity of the combined bits characterizes the structure of firms’ knowledge base, and provides useful information on the search strategies they pursue (Krafft, Quatraro and Saviotti, 2009; Quatraro, 2012).
Our results confirm that innovation increases the survival likelihood. Moreover, firms that carry out search strategies based on the exploitation of accumulated technological competences are more likely to survive than firms that are focused on exploration strategies dominated by high degrees of uncertainty.
The rest of the paper is organized as follows. Section 2 articulates the theoretical framework linking the survival patterns of firms with the structural properties of their knowledge bases.
3
Section 3 presents the data, the variables and the methodology. We show the empirical results of the analysis in Section 4 and provide the conclusions and policy implications in Section 5.
2 Firm survival and knowledge creation
A wide body of empirical literature in industrial organization shows that firms’ population is characterized by endless turbulence. The dynamics of firms’ demography is indeed marked by high rates of turnover, both across and within industries (Caves, 1998). The analysis of entry and exit dynamics have been originally closely intertwined. New firms are indeed exposed to high rates of mortality in the critical start-up period, and hence the characteristics of firms at the moment of their creation have been usually regarded as good predictors of post-entry performances, i.e. on the probability for firms to survive to market selection (Dunne et al., 1988; Audrestch, 1995; Baldwin, 1995).
Out of the factors influencing the failure likelihood, the existing literature identifies two key elements, i.e. size and age. On the one hand, the former is basically related to Gibrat’s law of proportionate effects. In this perspective, new firms entering the market have more chances to attenuate post-entry mortality if they are set up on a large scale of production (Sutton, 1997; Mata and Portugal, 1994; Geroski, 1995). On the other hand, the latter is grounded on Jovanovic (1982) theory of ‘noisy selection’ that explicitly centers the attention on the learning dynamics characterizing firms’ behavior. In this framework, firms are not aware of their efficiency level as compared to the general efficiency level of the sector. They discover their efficiency over time, so that those that are relatively efficient survive and grow while those that are inefficient eventually leave the market. The probability of survival hence increases with firms’ age. Some non-linear effects have been also observed, according to which the positive relationship is decreasing over time (Evans, 1987; Hall, 1987).
Jovanovic’s model has been further extended by Ericson and Pakes (1995), who include firms’ investments in R&D so as to make learning the outcome of an intentional choice. By exploring the technological landscape, firms improve their efficiency and profitability and hence their survival likelihood. Rather than the mere effect of time, in this model learning stems from deliberate strategies aimed at enriching their distinctive competences. In the same vein, Nelson and Winter (1982) posit that investments in innovative and imitative R&D on average lead to an improvement of firms productivity levels. The comparison of these latter with the general efficiency level of the sector shapes firms’ decision as to whether stay in the market or exit.
On a different and yet complementary ground, Agarwal and Audretsch (2001) show that while size and age are important, their effects on firms’ survival change across different sectors according to the stage of the industry lifecycle and the technological regime (Klepper, 1996 and 1997). Size is more likely to matter in the formative stage of an industry, when innovation activities are not yet routinized, than in the mature stages, when innovation activities are rather routinized and small firms can achieve successful strategic positions by filling some market niches that are left empty by incumbents (Caves and Porter, 1977).
Innovation and technological change hence come to the fore in the discussion on firm survival. While the lifecycle approach indirectly addresses the issue by comparing survival patterns across different technological regimes, the theoretical model by Ericson and Pakes
4
and the one by Nelson and Winter establish a direct link between technological efforts and post-entry performances. However, direct empirical assessments of such relationships are still underdeveloped and in any case rely on rather stylized representations of the innovation process. Some investigations (Hall, 1987; Perez et al., 2004) used R&D investments as proxies of innovation activities, by concluding that they are positively related to the survival likelihood of the firm. These are clearly input measures of the innovation process. On the output side, Christensen et al. (1998) analyzed the effects of architectural innovation, while Banbury and Mitchell (1995) focused their study on the number of product innovations brought about by the firms in their dataset.
More recently, Cefis and Marsili (2005 and 2006) provide an account of the differential effect of the introduction of product and process innovation on firm survival. By linking the results to the product lifecycle theory, according to which the introduction of product innovation characterizes the early stage of the cycle while process innovation becomes more important when the sector comes to maturity, they find that process innovation matters more than product innovation. Helmers and Rogers (2010) adopt an empirical strategy based on intellectual property activity of firms by focusing on a sample of British firms. Intellectual property is proxied in their analysis by patent applications and trademarks, showing that both influence negatively the failure rate of the sampled firms.
While the link between innovation and firm survival seems to be now rather established, little has been said about the importance of search strategies pursued by firms to generate new technological knowledge. The grafting of the recent theories of knowledge creation onto the debate on survival can be far reaching in enhancing the understanding of the differential effects of random search or organized screening strategies along different stages of the technology lifecycle.
Traditional approaches to technological knowledge have mostly represented it as a homogeneous stock, as if it were the outcome of a quite uniform and fluid process of accumulation made possible by R&D investments, the same way as capital stock (Griliches, 1979; Mansfield, 1980). Such kind of representation is hardly useful to investigate the nature of firms’ search strategies, as it only allows for evaluating it from a quantitative rather than a qualitative viewpoint.
More recently, an increasingly share of scholars in the economics of innovation has elaborated theoretical approaches wherein the process of knowledge production is viewed as the outcome of a recombination process (Weitzmann, 1998; Kauffman, 1993). The creation of new knowledge is represented as a search process across a set of alternative components that can be combined one another. A crucial role is played here by the cognitive mechanisms underlying the search process aimed at exploring the knowledge space so as to identify the pieces that might possibly be combined together. The set of potentially combinable pieces turns out to be a subset of the whole technological space. Search is supposed to be local rather than global, while the degree of localness appears to be the outcome of cognitive, social and technological influences. The ability to engage in a search process within spaces that are distant from the original starting point is likely to generate breakthroughs stemming from the combination of brand new components (Nightingale, 1998; Fleming, 2001).
Based on these achievements, we can introduce the concept of knowledge structure. If knowledge stems from the combination of different technologies, knowledge structure can be represented as a web of connected elements. The nodes of this network stand for the elements
5
of the knowledge space that may be combined with one another, while the links represent their actual combinations. The frequency with which two technologies are combined together provides useful information on how we can characterize the internal structure of the knowledge base. Basically, this characterization takes into account the average degree of complementarity of the technologies which knowledge bases are made of, as well as to the variety of the observed pairs of technologies that lead us to derive three main properties of knowledge structure at a general level:
Variety is related to the technological differentiation within the knowledge base, in particular with respect to the diverse possible combinations of pieces of knowledge in the sector, from the creation of a radically new type of knowledge to the more incremental recombination of already existing types of knowledge.
Coherence can be defined as the extent to which the pieces of knowledge that agents within the sector combine to create new knowledge are complementary one another.
Similarity (or dissimilarity) refers to the extent to which the pieces of knowledge used in the sector are close one another in the technological space.
The dynamics of technological knowledge can therefore be understood as the patterns of change in its own internal structure, i.e. in the patterns of recombination across the elements in the knowledge space. This approach captures both the cumulative character of knowledge creation and the key role played by the properties describing knowledge structure, as well as the possible link to the relative stage of development of a technological trajectory (Dosi, 1982; Saviotti, 2004 and 2007; Krafft, Quatraro and Saviotti, 2009).
This approach allows for better qualifying a key distinction concerning innovation strategies, i.e. the one between exploration and exploitation (March, 1991). The view of knowledge as an outcome of a recombination activity allows for the introduction of two nested dimensions, defined according to the degree to which agents decide to rely either on exploration or exploitation or on a combination of both. Related to this, concepts like search depth and search scope have been introduced (Katila and Ahuja, 2002) refer on the one hand to the degree to which agents intend to draw upon their prior knowledge, and on the other hand to the degree to which agent intend to rely on the exploration of new areas in the knowledge space. Firms intending to exploit the variety of competences they have accumulated in the course of time will be characterized by high values of coherence of their knowledge bases as well as by low values of technological dissimilarity. Borrowing from Tushman and Anderson (1986), we may say that these firms implement competence-enhancing search strategies. On the contrary, firms intending to explore new areas of the technological landscape by enlarging their search scope would be characterized on average by low levels of coherence and high levels of dissimilarity. This conduct would allow them to break with their usual activities and eventually introduce radically new knowledge. By symmetry, we can maintain that these firms implement competence-destroying search strategies.
The combination of the firm survival framework with the recombinant and collective approach allows us to articulate our working hypotheses concerning the relationship between search strategies and firm survival.
The post-entry performances of firms is characterized by a high degree of turbulence. Besides the environmental factors related to the features of the regions and the sectors in which they
6
operate, some firm-level factors play an important role in shaping the likelihood of survival. In this perspective, technological activities are likely to exert a strong influence on the patterns of exit. Technological knowledge, however, is far from being an undifferentiated bundled stock. On the contrary, it is the result of a combinatorial activity which rests upon the search efforts committed by firms. The collective approach to knowledge creation allow us to propose the concept of knowledge structure, which refers to the shape that features the patterns of recombination.
The structure of knowledge is therefore represented by the elements that are combinable and by the actual observed combinations. Each knowledge bit can be assigned to a technological domain, so that we can characterize the structure of the knowledge base according to the fact that it is made by the combination of more or less similar and complementary elements.
Firms undertaking competence-enhancing search strategies, based on organized search aimed at exploiting the accumulated knowledge, are more likely to be successful, and hence they should show relatively higher survival rates. On the contrary, firms undertaking competence- destroying search strategies, based on random screening aimed at exploring the technology landscape, are more likely to undergo failure events due to the high degree of uncertainty that characterizes this kind of approach and the difficult, length and resource-intensive activity necessary to translate radical breakthroughs into profitable bits of knowledge.
3 Data, Variables and Methodology
3.1 The Data
In order to investigate the effects of the properties of knowledge structure on firm survival we gather firm-level data from the Bureau Van Dijk DIANE dataset, which provides detailed information on French firms, and from the PATSTAT database (April 2011), which contains detailed information on worldwide patent applications to the European Patent Office. This information is crucial to implement the properties of knowledge structure that will be described in what follows. Finally, we used the harmonized matching tables described by Thoma et al. (2010) to combine the PATSTAT and the DIANE datasets on the basis of the Bureau Van Dijk firm identification code.
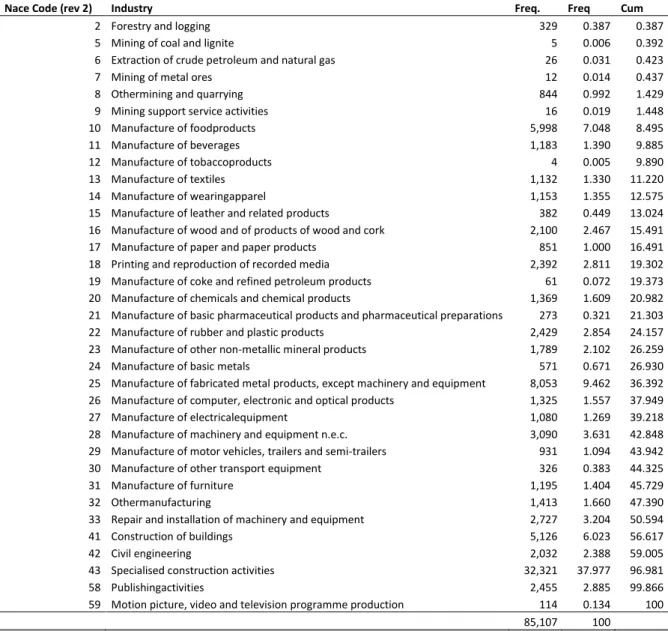
The data obtained from the DIANE dataset refer to a sample of manufacturing firms covering a time span ranging from 2001 (first observed year) to 2011. We decided to focus on manufacturing firms as the use of patents as a proxy for knowledge creation activities clearly raises some concerns when service activities are at stake. We obtained a former dataset of 851,070 firms spread over 36 2-digits NACE industrial sectors (rev2.1). The sectoral distribution of the sample is reported in Table 1.
>>> INSERT Table 1 ABOUT HERE <<<
Since the dataset starts in 2001, we decided to drop from the dataset the firms that have been created after 2001, in order to avoid truncation problems. After the merge with the patent datasets and the data cleaning we ended up with 74,862 firms operating in the manufacturing sector. The final dataset provides firm-level information about economic and innovation
7
activities along the whole observed period. Hence we were able to derive the ‘starting conditions’ for the relevant variables at 20022
. We are also able to trace the existence of the firm month by month up to December 2010. This is done by using the information on the juridical status of the firm. Following a large body of the literature on the subject, survival data refer here to firms that have failed or have been the object of merger and acquisitions (Agarwal and Audretsch, 2001; Cefis and Marsili, 2006).
3.2 The Variables 3.2.1 Dependent Variable
In order to implement our empirical analysis on survival likelihood we adopted the survival
time of a firm as key variable. The survival time is calculated for all the firms included in our
dataset and extends to all firms of varying ages and sizes. As initial point for the calculation of the survival time we took January 2002. The survival time is therefore the time elapsed between January 2002 and the month in which the firm exited. The survival time is right-censored on December 2011, as an exit event is not observed for continuing firms.
3.2.2 The Key Covariates: Implementation of Knowledge Indicators
The properties of the knowledge base are calculated by using the information contained in patent documents. Since we needed to derive the values of these properties at 2002, we implemented the yearly calculation of the variables described in what follows, and then used the average value on the period 1997-2002.
For what concerns the definition of the variables, let us start by the traditional firm’s
knowledge stock. This is computed by applying the permanent inventory method to patent
applications. We calculated it as the cumulated stock of past patent applications using a rate of obsolescence of 15% per annum: , , (1 ) ,1
it it t i h E E , where hi,t
is the flow of patent applications and δ is the rate of obsolescence3.
The implementation of knowledge characteristics proxying for variety, coherence and similarity, rests on the recombinant knowledge approach. In order to provide an operational translation of such variables one needs to identify both a proxy for the bits of knowledge and a proxy for the elements that make their structure. For example one could take scientific publications as a proxy for knowledge, and look either at keywords or at scientific classification (like the JEL code for economists) as a proxy for the constituting elements of the knowledge structure. Alternatively, one may consider patents as a proxy for knowledge, and then look at technological classes to which patents are assigned as the constituting elements of its structure, i.e. the nodes of the network representation of recombinant
2
Due to the need to calculate firm growth as an explanatory control variable. 3
8
knowledge. In this paper we will follow this latter avenue4. Each technological class j is linked to another class m when the same patent is assigned to both of them. The higher is the number of patents jointly assigned to classesj and m, the stronger is this link. Since technological classes attributed to patents are reported in the patent document, we will refer to the link between j and m as the co-occurrence of both of them within the same patent document5.
On this basis we calculated the following three key characteristics of firms’ knowledge bases (see the appendix A for the methodological details):
a) Knowledge variety (KV) measures the degree of technological diversification of the knowledge base. It is based on the information entropy index, and it can be decomposed in related knowledge variety (RKV) and unrelated knowledge variety (UKV).
b) Knowledge coherence (COH) measures the degree of complementarity among technologies.
c) Cognitive distance (CD) expresses the dissimilarities amongst different types of knowledge.
The adoption of these variables marks an important step forward in the operational translation of knowledge creation processes. In particular, they allow for a better appreciation of the collective dimension of knowledge dynamics. Knowledge is indeed viewed as the outcome of a combinatorial activity in which intentional and unintentional exchange among innovating agents provides the access to external knowledge inputs (Fleming and et al., 2007). The network dynamics of innovating agents provide the basis for the emergence of new technological knowledge, which is in turn represented as an organic structure, characterized by elementary units and by the connections amongst them. The use of such variables implies therefore a mapping between technology as an act and technology as an artefact (Arthur, 2009; Lane et al., 2009; Krafft and Quatraro, 2011). Co-occurrences matrixes are very similar to design structure matrixes (DSM) (Baldwin and Clark, 2000; Murmann and Frenken, 2006; Baldwin, 2007), in that they can be thought as adjacency matrixes in which we are interested not only in the link between the elements, but also by the frequency with which such links are observed.
In other words these measures capture the design complexity of knowledge structure, and allow for featuring the innovation behaviour of firms, as well as its evolution, in relation with the changing architecture of such structure (Henderson and Clark, 1990; Murmann and Frenken, 2006). In this perspective, an increase in knowledge coherence is likely to signal the
4
The limits of patent statistics as indicators of technological activities are well known. The main drawbacks can be summarized in their sector-specificity, the existence of non-patentable innovations and the fact that they are not the only protecting tool. Moreover the propensity to patent tends to vary over time as a function of the cost of patenting, and it is more likely to feature large firms (Pavitt, 1985; Griliches, 1990). Nevertheless, previous studies highlighted the usefulness of patents as measures of production of new knowledge. Such studies show that patents represent very reliable proxies for knowledge and innovation, as compared to analyses drawing upon surveys directly investigating the dynamics of process and product innovation (Acs et al., 2002). Besides the debate about patents as an output rather than an input of innovation activities, empirical analyses showed that patents and R&D are dominated by a contemporaneous relationship, providing further support to the use of patents as a good proxy of technological activities (Hall et al., 1986).
5
It must be stressed that to compensate for intrinsic volatility of patenting behaviour, each patent application is made last five years.
9
adoption of an exploitation strategy, while a decrease is linked to exploration strategies. Increasing values of cognitive distance are instead related to random screening across the technology landscape, while decreasing cognitive distance is more likely to be linked to organized search behaviour. Knowledge variety is likely to increase in any case when new combinations are introduced in the system. (Krafft, Quatraro, Saviotti, 2009).
Consistently with the theoretical framework lied down in the previous section, we expect the survival rates of the firms to be positively related to knowledge coherence and knowledge variety, and negatively related to cognitive distance.
3.2.3 Control variables
Besides the effects of the knowledge related variables, we also control for the effects of a number of variables that have proved to affect the survival likelihood in previous empirical settings.
To this purpose we include in the regressors vector the current size of the firm at the beginning of the period of observation. The variable is derived by the DIANE dataset and measured as the log of firms’ sales at 2002. Moreover, in order to account for possible non-linear effects of size on survival, we also included the squared term of firm size in the econometric estimation (Evans, 1987; Hall, 1987).
Also firm’s age has been found to affect survival patterns. The age of the firm is calculated in terms of elapsed years since the foundation of the firm. Also in this case, since the relationship between age and survival can be non-linear and take a U-inverted shape, we included the squared term of age in the econometric model (Evans, 1987; Bruderl and Schussler, 1990). Moreover, we also accounted for the possibility for size and age to interact (Cefis and Marsili, 2006).
In addition to size and age, we also accounted for the effects of differential growth rates at the beginning of the observed period (Agarwal, 1997). We calculated firm’s growth as the log difference of firms sales between 2002 and 2001.
Finally, we also controlled for differences in the technological regimes of the sector in which firms operate (Agarwal and Audretsch, 2001). In this perspective we classified the sampled firms according to Pavitt’s taxonomy (1984) in science-based, supplier-dominated, specialized suppliers and scale-intensive.
>>> INSERT Table 2 ABOUT HERE <<<
Table 2 provides a synthesis of the variables that we will use in the empirical analysis.
3.3 Methodology
In order to evaluate the effects of the structural properties of firms’ knowledge bases on post-entry performances we focus on the survival time of the firm which is a duration variable. If T indicates the number of months that our firms have survived up to December 2011, then we can write the cumulative distribution function F of the duration time T as follows:
10
, t ≥ 0 (1)
This specification gives the probability that the duration T is less than or equal to t. In other words, this function represents the probability that a firm exits the population before t months after December 2001.
The survival function is then defined as:
(2)
Which represents the probability that a firm survives t months after December 2001.
The analysis is articulated in two steps. First of all we check the extent to which differences in survival rates in sampled firms can be explained by the ability to successfully undertake knowledge creation activities. In this perspective we calculated the empirical survival function by using the life-table approach (Kalbfleish and Prentice, 1980) and then estimated the survival functions for different categories of firms on the basis of their innovative performance. In this step, we simply distinguished between innovators and non-innovators by generating a dummy which takes value 1 if the knowledge capital stock of the firm is different from 0. We also performed statistical test of equality of survival distributions across the different categories of firms, and in particular the log-rank, the Wilcoxon and the Cox test.
While this former step allows us to assess whether knowledge assets may provide an explanation of post-entry performances, the purpose of this paper goes well beyond this. Once we acknowledge the role of knowledge creation activities, we aim at investing whether differential survival patterns within the innovators subsample are explained by the structural properties of firms knowledge base. This leads us to estimate a duration model in which the survival time is function of a vector of covariates which consists of the measures described in Sections 3.2 and 3.3.
In the literature different empirical strategies have been followed to empirically estimate the determinants of differential survival rates. A number of papers have adopted traditional estimation models for binary categorical variables. Audrestch (1991) implements a logit analysis on survival rates, while Helmers and Rogers (2010) adopt a probit regression on the probability of exit of firms. Fritsch et al. (2007) use an OLS estimation on survival rates, in a framework better suited to tobit regression. On a different perspective, some other papers have instead made explicit use of duration models. Audretsch and Mahmood (1995) and Agarwal and Audretsch (2001) implemented a Cox proportional hazardregression, which is based on hazard rations. Cefis and Marsili (2006) used a parametric approach based on accelerated time models.
In this paper we will follow this latter approach, as the test based on Schoenfeld residuals suggests that our data violates the proportional hazard assumption. The accelerated time models assume a linear form for the effects of the explanatory variables on survival time and also for the underlying survival function. The data in our dataset, as is often the case in duration models, are well suited to be represented by a lognormal distribution.
The accelerated time model estimated with survival time distributed as a lognormal is given by:
11
(3)
Where T is the survival time, X is the matrix of explanatory variables (see Table 2), is the vector of the coefficients to be estimated and is the vector of the residuals assumed to be normally distributed. Since all the explanatory variables are calculated in logarithms, the coefficients of the model can be interpreted as the elasticities of the covariates on the expected survival time. The parameters are estimated by maximum likelihood.
4 Results
4.1 Descriptive Statistics
Before presenting the results of the econometric estimations, we compare the general characteristics of the sampled firms, with a special focus on the distinction between innovating and non-innovating firms.
Table 3 presents the descriptive statistics for all the explanatory variables. Of course, non-innovating firms do not display any statistics for what concerns the knowledge-related variables, and knowledge capital is null. Let us recall that size is measured in term of sales. The data show that on average the size of non-innovating firms is close to the overall mean, although significantly lower than the average size of innovating firms. A similar evidence concerns also firms’ age. Indeed non-innovating firms show values very close to the overall figure. Moreover, non-innovating firms in our sample are on average younger than innovating firms.
>>> INSERT Table 3 ABOUT HERE<<<
We also compare the two group of firms for what concerns their sectoral distribution in terms of Pavitt’s sectors (Table 4). The two groups are clearly different also in this respect. Indeed the bulk of non-innovating firms (59.24%) is in the suppliers dominated sector, followed by the science based sector (20.63%), while most of innovating firms (49.71%) are in the science-based sector, followed by the scale and information intensive sector (22.11%).
>>>INSERT Table 4ABOUT HERE <<<
Table 5 reports the correlation matrix for survival time (number of months a firm survives since December 2001), the knowledge-related variables and the control variables. As expected age is positively and significantly correlated with firm’s survival. The same applies also for knowledge capital. This latter also shows a high and significant correlation with the other knowledge-related variables. For this reason we use knowledge capital only in first step of our empirical strategy, which is aimed at assessing the impact of innovative behaviour on survival. Actually in the second step we focus on the impact on knowledge-related variable on the survival on the sub-sample of innovating firms.
12
4.2 Univariate and graphical analysis
In order to assess the impact of the properties of knowledge base on the likelihood of firms survival we first investigate whether engaging in knowledge creating activities can explain to some extent the variety in post-entry performances. In this direction, we report in Table 6 the life-table estimates of survival rates of the two groups, i.e. innovators and non-innovators. The two groups are identified on the basis of the values of the knowledge capital stock variable. In particular innovators are those firms for which the logarithm of knowledge capital is higher than zero. The table shows that at the end of the observed period the percentage of firms that exited is about 27% for the non-innovators and about 24% for the innovators. At the end of the period the survival rate of non-innovators was about 5% lower than that of innovators. We can also notice that for most of the observed years the survival rate of non-innovators is lower than that of innovators.
>>> INSERT Table 6 ABOUT HERE <<<
An alternative way to grasp these different patterns can be represented by the plot of the Kaplan-Meier survivor function (Figure 1). The Kaplan-Meier estimator (Kaplan and Meier, 1958) is a simple frequency non-parametric estimator, and as such it does not make any ex-ante assumption about the distribution of exit times. The estimator is given by:
(4)
Where ni denotes the number of firms in the risk set at ti and dithe number of exits at ti. The
product is over all observed exit times that are less than or equal to t.
>>> INSERT Figure 1 ABOUT HERE <<<
The graph shows that actually the function for innovators (dashed line) is above the one representing the survival rates of non-innovators (continuous line). Finally, we also investigated whether the differences between the survival functions are statistically significant. To this purpose we implemented three statistical tests reported in Table 7. It can be seen that in all of the tests the differences between innovators and non-innovators are significant at the 1% level.
>>> INSERT Table 7ABOUT HERE <<<
The analysis conducted so far suggests that engaging in technological activities may enhance the probabilities for firms to survive. In this respect, the results are much in line with the existing literature on the subject. The analysis of the effect of the properties of firms’ knowledge bases requires however the adoption of a regression framework allowing for the evaluation of the effects of the different covariates.
4.3 Multivariate analysis
In this section we provide an empirical account of the relationship between firms’ characteristics and firm survival. To this purpose we estimated a parametric survival model
13
with lognormal distribution, including a set of firm-specific covariates. Following Cefis and Marsili (2005), we estimated different specifications of the model by adopting a three-stage hierarchical procedure.
The first specification (Model 1) is aimed at assessing the contribution of knowledge capital stock. This specification not only allows for a direct comparison between innovators and non-innovators, but also an assessment of the effects of differential endowments in terms of knowledge capita. The base model 1.A takes into account firm size and age as control variables, while in the model 1.B we also include the squared terms on size and age. Finally model 1.C also includes the control for firms’ growth. The second specification is aimed at assessing the differential impact of the properties of the knowledge base. This estimation is therefore restricted to the sub-sample of innovating firms, as according to our definition non-innovators does not possess any measurable knowledge base. The procedure aimed at assigning a zero values for the properties of the knowledge base would not work indeed, as the zero value does not stand for the absence of the property. For example, knowledge coherence may take both positive and negative values, i.e. zero is in the interval of possible values and would signal the presence of an average level of integration of the knowledge base. In the same vein, a zero value for cognitive distance would imply a knowledge base built upon the recombination of very similar technologies. The hierarchy of Model 2 is the same as the one of Model 1. Model 2.A includes only size and age as firm control variables, Model 2.B extends the covariates list to the squared terms of size and age and finally Model 2.C also accounts for the firms’ differential growth rates. Sectoral dummies are included in all of the specifications.
>>> INSERT Table 8 ABOUT HERE <<<
The results of the econometric estimations are reported in Table 8. As for Model 1,the coefficients for size and age are also quite robust across the three specifications. In particular, size shows a negative and significant coefficient, while age a positive and significant one. The evidence on size is not in line with the literature. However, when we include the squared effect on size, the situation gets clearer. Indeed the sign on the coefficients suggest the existence of a U-shaped relationship between size and survival rate, according to which the likelihood to survive begins to increase beyond a critical value of firms’ size. This is also reflected by the fact that innovators in our sample show an average size significantly higher than non-innovators. The coefficient on the squared age term suggests instead the existence of an inverted U-shaped relationship with firm survival, as indicated in some previous analyses (Audretsch and Mahmood, 1994; Wagner, 1994). The coefficient on knowledge capital turns out to be positive and statistically significant across the three specifications. This is consistent with what we have observed in the univariate analysis and supports the idea that the more a firm commits resources to the development of their knowledge base the higher are its chances to survive. However this is only part of the story.
In the theoretical framework articulated in Section 2 we indeed formulated the hypothesis that not only knowledge matters from a quantitative viewpoint, but also from a qualitative one. By adopting a collective knowledge approach, we propose to characterize the structure of firms’ knowledge base on the basis of three properties, i.e. knowledge coherence, cognitive distance and knowledge variety. The former provides of a measure of the degree of complementarity across the bits of knowledge that are combined together in the knowledge base. The second provides a measure of the extent to which the combined knowledge bits are dissimilar while the latter refers to the degree of technological differentiation.
14
The idea is that the contribution of technological activities to survival changes according to the kind of search strategies followed by innovating firms. Competence-enhancing search activities based upon the exploitation of accumulated knowledge are indeed more likely to increase the chances of success of knowledge creation activities. On the contrary, competence-destroying approaches based upon exploration strategies and random screening across an uncertain technology landscape makes it more difficult to engage in successful knowledge creation. This has an obvious impact on the survival patterns of innovating firms. The results of Model 2 provide full support to our hypotheses. The coefficient on knowledge coherence, like the one on knowledge variety, is indeed positive and significant across the three specifications. On the opposite, cognitive distance shows a negative and significant coefficient.
This is consistent with the idea that the higher the degree of technological variety, the higher the success of innovation activities and hence the higher the profitability of the firm. This affects also the likelihood of firms’ survival. However, the positive effect of knowledge variety is not related with the combination of knowledge bits, no matter which technological domain they come from. On the contrary, the coefficients on knowledge coherence and cognitive distance suggest that firms searching in areas of the technological landscape with which they are more familiar, have higher chances to survive. In other words, the direction of knowledge efforts with respect to the competences cumulated over time matters in shaping the post-entry performance of firms.
5 Conclusions and Policy Implications
One basic issue in the paper, consistent with the literature, is that survival likelihood should not be related only to age and size. Age and size are firms characteristics that allow for a distinction between the formative stages of the industry and the more mature ones, explaining why and how firms maintain themselves in the market over a medium or longer time period. However, age and size are not the only dimensions to be taken into account. The idea that firms engage in product innovation in the explorative stages, and succeed to survive in the exploitation phases as they move progressively or more drastically into process innovation has been also debated as a crucial issue. In that perspective, the main outcome of the paper, contributing to the advancement of the literature, is that we get to know how this intentional process of engaging innovation matters for firms survival in the dynamics in the industry. Summing up, the value of the theoretical view developed in this paper is thus the following: using such an analysis we grasp the way in which firms influence the development of the industry, while most of the existing contributions rest on how the innovation strategies are shaped by the emergence, growth, maturity and decline of sectors.
The recombinant and collective approach chosen to develop that paper provides a general framework to understand how search processes along the technological landscape can be computed by innovative firms, taking into account that this search process may be more or less diversified, coherent, and based on the combination of more or less distant bits of knowledge. On the issue of survival, the rationale behind this theoretical framework is that firms engaging an innovation process necessarily have to combine different pieces of knowledge in the perspective or creating new competences, and that this combination needs to be coherent over time with ability of firms to generate complementarities, and has to be marked by a rather smooth development of competences rather than by radical and dissimilar
15
associations. Our empirical study sustains these research assumptions, as it shows that there is a positive and significant relationship between variety and survival, a positive and significant relationship between coherence and survival, and a negative and significant relationship between cognitive distance and survival. This means that if they wish to survive longer, firms have thus to maintain a large variety of technological classes in their patent portfolios, controlling for complementarity effects and avoiding ruptures in the development of the knowledge base.
These results stimulate some recommendations at the policy level. Public and private efforts should of course be devoted to motivate the engagement of innovation strategies, especially the ones that involve patent applications by firms. However, such a target has to be analysed in details, as the engagement of innovation strategies may endanger in itself the survival of innovative firms, if the technologies to be coordinated are too dissimilar, involving the inability to develop a learning dynamics and a smooth development for technological change. In that perspective two areas should deserve a specific attention to policy makers. In both cases these are not brand new areas, but rather existing areas that need to be refreshed in view of the results presented in that paper. The first one is the development of clusters, technological platforms, and innovation networks that would not be elaborated only on the dimension of geographical proximity, or firms characteristics of age and size. Rather the way in which firms conduct their innovation strategies, some of them being more experts than others in avoiding the implications of large technological breakthroughs, should be promoted as key actors in the dynamics of development of clusters, platforms and networks. The second one lies in the resurrection of demand side innovation policies, including all public measures to induce innovation and/or speed up diffusion of innovation through increasing the demand for innovations, defining new functional requirements for products and services or better articulating demand. At a practical level, public procurement of innovation which is adopted in a lot of OECD countries, but tends to be underdeveloped in other countries especially in France, should be considered as one way to smooth the process of development of young, innovative firms, and increase their survival over time. The role of public intervention is thus non neutral in that case, and should help in shaping the orientation of search efforts in local contexts, identifying and supporting firms that are the most likely to be the engines of innovation in the longer run. Far from the intention to interfere with market selection mechanisms, leading to inefficient implications effects, the way in which firms engage innovation and eventually take the risk of exiting prematurely is a matter of concern at the level of every advanced economies.
This paper provides some guidelines to take these issues into account, in a novel and operational way, opening up a research agenda where theoretical, empirical and political aspects are closely intertwined. It reaffirms that network and recombination approaches are essential in understanding these intertwinnings, by decomposing and interpreting the complex relationships that may exist between innovation and survival at a firm and industry level.
6 References
[43] Acs, Z.J., Anselin, L. and Varga, A., 2002, “Patents and innovation counts as measures of regional production of new knowledge”, Research Policy, 31, 1069-1085.
16
[54] Agarwal, R., 1991. “Survival of firms of the product life cycle”, Southern Economic
Journal, 63, 571-584.
[21] Agarwal, R. and Audretsch, D., 2001. “Does Entry Size Matter? The Impact of the Life Cycle and Technology on Firm Survival”, Journal of Industrial Economics, 49(1), 21-43.
[46] Arthur, 2009, “Complexity and the Economy”, Science, 284, 107-109.
[63] Attaran, M., 1985. “Industrial diversity and economic performance in U.S. areas”, The
Annals of Regional Science, 20, 44–54.
[2] Audretsch, D., 1991, “New-Firm Survival and the Technological Regime”, The Review of
Economics and Statistics, 73(3), 441-50.
[11] Audretsch, D., 1995. “Innovation, growth and survival”, International Journal of
Industrial Organization, 13(4), 441-457.
[59] Audretsch, D. and Mahmood, T. 1994, “Firm Selection and Industry Evolution: The Post-entry Performance of New Firms”, Journal of Evolutionary Economics, 4(3), 243-60.
[3] Audretsch, D. and Mahmood, T., 1995, “New Firm Survival: New Results Using a Hazard Function”, The Review of Economics and Statistics, 77(1), 97-103.
[12] Baldwin, J.R., 1995, The dynamics of industrial competition: A North American
perspective, Cambridge University Press, Cambridge.
[51] Baldwin, C.Y., 2007, “Where do transactions come from? Modularity, transactionsm and the boundaries of firms”, Industrial and Corporate Change, 17, 155-195.
[49] Baldwin, C.Y. and Clark, K.B., 2000, Design Rules, Volume I, The power of Modularity. Cambridge MA, MIT Press.
[27] Banbury, C. M. and W. Mitchell, 1995, “The effects of introducing important incremental innovation on market share and business survival' , Strategic Management
Journal, 16, 161-182.
[65] Boschma, R., and Iammarino, S., 2009. “Related Variety, Trade Linkages, and Regional Growth in Italy”, Economic Geography, 85(3), 289-311.
[75] Breschi, S., Lissoni, F., and Malerba, F., 2003, “Knowledge relatedness in firm technological diversification”. Research Policy, 32, 69-97.
[53] Bruderl and Schussler, 1990, “Organizational Mortality: The Liabilities of Newness and Adolescence”, Administrative Science Quarterly, 35, 530–547.
[9] Caves, Richard E., 1998, “Industrial Organization and New Findings on the Turnover and Mobility of Firms”, Journal of Economic Literature, 36(4), 1947-1982.
[24] Caves, R. and Porter, M., 1977, “From Entry Barriers to Mobility Barriers,” Quarterly
Journal of Economics, 91, pp. 241-261.
[4] Cefis, E., and Marsili, O., 2005, “A Matter of Life and Death: Innovation and Firm Survival”, Industrial and Corporate Change, 14(6), 1167-1192.
[5] Cefis, E., and Marsili, O., 2006, “Survivor: the Role of Innovation in Firms’ Survival”,
Research Policy, 35(5), 626-641.
[26] Christensen, C., Suarez, F., and Utterback, J., 1998, “Strategies for survival in fast-changing industries”, Management Science, 44, 207-S220.
[34] Dosi G., 1982, “Technological paradigms and technological trajectories”, Research
Policy, 11, 147–162.
[10] Dunne, T., Roberts, M. and Samuelson, L., 1988. “Patterns of Firm Entry and Exit in U.S. Manufacturing Industries”, RAND Journal of Economics, 19(4), 495-515.
[19] Ericson, R. and Pakes A., 1995, “Markov-Perfect Industry Dynamics: A Framework for Empirical Work”, Review of Economic Studies, 62, 53-82.
[17] Evans, D., 1987. “Tests of Alternative Theories of Firm Growth”, Journal of Political
17
[33] Fleming, L., 2001, “Recombinant Uncertainty in Technological Search”, Management
Science, 47(1), 117-132.
[45] Fleming, L., Mingo, S. and Chen, D., 2007, “Collaborative brokerage, generative creativity and creative success”, Administrative Science Quarterly, 52, 443-475. [64] Frenken, K., van Oort, F.G., Verburg, T., 2007, “Related variety, unrelated variety and
regional economic growth”, Regional Studies, 41(5), 685–697.
[66] Frenken, K., and Nuvolari, A., 2004. “The early development of the steamengine: an evolutionary interpretation using complexity theory”, Industrial and Corporate
Change, 13, 419–450.
[57] Fritsch, M., Brixy, U. and Falk, O., 2006, “The Effect of Industry, Region, and Time on New Business Survival – A Multi-Dimensional Analysis”, Review of Industrial
Organization, 28, 285-306.
[15] Geroski, P., 1995, “What Do We Know about Entry?”, International Journal of
Industrial Organization, 13, 421-440.
[28] Griliches, Z., 1979, “Issues in Assessing the Contribution of Research and Development to Productivity Growth ”, Bell Journal of Economics, 10(1), 92-116.
[42] Griliches, Z., 1990, “Patent statistics as economic indicators: a survey”, Journal of
Economic Literature, 28, 1661-1707.
[18] Hall, B. H., 1987, “The relationship between firm size and firm growth in the US manufacturing sector”, The Journal of Industrial Economics, 35(4), 583-606.
[44] Hall, B.H., Griliches, Z., Hausman, J.A., 1986, “Patents and R&D: is there a lag?”,
International Economic Review, 27, 265–283.
[6] Helmers C., and Rogers, M., 2010, “Innovation and the Survival of New Firms in the UK ”," Review of Industrial Organization, 36(3), 227-248.
[53] Henderson R.M. & K.B. Clark, 1990, “Architectural Innovation: The Reconfiguration of Existing Product Technologies and the Failure of Established Firms”, Administrative
Science Quarterly.
[74] Jaffe, A.B, 1989, “Characterising the technological position of firms, with application to quantifying technological opportunity and research spillovers”, Research Policy, 18, 87–97.
[73] Jaffe, A.B., 1986, “Technological opportunity and spillovers of R&D: evidence from firms’ patents, profits, and market value”, American Economic Review, 76, 984–1001. [16] Jovanovic, B., 1982, “Selection and evolution of industry”, Econometrica 50 (3), 649–
670.
[56] Kalbfleisch JD, Prentice RL., 1980, Statistical Analysis of Failure Time Data, New York: Wiley.
[59] Kaplan, E. L. and Meier P., 1958, “Non-parametric Estimation from Incomplete Observations”. J. Am. Stat. Assoc., 53, 457–481.
[38] Katila, R. and Ahuja, G., 2002, “Something old, something new: a Longitudinal Study of Search Behavior and New Product Introduction”, Academy of Management Journal, 45(6), 1183-1194.
[31] Kaufman, S., 1993. Origins of Order: Self-organization and Selection in Evolution, Oxford University Press, Oxford.
[22] Klepper, S., 1996. “Entry, Exit, Growth, and Innovation over the Product Life Cycle”,
American Economic Review, 86(3), 562-83.
[23] Klepper, S., 1997, “Industry Life Cycles”, Industrial and Corporate Change, 6(1), 145-81.
[48] Krafft and Quatraro, 2011, “The dynamics of technological knowledge”, in Antonelli, C. (ed), Handbook on System Dynamics of Technological Change, Cheltenham: Edward Elgar.
18
[7] Krafft, J., Quatraro, F., Saviotti, P.P., 2009. Evolution of the knowledge base in knowledge intensive industries, LEI and BRICK Working Paper no. 06/2009.
[67] Krafft, J., Quatraro, F., and Saviotti, P., 2011, “The knowledge base evolution in biotechnology: A social network analysis”, Economics of Innovation and New
Technology, 20(5), 1-31.
[47] Lane, D.A., van Der Leeuw, S.E., Pumain, D., West, G. (eds.), 2009, Complexity
perspectives in innovation and social change. Springer, Berlin.
[29] Mansfield, E., 1980, “Basic research and productivity increase in manufacturing”,
American Economic Review, 70, 863-73.
[37] March, J., 1991, “Exploration and exploitation in organizational learning”, Organization
Science, 2(1), 71-87.
[14] Mata, J., Portugal, P., 1994, “Life duration of new firms”, Journal of Industrial
Economics, 42 (3), 227–246.
[50] Murmann, J., and Frenken, K., 2006, “Toward a systematic framework for research on dominant designs, technological innovations, and industrial change”, Research Policy, 35(7), 925-952.
[20] Nelson, R.R., Winter, S.G., 1982. An Evolutionary Theory of Economic Change. Belknap Press of Harvard University Press, Cambridge, MA.
[70] Nesta, L., 2008, “Knowledge and productivity in the world’s largest manufacturing corporations”, Journal of Economic Behavior and Organization, 67, 886–902.
[68] Nesta, L., Saviotti, P., 2005, “Coherence of the knowledge base and the firm’s innovative performance: evidence from the U.S. pharmaceutical industry”, Journal of Industrial
Economics, 53, 123–142.
[69] Nesta, L., Saviotti, P.P., 2006, “Firm knowledge and market value in biotechnology”,
Industrial and Corporate Change, 15, 625–652.
[32] Nightingale, P., 1998, “A cognitive model of innovation”, Research Policy, 27(7), 689-710.
[72] Nooteboom, B., 2009, A cognitive theory of the firm; Learning, governance and dynamic
capabilities, Cheltenham UK: Edward Elgar.
[55] Pavitt, K., 1984, “Sectoral patterns of technical change: towards a taxonomy and a theory”, Research Policy, 13: 343–373.
[41] Pavitt, K., 1985, “Patent statistics as indicators of innovative activities: possibilities and problems”, Scientometrics, 7, 77–99.
[25] Perez, S., Llopis, A. and Llopis, J., 2004, The determinants of survival of Spanish manufacturing firms, Review of Industrial Organization, 25, 251-273.
[20] Quatraro, F, 2012, The Economics of Structural Change in Knowledge, London and New York, Routledge.
[1] Santarelli, E. and Vivarelli, M., 2007. “Entrepreneurship and the process of firms’ entry, survival and growth”, Industrial and Corporate Change, 16(3), 455-488.
[61] Saviotti, P.P., 1988, “Information, variety and entropy in technoeconomic development”,
Research Policy, 17, 89–103.
[35] Saviotti, P.P., 2004, “Considerations about the production and utilization of knowledge”,
Journal of Institutional and Theoretical Economics, 160, 100-121.
[36] Saviotti, P.P., 2007, “On the dynamics of generation and utilisation of knowledge: The local character of knowledge”, Structural Change and Economic Dynamics, 18, 387-408.
[13] Sutton, J., 1997, “Gibrat's legacy”, Journal of Economic Literature, 35(1), 40-59. [71] Teece, D., Rumelt, R., Dosi, G. And Winter, S., 1994, “Understanding Corporate
Coherence: Theory and Evidence”, Journal of Economic Behavior and Organization, 23, 1–30.
19
[72] Theil, H., 1967, Economics and Information Theory, North-Holland, Amsterdam.
[40] Thoma, G., Torrisi, S., Gambardella, A., Guellec, D., Hall, B.H. and Haroff, D., 2010, Harmonizing and combining large datasets – an application to firm-level patent and accounting data, NBER Working Paper 15851.
[39] Tushman M.L., and Anderson P., 1986, “Technological discontinuities and organizational environments”, Administrative Science Quarterly, 31, 439-465.
[60] Wagner, J., 1994, “The post-entry performance of new small firms in German manufacturing industries”, The Journal of Industrial Economics, 42(2), 141-154. [30] Weitzman, M. L., 1998, “Recombinant growth”, Quarterly Journal of Economics, 113,
20
Appendix A – The properties of knowledge structure
Knowledge Variety
We decided to measure variety in firms’ knowledge base by using the information entropy index. Entropy measures the degree of disorder or randomness of the system, so that systems characterized by high entropy will also be characterized by a high degree of uncertainty (Saviotti, 1988).
Such index was introduced to economic analysis by Theil (1967). Its earlier applications aimed at measuring the diversity degree of industrial activity (or of a sample of firms within an industry) against a uniform distribution of economic activities in all sectors, or among firms (Attaran, 1985; Frenken et al., 2007; Boschma and Iammarino, 2009).
Differently from common measures of variety and concentration, the information entropy has some interesting properties (Frenken and Nuvolari, 2004). An important feature of the entropy measure, which we will exploit in our analysis, is its multidimensional extension. Consider a pair of events (Xj, Ym), and the probability of co-occurrence of both of them pjm. A two
dimensional (total) entropy measure can be expressed as follows (firm and time subscripts are omitted for the sake of clarity):
q j w m jm jm p p Y X H 1 1 2 1 log ) , ( (A1)If one considers pjm to be the probability that two technological classes j and m co-occur
within the same patent, then the measure of multidimensional entropy focuses on the variety of co-occurrences of technological classes within firms’ patents portfolios.
Moreover, the total index can be decomposed in a “within” and a “between” part anytime the events to be investigated can be aggregated in a smaller numbers of subsets. Within-entropy measures the average degree of disorder or variety within the subsets, while between-entropy focuses on the subsets measuring the variety across them. It can be easily shown that the decomposition theorem holds also for the multidimensional case. Hence if one allows jSg
and mSz(g = 1,…,G; z = 1,…, Z), we can rewrite H(X,Y) as follows:
G g Z z gz gz Q P H H Y X H 1 1 ) , ( (A2)Where the first term of the right-hand-side is the between-group entropy and the second term is the (weighted) within-group entropy. In particular:
G g Z z gz gz Q P P H 1 1 2 1 log (A2a)21
g Z S j m S jm gz p P (A2b)
g z S j m S gz jm gz ij gz P p P p H / 1 log2 (A2c)Following Frenken et al. (2007), we can refer to between-group and within-group entropy respectively as unrelated technological variety (UTV) and related technological variety (RTV), while total information entropy is referred to as general technological variety (TV). The distinction between related and unrelated variety is based on the assumption that any pair of entities included in the former generally are more closely related, or more similar to any pair of entities included in the latter. This assumption is reasonable when a given type of entity (patent, industrial sector, trade categories etc.) is organized according to a hierarchical classification. In this case each class at a given level of aggregation contains “smaller” classes, which, in turn contain yet “smaller” classes. Here, small refers to a low level of aggregation.
We can reasonably expect then that the average pair of entities at a given level of aggregation will be more similar than the average pair of entities at a higher level of aggregation. Thus, what we call related variety is measured at a lower level of aggregation (3 digit class within a 1 digit macro-class) than unrelated variety (across 1 digit macro-classes). This distinction is important because we can expect unrelated (or inter-group) variety to negatively affect productivity growth, while related (or intra-group) variety is expected to be positively related to productivity growth. Moreover, the evolution of total variety is heavily influenced by the relative dynamics of related and unrelated variety, such that if unrelated variety is dominant the effects of total variety on productivity growth can be expected to be negative, while the opposite holds if related technological variety dominates the total index (Krafft, Quatraro, Saviotti, 2011).
Knowledge Coherence
Third, we calculated the coherence (R)of firms’ knowledge base, defined as the average complementarity of any technology randomly chosen within the firm’s portfolio with respect to any other technology (Nesta and Saviotti, 2005 and 2006; Nesta, 2008).
To yield the knowledge coherence index, a number of steps are required. In what follows we will describe how to obtain the index at the firm level. First of all, one should calculate the weighted average relatedness WARi of technology i with respect to all other technologies
present within the sector. Such a measure builds upon the measure of technological relatedness , which is introduced in Appendix A. Following Teece et al. (1994), WARj is
defined as the degree to which technology j is related to all other technologies mj within the
firm i, weighted by patent count Pmit: