HAL Id: hal-02392410
https://hal.archives-ouvertes.fr/hal-02392410
Submitted on 10 Dec 2019HAL is a multi-disciplinary open access
archive for the deposit and dissemination of sci-entific research documents, whether they are pub-lished or not. The documents may come from teaching and research institutions in France or
L’archive ouverte pluridisciplinaire HAL, est destinée au dépôt et à la diffusion de documents scientifiques de niveau recherche, publiés ou non, émanant des établissements d’enseignement et de recherche français ou étrangers, des laboratoires
Effect of sub-surface hydrogen on intrinsic crack tip
plasticity in aluminium
Yu Wang, D. Connétable, Döme Tanguy
To cite this version:
Yu Wang, D. Connétable, Döme Tanguy. Effect of sub-surface hydrogen on intrinsic crack tip plasticity in aluminium. Philosophical Magazine, Taylor & Francis, 2019, 99 (19), pp.2355-2375. �10.1080/14786435.2019.1624850�. �hal-02392410�
HAL Id: hal-02392410
https://hal.archives-ouvertes.fr/hal-02392410
Submitted on 10 Dec 2019HAL is a multi-disciplinary open access
archive for the deposit and dissemination of sci-entific research documents, whether they are pub-lished or not. The documents may come from
L’archive ouverte pluridisciplinaire HAL, est destinée au dépôt et à la diffusion de documents scientifiques de niveau recherche, publiés ou non, émanant des établissements d’enseignement et de
Effect of sub-surface hydrogen on intrinsic crack tip
plasticity in aluminium
Y. Wang, D. Connétable, D. Tanguy
To cite this version:
Y. Wang, D. Connétable, D. Tanguy. Effect of sub-surface hydrogen on intrinsic crack tip plas-ticity in aluminium. Philosophical Magazine, Taylor & Francis, 2019, 99 (19), pp.2355-2375. �10.1080/14786435.2019.1624850�. �hal-02392410�
Effect of sub-surface hydrogen on intrinsic crack tip plasticity in aluminium
Y. Wanga,b, D. Conn´etableb and D. Tanguya∗
aUniversit´e de Lyon, Universit´e Claude Bernard Lyon 1, CNRS, Institut Lumi`ere
Mati`ere, F-69622 Villeurbanne Cedex, France;
bCIRIMAT UMR 5085, CNRS-INPT-UPS, ´Ecole Nationale d’Ing´enieurs en Arts
Chimiques et Technologiques (ENSIACET) 4, all´ee ´Emile Monso, BP 44362, F-31030 Toulouse Cedex 4, France
ARTICLE HISTORY Compiled June 3, 2019 ABSTRACT
The effects of sub-surface hydrogen and mixed mode loading on dislocation emission in aluminium are studied using a combination of techniques including: crack sim-ulations with an empirical interatomic potential, generalised stacking fault energy (GSF) calculations, with empirical interactions and Density Functional Theory, and the model by Rice which links the critical stress intensity factor to the unstable stacking energy. The crack orientation is {111}h112i and the loading is composed of a moderate traction along h111i and a shear along h112i, such that Shockley partials are emitted along the crack plane. The role of the relaxations around the H atoms and of the concentration of H in the glide plane, in the GSF calculation, are revealed by comparing Rice’s model to the results of brute force simulations. The enhanced GSF is then calculated ab initio. The conclusion is a large decrease of the critical load to emit a dislocation, due to the displacement transverse to the glide direction. The effect of sub-surface hydrogen is negligible with respect to the mechanical one.
1. Introduction
Hydrogen is ubiquitous in metallic materials in service [1, 2]. When they come in con-tact with an aqueous medium, for example, H is produced by electrochemical reactions involving the reduction of protons coming from the dissociation of water molecules. Most of the adsorbed hydrogen Hads recombines but a small fraction penetrates the
lattice as interstitial atoms. Then, hydrogen interacts with crystalline defects and fea-tures of the microstructure and often degrades the material’s mechanical properties. In particular, it can render a ductile material brittle. Different scenarios have been pro-posed to explain the physical origin of this embrittlement, such as: decohesion [3–5], intense and localised plasticity [6–9], enhanced dislocation production at the crack tip due to adsorbed hydrogen [10] and production of vacancies stabilised by hydrogen [11– 13]. Some of the physical ingredients proposed in these scenarios have been tested by atomic scale simulations, such as: the loss of cohesion of grain boundaries due to a static segregation of hydrogen [14, 15] or to nanoscale cavities [16, 17], the interaction
between dislocations and vacancy-hydrogen clusters [18, 19], or the shielding of elastic interactions between dislocations by the Cotrell atmospheres [20]. In spite of progress, a quantitative microscopic model of embrittlement has not been achieved yet.
The purpose of this paper is to contribute to the quantification of the effect of hydrogen on dislocation emission from the crack tip itself. Two recent studies [21, 22], based on the Density Functional Theory (DFT) applied at model crack tips, are reported in the literature. The configuration studied in [21] is a blunted crack in a {110} plane, propagating in the h111i direction (crack front along h112i). It is shown that the response of the crack tip to an external load largely depends on the surface site where the H atoms are adsorbed, i.e. bridge or top, and also on how stretched the Al-Al bonds are. In bridge position, H can have no effect or slightly increase the critical load for dislocation emission kIe. kIeis the stress intensity factor for dislocation
emission in mode I (traction). It represents the elastic singularity at the nano scale, in the absence of extrinsic plasticity and is typically below 1 M P a√m [16, 23], contrary to engineering toughness. In sub-surface position, in the glide plane, hydrogen can slightly decrease kIe. A sharper crack, along the {111} plane, propagating in the h112i
direction (crack front along h110i) is studied in [22]. In this case, kIe is increased
by 26% in the presence of Hads. In complement of these studies, we quantify the
influence of sub-surface hydrogen, in the {111} h112i crack orientation, under mixed mode loading. The critical stress intensity factor for emission along the crack plane, in mode II, under the influence of an additional mode I loading and in the presence of a hydrogen concentration CH in the glide plane, kIIe(kI,CH), is calculated. The paper
is organised as follows. First, the modelling strategy and the technical details of the different methods are given. Second, kIIe(kI,CH) values, obtained from mixed mode
loading crack simulations are reported, in the pure metal case first and then in the presence of hydrogen. The values of the opening ∆uz at the crack tip, at the onset of
dislocation emission, are calculated. Third, the effects of H and ∆uzon the generalised
stacking fault energy (GSF) are evaluated, with empirical atomic interactions and with DFT. The analytical model by Rice [24] is used to obtain kIIe(kI,CH) from the
DFT calculations. Finally, a conclusion on the effect of sub-surface hydrogen v.s. a mechanical effect of the opening perpendicular to the glide plane is given.
2. Simulation and Modelling details
The modelling strategy is motivated by the need to use DFT to obtain reliable kIIe
values. The analytical model derived by Rice in [24] for kIIe is exact when emission
occurs along the crack plane. It relates kIIe to the unstable stacking energy γus (the
local maximum of the GSF in the glide direction) by
kIIe=p2µγus(∆uz(kI, CH), CH)/(1 − ν) (1)
where µ and ν are the shear modulus and Poisson ratio of the material. Mode I can be taken into account [25, 26] provided the proper transverse opening ∆uz is included in
the calculation of γus. Furthermore, including H in the GSF increases the complexity
of the calculation because the neighbourhood of the H atom needs to be relaxed, while the GSF is calculated by rigidly sliding two crystal blocks one on top of the other. As a consequence, the modelling strategy involves several steps:
containing an internal crack, quasi-statically loaded in mode II until dislocation emission occurs. A small mode I is superimposed. kIIe(kI,CH) values are
ex-tracted from the stress maps calculated at the atomic scale by a fit to the elastic solutions [26]. They are used as references.
• The transverse opening ∆uz is extracted from the crack opening profile
(sec-tion 3) when the load is immediately below the critical value, i.e. at k−IIe:
∆uz(y) = (u+z − u−z)(y) (2)
where y is the position along the crack plane (Fig. 1), u+
z (resp. u−z) is the
displacement is the z direction (the traction direction) of the atoms of the upper (resp. lower) plane, in first neighbour of the glide plane.
• ∆uz is included in the calculation of the GSF from which γus is extracted
(sec-tion 4.2). In every of these first steps, the interac(sec-tions are given by the same empirical interatomic potential. Rice’s model gives kIIe from γus according to
equation 1. Such kIIevalues are compared to the ones obtained by the crack
sim-ulations in order to validate which concentration CH, which relaxations around
the H atoms and which ∆uz values should be used in the GSF calculations in
order to reproduce the references (the kIIefrom brute force QMD). Indeed, even
if a full line of hydrogen is introduced in the crack simulations, its effect on kIIe
is not coherent with a GSF calculation with 100% coverage with hydrogen. The optimal coverage is an output of the comparison between the crack simulations and Eq. 1. Furthermore, the precise location where ∆uz should be measured in
the crack simulation is also an output of the procedure.
• After this validation, Eq. 1 is used with γus values calculated from DFT (section
4.3) and conclusions are drawn about the effect of H and transverse mechanical loading on dislocation emission.
2.1. Crack simulation set-up
Molecular Statics is used with a single crystal Al containing an internal crack. The crack problem is schematically represented in Fig. 1. The simulation box is a thin par-allelepiped whose sides are 3,4 nm × 54,4 nm× 58,8 nm defined by the axes x = [110], y = [112] and z = [111],respectively. These directions are defined in the canonical base of the fcc lattice. Periodic boundary conditions are applied in the x and y directions. The calculation is three dimensional in the fcc structure, but the dimension in x is reduced. The initial crack is introduced along the (111) plane by removing two atomic layers in the box centre. Its length 2a, along the y direction, is 6.4 nm (equal to 16 a0,
where a0 is the lattice parameter 4.04 ˚A). The crack length is small but large enough
to define kI and reach a good agreement with elasticity [27]. The size of the box is
therefore five times larger than the crack. This is sufficient to obtain a good agree-ment between the stress fields calculated atomistically and the analytic solution for a crack in an infinite elastic medium, in plane strain [26]. This geometry gives, in the x direction, an infinite crack front and an infinite dislocation line if emitted. The box size is eight times the crack length in the z direction. The particles in the three upper and lower layers, in the z direction, are fixed. The mechanical load is applied by giving the upper fixed layers a displacement (0, Uy, Uz). The mode I loading corresponds to
a displacement in z, Uz only. Mode II is a shear obtained by Uy only. A mixed mode
loading is obtained by superposition of mode I and mode II.
Figure 1. Schematic of the simulation box with an embedded crack. Uyand Uzare the displacements imposed
to the rigid grips to apply an external mechanical load to the internal crack.
the Al–Al part is the Mishin potential [28], the Al–H part is an upgrade of the potential presented in [29], full details can be found in [30]. The quantities considered for the fitting of the potential are listed below together with the values given by the potential. The reference values, from DFT are given in the next paragraph. The preferred bulk site is the tetrahedral interstitial site (T), with an energy difference between octahedral (O) and tetrahedral (T) of ∆EO−T = 0.147 eV. A vacancy contains multiple trap sites:
8 tetrahedral (T1) and 6 octahedral (O1) sites. T1 is the preferred position (∆Esegv =
−0.3 eV). The centre of the vacancy is an unstable position for H. The bulk migration barrier is 0.2 eV for a jump from a T site towards an O site. Surface segregation on the {111} surface, in the “threefold” configuration, is -0.46 eV. In addition, a constraint to destabilise the “on top” position was added in the fitting procedure such that it is metastable with a segregation energy of +0.36 eV. The H-H interaction is fitted to reproduce the effective pair interactions between some sites in a grain boundary [30]. It is repulsive.
The corresponding values given by the ab initio calculations from the literature are listed below. The energy difference between H in octahedral position and tetrahedral position is δEO−T=+0.02 eV (+0.13 eV) [31] with (without) zero point energy
correc-tion. The segregation energy in off-centred tetrahedral position in a vacancy is -0.33 eV (without ZPE) [31] and +0.46 eV in the centre of the vacancy [32]. The {111} surface segregation energy is -0.35 eV [5] and the activation energy for bulk diffusion is 0.18 eV (0.15 eV without ZPE) [31].
Quenched Molecular Dynamics (QMD) is used to optimise the system structure. The equations of motion are integrated with a Verlet algorithm, but the velocities are set to 0 when P
if · ~v < 0. QMD is run until the maximum force is at least~
lower than 10−3 eV/˚A. The crack is loaded quasi-statically. The stress fields after the minimisation are computed from the virial stress tensor. A displacement Uz is
first applied, when the system is relaxed, the value of kI is extracted from the Tzz
traction profile along the crack plane by a fit to an analytical solution (see details in [26]). Then the crack is loaded in mode II. Increasing values of Uy are applied which
fields. kII is extracted from the Tyz traction profile along the crack plane. It is the
specificity of the crack plane orientation (θ = 0) that mode I does not induce any shear load that superposes to the Tyz profile induced by the mode II and vice versa,
mode II does not create any opening traction along the crack plane. Then, the crack tip morphology is inspected. Dislocations are detected by their plastic displacement fields: they induce displacement discontinuities (∆ux, ∆uy, ∆uz) across their glide plane. ∆u
is the difference of the displacement field just above the glide plane, and just below. In the kI, kII space, two different events can occur [26]. At high values of kI, a Shockley
partial dislocation is emitted at an angle of approximately 70◦ from the crack plane,
on the {111} plane that intersects the crack front (the crack front is the intersect). Adding kII decreases the critical kI value for emission (kIe). At moderate and low kI
values, partial Shockley dislocations are emitted in the crack plane. The simulations in [26] show that kI should be lower than approximately 2/3 of kIe in the absence
of mode II if emission along the crack plane is wanted. Once the value of kI is fixed,
a set of calculations at increasing values of kII is performed, until the critical value
kIIe(kI) is reached and the dislocation is emitted. ∆uz is measured at the crack tip
at the load immediately below kIIe(kI). It is used in the calculation of γus to account
for the effect of mode I and H, since a part of ∆uz also comes from the relaxations
related to the presence of H, as will be shown below.
2.2. DFT calculation set-up
The final generalised stacking fault (GSF) energy calculations are done with DFT. They are performed with the VASP (Vienna Ab-initio Simulation Package) implemen-tation [33–35]. The Perdew-Burke-Ernzerhof (PBE) [36] exchange-correlation func-tional for the generalised-gradient-approximation (GGA) is used. A plane-wave basis set is employed within the framework of the projector augmented wave (PAW) [37] method. On the basis of our tests, we have determined that a cutoff energy of 400 eV and a dense Monkhorst-Pack mesh [38] (24×24×24 k mesh for the primitive cell to sample the Brillouin zone), are adequate for a good convergence. The equilibrium the-oretical lattice structure are determined by minimising the Hellmann-Feynman force on the atoms and stress on the unit cell. The convergence of force are set to 1.0×10⁻³ eV/˚A, respectively. Ground states properties of fcc-Al, H2 and Al-H system are thus
found in excellent agreement with the literature [31].
We calculate the GSF energy along the [112] direction on the closed-packed (111) surface along which the glide is the easiest in fcc metals. To simulate the block shearing process we use a slab consisting of 8 atomic layers in the [111] direction. A large vacuum space of 8 atomic layers parallel to (111) plane are added between the periodically repeated slabs to avoid the interactions between two successive slabs. The top 4 atomic layers of the system are then sheared against the remaining 4 layers on the (111) plane in [112] direction. For the case of pour Al, each layer of the simulation box contains only one atom. The slide process is rigid. Tests with 12 atomic layers are performed to examine the vacuum effect, and the results of the GSF energy shows no obvious difference.
The effect of H on the GSF energy is investigated by inserting H atoms at high symmetry sites on the glide plane. As in the Rice model the shearing process is rigid, the full atom relaxations is thus not allowed. However, the EAM potential calcula-tions show that the hydrogen introduction at the crack tip have important effect on the relaxation of its neighbour atoms within a certain range. In addition, DFT
calcu-lations [31] show that, in Al, the relaxation invert the stability of the octahedral and tetrahedral sites. Hence, a local relaxation is requested for the hydrogen neighbour atoms within the same range (i.e. the first nearest neighbours) in the GSF energy calculations, the others are kept rigid. Therefore, a much larger simulation box (16 atoms per layer) is used when H atoms are included. To account for the effect of mode I and H on the crack tip behaviours, a displacement ∆uz lower than 0.08 a0 is imposed
perpendicular to the shearing plane.
Similar calculations of GSF are also performed with same relaxation criteria but with a much larger box (30 atomic layers and 192 atoms per layer) with the EAM potential. The results are compared to those obtained by.
3. Crack Simulations: Results and Analysis
In this section, dedicated to crack simulations, we start with the pure metal case. The outputs are the measures of kIIe and the crack opening profile. We recall that the
”opening” is ∆uz(y) = (u+z − u−z)(y), where u+z (resp. u−z) is the displacement is the z
direction of the atoms of the upper (resp. lower) plane, in first neighbour of the glide plane. Then, the influence of a full line of H on dislocation emission is studied, as a function of the position of the line. The results (the numerical values of kIIe(kI)) are
qualitatively analysed by inspecting the H induced displacement field in the vicinity of the crack tip. This profile exhibits a number of features during dislocation emission. The essential information is the value of ∆uzat the corner of the crack, i.e. on the first
pair of atoms sheared by the dislocation formation process. It is this value that will be used for the calculation of the GSF in section 4. The justification of the interest of ∆uz at this particular location appears when the match between the γus values,
transformed into kIIe values by the Rice model, and the brute force QMD results
detailed in this section is established. This is postponed until section 4.
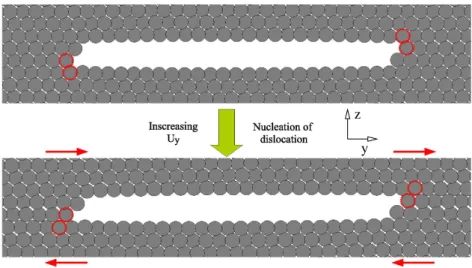
3.1. Mixed mode effect on kI I e: the pure metal case
y z
Figure 2. Crack configurations before and after the dislocation emission on the crack plane. The plastic shear is highlighted by the atom pairs in dotted lines.
The case of the pure metal is first studied. The critical load kIe in pure mode I
for the studied configuration of the crack tip is measured, in the case where the dis-location emits at an angle of approximately 70◦ from the crack plane. kIe is about
0.253 M P a√m. For mixed mode loads, three values of kI are adopted from the very
small one to the one close to 2/3kIe: 0.045, 0.099 and 0.187 M P a√m, so that
dislo-cation emission occurs in the crack plane. For each fixed kI, a set of simulations is
run with increasing mode II loads until a Shockley partial dislocation is emitted from both crack tips (see Fig. 2). The atom displacement profiles at the crack tip (∆uy and
∆uz) during such an event, are presented in Fig 3. ∆uy(y) = ∆uy+(y) − ∆uy−(y)
is the profile of the difference in displacement in the y direction between the atomic planes above and below the crack plane. The ∆uy profiles, just before the nucleation
of dislocation, is presented in Fig. 3(a). It exhibits a singularity due to the presence of the crack. Similar ∆uy(y) are obtained for different mode I loads. In the case of
kI = 0.045 M P a√m, the time evolution of the ∆uy profile is given (Fig. 3(b)), as a
function of the QMD step, at kIIe. The sequence shows the gradual formation of the
Shockley partial and its movement away from the tip. The Shockley partial is fully formed at relaxation step 120 where a step is formed at the tip corresponding to a magnitude of shear of 0.4 a0 (equals to the norm of the Burgers vector 1/6[112]). It
propagates continuously at the right of the crack tip for step numbers larger than 120. Before the nucleation of the partial, the corresponding profile of ∆uz (labeled k−IIe
on Fig. 3(c)) is a monotonic decreasing function of y, with a maximum value of 0.012 a0 at the crack tip. The crack tip is the ”corner“ of the crack, as shown by the
underlined particles on Fig. 2. It is this value which is used for the γus calculation.
Figure 3(d) gathers all the relevant values of ∆uz. Furthermore, when the partial
dislocation forms and propagates, ∆uz increases enormously. Especially, when atoms
shear (∆uy on Fig. 3(b)) at about 0.31 or 0.37 a0, the corresponding ∆uz exhibits a
maximum. It indicates that the unstable stacking fault may be located in between the shears of 0.31 and 0.37 a0. This demonstrates that in addition to the tensile mode,
the shear mode also contributes to the opening of the crack tip when the incipient dislocation is already present. The opening displacements ∆uz(k−IIe) under critical
loads just before the nucleation of the partial (i.e. ∆uz at the corner of the crack)
are given in Fig. 3(d) in pure mode I and in mixed mode loading. For both cases, the opening of the crack tip is increased by the superimposed mode I. Besides, ∆uz
for mixed mode loads is nearly shifted by a constant amount relative to the values obtained in pure mode I.
The critical mode II stress intensity factor kIIe for each kI are given in Tab. 1.
Clearly, mode I decreases kIIe as the mode I increases the interplanar spacing (see
Fig. 3(d)) and thus weakens the atomic bond in between atoms on the two sides of the crack plane, consequently making the shear easier. The quantification of this effect is linked to the gamma surface, and will be presented in Sec. 4.
3.2. H effect on the crack tip behaviour
H occupies the tetrahedral interstitial site in fcc Al [31], and the hydrostatic stress around the crack tip in mode I involves a H segregation around the tip. To investigate the maximum effect of H on the crack tip behaviour, we insert a full H line along the crack front on tetrahedral sites around the right crack tip, more specifically where slip localisation occurs, and carry QMD simulations at increasing loads until dislocation emission is observed. Two different crack tips in the system allows for a direct detection
0 0.1 0.2 0.3 0.4 0.5 0.6 0.7 80 82 84 86 88 90 92 94 ∆ uy (a 0 ) y (a0) kIIe -110 120 130 140 150 160 170 0 0.01 0.02 0.03 0.04 0.05 80 82 84 86 88 90 92 94 ∆ uz (a 0 ) y (a0) kIIe -110 120 130 140 150 160 170 0 0.04 0.08 0.12 0.16 0.2 75 80 85 90 95 100 ∆ uy (a 0 ) y (a0) kI = 0.045 kI = 0.099 kI = 0.187 -0.01 0 0.01 0.02 0.03 0.04 0.05 0.06 0.07 0.08 0.045 0.099 0.187 ∆ uz (a 0 ) kI (MPa√m) ∆uz(kI) ∆uz(kI + kIIepure) ∆uz(kI + kIIeH + H) (a) (d) (c) (b)
Figure 3. (a) Horizontal displacement ∆uyas a function of the y position for crack tips under critical load
just before dislocation emission. (b) Horizontal and (c) vertical displacement (∆uy, ∆uz) as a function of the
y position during the nucleation of Shockley partial dislocations, for the case of kI= 0.045 M P a√min mixed
modes. (d) Increase of the crack tip opening for crack tips under critical loads of pure mode I, mixed modes, and mixed modes with H (full line in position 3).
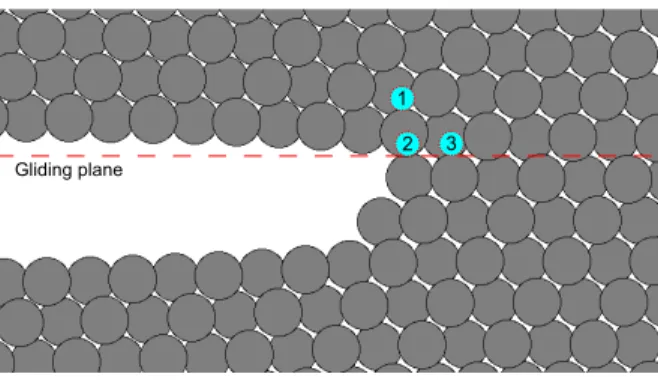
Figure 4. Schematic of the crack tip at the right side, with marked tetrahedral positions (blue balls) for the insertion of H.
Table 1. Results of the crack simulations, using the EAM potential in [30], under mixed mode I and mode II load. k units are in M P a√m.
Impurity site kIIe H effect
Pure Al 0.123 Site 1 0.115 -6.8% kI= 0.045 Site 2 0.102 -17.0% Site 3 0.127 +3.3% Pure Al 0.115 Site 1 0.104 -9.9% kI= 0.099 Site 2 0.102 -11.0% Site 3 0.119 +3.5% Pure Al 0.107 Site 1 0.096 -10.0% kI= 0.187 Site 2 ∗ ∗ Site 3 0.116 +8.4%
∗The dislocation is emitted on another plane.
of an enhancement or blocking of dislocation emission. However, if H impedes emission and emission occurs on the other crack tip, another H line is inserted on the symmetric site of the left crack tip. Then the load is increased further until kIIeis reached. Three
interstitial sites showed in Fig. 4 are examined. The corresponding kIIe are measured
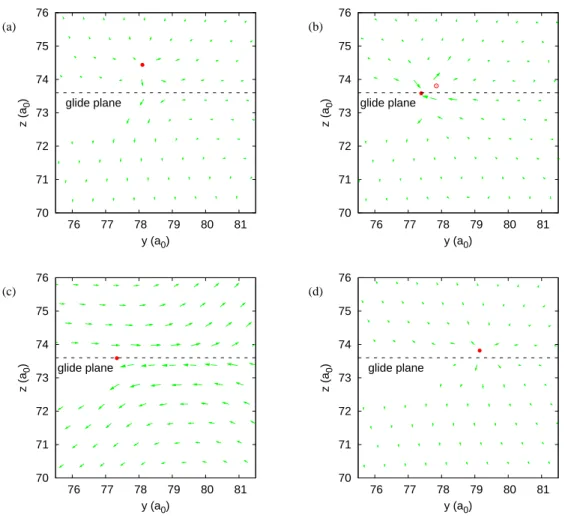
and presented in Tab. 1. The H induced atomic displacement field around the crack tip are also presented in Fig. 5. The displacement map is built from two separate simulations: one with H and another one without H, both with the same applied mechanical load.
First we consider H on position 1 (Fig. 4). It leads to a weak decrease of kIIe. The
increasing mode I load enhances this effect (Tab. 1). This crack tip shielding can be partly attributed to the elastic effect induced by H [39]. From the displacement field (Fig. 5(a)) we can see that H on position 1 involves a dilatation, which helps the relative displacements between atoms above and below the crack plane on the right hand of H. These displacements enhance the shear discontinuity in between the three rows of atoms below and above the glide plane.
H on position 2 induces a more significant reduction in kIIe (Tab. 1). Mode I
de-creases this effect. Position 2 becomes unstable upon shearing (within the limitations of the EAM potential). The displacement field relevant to the very beginning of atom relaxation is shown in Fig. 5(b). The empty red circle represents the initial position 2 and the filled circle represents the relaxed position: H relaxes from position 2 towards a surface site. Furthermore, H attracts the 2 Al atoms at the corner of the tip. The right top atoms seem to be repelled by H, while those at the right bottom are attracted. The crack tip is therefore already sheared by the presence of H. The displacement field after full relaxation is presented in Fig. 5(c). Obviously the dislocation was emitted. It propagated until it reached an equilibrium with the stacking fault force.
H on position 3 slightly increases kIIe, and mode I load amplifies this effect (Tab. 1).
From the corresponding displacement field (Fig. 5(d)) it is hard to know how H impacts the shear process : it stretches the Al-Al bonds in first neighbour position, induces a shear at the crack tip and furthermore one can also expect a higher resistance to shear because of the compression of the Al-H bond. Indeed the final analysis, from the GSF, at the end of section 4.2 will show that the apparent increase of kIIe is, in fact, the
result of a compensation in between all these effects. However, it is noted that H in this position strongly repels its first shell of neighbours, which should be considered in the simulation of the shear process in γuscalculations. Figure 6(a) presents ∆uy profile
70 71 72 73 74 75 76 76 77 78 79 80 81 z (a 0 ) y (a0) glide plane 70 71 72 73 74 75 76 76 77 78 79 80 81 z (a 0 ) y (a0) glide plane 70 71 72 73 74 75 76 76 77 78 79 80 81 z (a 0 ) y (a0) glide plane 70 71 72 73 74 75 76 76 77 78 79 80 81 z (a 0 ) y (a0) glide plane (a) (c) (b) (d)
Figure 5. (a) Projected atomic displacement field on the (110) plane, induced by the presence of the H line on position 1. The starting point of the vectors are the relaxed positions without H, while the end of the vectors is the relaxed positions in the presence of H. The vector length is enlarged by a factor of 5. The red filled circle is the relaxed H position. The crack tip is under mixed loads where kI = 0.099 M P a√m. (b)
Projected atomic displacement field relevant to the very beginning of the relaxation when H occupies position 2 (red empty circle). (c) Projected atomic displacement after full relaxation when H occupies position 2. (d) Projected atomic displacement field when H occupies position 3.
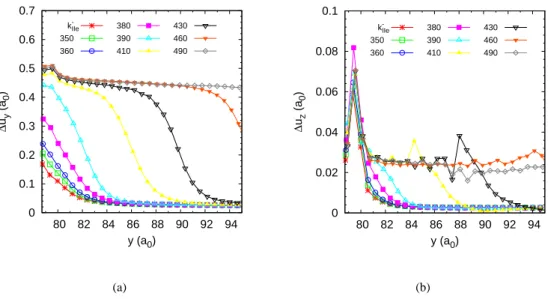
0 0.1 0.2 0.3 0.4 0.5 0.6 0.7 80 82 84 86 88 90 92 94 ∆ uy (a 0 ) y (a0) kIIe -350 360 380 390 410 430 460 490 0 0.02 0.04 0.06 0.08 0.1 80 82 84 86 88 90 92 94 ∆ uz (a 0 ) y (a0) kIIe -350 360 380 390 410 430 460 490 (a) (b)
Figure 6. (a) Horizontal and (b) vertical displacement as a function of the y position during the nucleation of Shockley partial dislocations. The profiles labeled k−
IIe correspond to a mechanical load just below the one
for dislocation emission.
in this case (H on position 3) during dislocation emission. After the full formation of the partial dislocation (from relaxation step 390), a small hump appears on the ∆uy
curve at y=79.5 a0, where H is located. It means that H enhances shear localisation
after the full formation of the partial. The ∆uz profile in Fig. 6(b) shows that H very
significantly increases ∆uz around it and helps open the crack tip. The H induced
increase of crack tip opening ∆uz is compared to that of pure metal case in Fig. 3(d).
H enlarges the crack tip opening by 0.015 to 0.02 a0, and this shift is almost constant
with kI.
4. H effect on the generalised stacking fault energy
In a previous paper [40], we have shown precisely how the interstitial sites in the glide plane are deformed during the shear process and the consequences on the stability of H. Both EAM and DFT calculations show that the tetrahedral sites of the glide plane are continuously transformed in the octahedral site of the intrinsic stacking fault (OISF). In DFT, OISF is the most stable site of the stacking fault, while in EAM,
the tetrahedral site is always preferred. However, no site change was found in EAM during the shearing process when the hydrogen is initially in sub-surface position 3.
4.1. Details about the relaxations
In the following, we review the various methods used in the literature for relaxing the H environment during the GSF calculation. Since our work does not show the same trend as the ones reported before, we have reproduced some of the results of the literature. It demonstrates the impact of relaxations. We start first by the case of pure Al and precisely quantify the effect of the opening perpendicular to the glide plane. Then we detail the results obtained with the EAM calculations and precisely establish the link between the method used for the GSF calculation (opening and H
concentration) and the data collected at the crack tip from QMD simulations. Finally the method is used in DFT and the conclusions concerning the effect of sub-surface H on dislocation emission are exposed.
We have used three different ways to calculate the energy landscape associated with glide. First, in the pure metal case, the atoms are not relaxed. The GSF is simply obtained by a rigid blocks shearing. The opening ∆uz is applied by translating one
block with respect to the other in the z direction. The second method is the one used by Gang Lu [41] where: the H environment is first fully relaxed (at zero shear), the two blocks are rigidly sheared, ∆uz is applied and only the atoms in the first planes
above and below the glide plane are relaxed, in the z direction only. It means that the transversal relaxations around the H atom, inherited from the initial relaxation, are held fixed during the calculation of the whole GSF. This method is referred to as ZR for “relaxations in z direction” in the next sections. In the third method, only the neighbours of H within a radius of 0.74 a0 are relaxed (it is enough to recover most of
the effect on the relative stability of the T and O site), ∆uz is applied and the first
neighbours and the H atoms are relaxed at every step. If H occupies the T+ site, the number of relaxed atoms is 4 and it goes up to 8 during the shear. This method is called LR for “local relaxations”.
4.2. Results obtained with the EAM potential
40 60 80 100 120 140 160 180 200 0 0.012 0.026 0.040 0.052 0.071 γus (mJ/m 2 ) ∆uz (a0) Pure Al DFT EAM
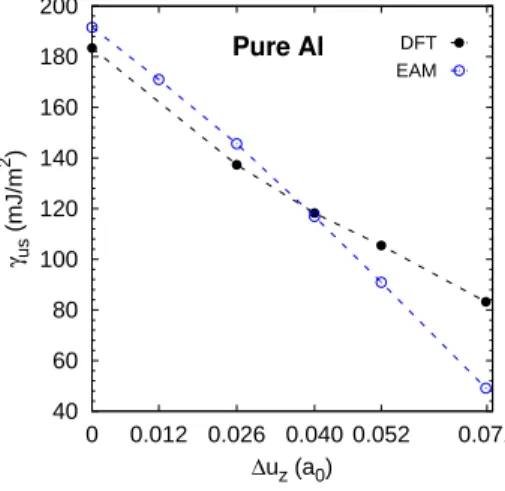
Figure 7. EAM and DFT computed unstable stacking fault energy as a function of ∆uzin the pure Al.
The unstable stacking energy (γus), in the pure metal, decreases strongly with ∆uz
(Fig. 7). It is cut down by almost 50% for a value of ∆uz of the order of 0.05 a0 which
is representative of the crack tip loaded at a moderate mode I: it can be checked on Fig. 3(d) that this level of opening corresponds to a mixed mode loading with kI of
0.187 MPa√m. The agreement between DFT and EAM is good (Fig. 7). Figure 8 shows the rigid GSF for three values of ∆uz. We can note that the maximum energy
(γus) is not obtained at 0.5 b, but in between 0.6 b and 0.7 b. This confirms that,
when H is introduced in the calculation, it will make the transition towards the sites of the hcp structure, before γusis reached, as discussed above. The agreement between
Rice’s model and the kIIe measured at the crack tip, for pure Al, is good. It can be
0 20 40 60 80 100 120 140 160 180 200 0 0.2 0.4 0.6 0.8 1.0 1.2 γus (mJ/m 2 ) Glide along <112> (b) DFT Pure Al uz = 0 a0 uz = 0.026 a0 uz = 0.052 a0
Figure 8. Generalised stacking fault energies as function of a shear along the h112i direction are computed in pure Al for different values of ∆uz.
obtained by brute force QMD, with the column “Rice (EAM)”, which contains the kIIe values calculated from γus using Eq. 1, with the opening from Fig.3(d) (curve
∆uz(kI + kpureIIe )). This agreement is well in line with what is published in [26], but
with a different crack tip (the crack was built by removing a single layer of Al). It also confirms that the location where ∆uz is measured, i.e. at the crack corner in between
the pair of atoms that are the first to be sheared, is appropriate and that the model captures the effect mode I loading.
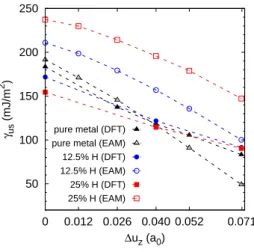
50 100 150 200 250 0 0.012 0.026 0.040 0.052 0.071 γus (mJ/m 2 ) ∆uz (a0) pure metal (DFT) pure metal (EAM) 12.5% H (DFT) 12.5% H (EAM) 25% H (DFT) 25% H (EAM)
Figure 9. Variation of γusas a function ∆uz(the opening) for different levels of H coverage, in EAM and in
DFT.
The next issue is how much hydrogen should be introduced in the GSF calculation in order to mimic what occurs at the crack tip. A natural choice would be 100%, since a full line is introduced. However, site 3 is not at the tip, but at the level of the second row of atoms along the glide plane (Fig. 4). Furthermore, we know that it has a strong impact on the relaxation of its first neighbours. Therefore, we can expect that the H line has on influence on the rising slip distribution over a wide range. In developing Eq. 1, Rice (equation 11 in [24]) uses the J integral for a contour along the glide plane,
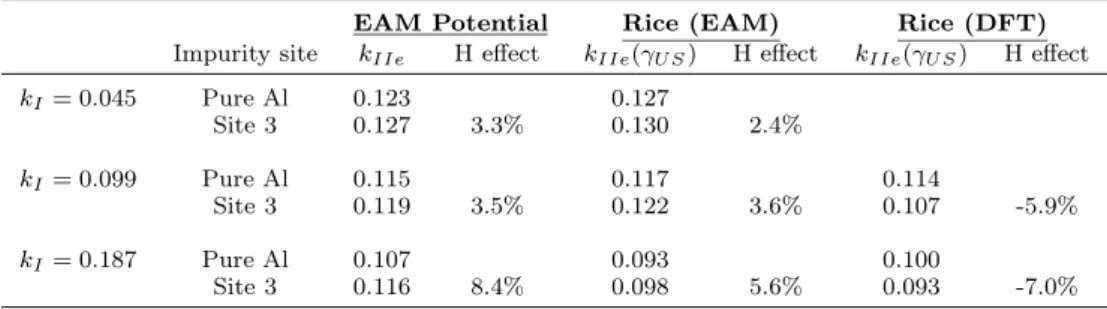
Table 2. kIIe values (in M P a√m) obtained by brute force QMD simulations using the EAM
potential (column ”EAM potential“) and one line of H on site 3, tabulated using the Rice formula Eq. 1 from γuscalculated by EAM (column ”Rice (EAM)“) or by DFT (column ”Rice (DFT)“) with
a surface coverage of 12.5% H (see text).
EAM Potential Rice (EAM) Rice (DFT) Impurity site kIIe H effect kIIe(γU S) H effect kIIe(γU S) H effect
kI= 0.045 Pure Al 0.123 0.127 Site 3 0.127 3.3% 0.130 2.4% kI= 0.099 Pure Al 0.115 0.117 0.114 Site 3 0.119 3.5% 0.122 3.6% 0.107 -5.9% kI= 0.187 Pure Al 0.107 0.093 0.100 Site 3 0.116 8.4% 0.098 5.6% 0.093 -7.0% which gives: J = − Z ∞ 0 τ ∂δ/∂x1dx1 (3)
where τ is the shear stress along the glide plane. It is a function of x1, the distance
along the glide plane. Since he considers only static mechanical equilibrium, this shear stress is also related to the slip discontinuity profile, via the non linear stress / slip discontinuity relation, which is the gamma surface. Noting that τ (x1) is, in the case
where the slip plane has uniform physical properties, τ (δ(x1)), Eq. 3 can be rewritten:
J = − Z ∞ 0 τ ∂δ/∂x1dx1 = Z δtip 0 τ dδ = Φ(δtip) (4)
where δtip is the displacement discontinuity at the crack tip (x1 = 0). When the
mechanical load on the crack tip reaches kIIe, Φ(δtip) is γus. The step from Eq. 3 to
Eq. 4 relies on the uniform property of the glide plane over the region where the slip distribution rises. It is not the case in the presence of the line of H. We expect τ (δ) to vary depending on the distance to the line of hydrogen atoms. To turn around this difficulty, we consider that H uniformly affects the τ (δ) relation and we evaluate it by inserting a line of H in the simulation box used for the GSF calculation. Various H densities have been tested: 25% (one row of H for 4 rows of Al in the glide plane) and 12.5% (8 rows of Al). With the EAM potential, H increases considerably the unstable stacking energy, as seen on Fig. 9 by comparing the values for different H coverage and a single ∆uz value. Nevertheless, this effect is damped by the impact of H on ∆uz,
i.e., from figure 3(d) we know that the full line of H, introduced on site 3, increases the opening at the crack tip. This, in turn, decreases γus (Fig. 9) and the two effects
compensate. Again, the comparison of columns “EAM Potential” and “Rice (EAM)” in Tab. 2, show that a reasonable agreement can be found. This was obtained by taking a concentration of 12.5%H (25% gives a much too strong increase of kIIe in
comparison to the QMD results). This means that 1 line of H was introduced in the GSF calculation for every 8 Al rows. These 8 rows roughly correspond to the size of the core of the partial dislocation as seen on the slip distributions on Fig. 3(b), which is coherent.
In a recent paper [42], some crack simulations were done which show no effect of mode I in Cu and Ni. The data in Al (Fig. 12 of [42], before emission occurs in a different plane than at low mode I) is coherent with table 1, in the sense that
a moderate decrease is observed, of the order of 10%, even if the crack tip has a different shape than the one considered here. Concerning the absence of effect in Cu and Ni, their enthalpy calculations show indeed that the decrease in γenthalpyus due to
a transverse traction is lower in Cu and Ni than in Al, so maybe this is the reason why the effect does not show up in the simulations in Cu and Ni. Furthermore, in the simulations, the crack tip geometry is such that there is a change of the surface during dislocation emission (in contrast to an atomistically sharp crack of the same orientation) and this might also influence the value of kIIe with unknown effects from
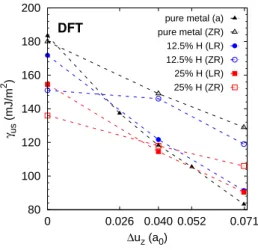
kI. 80 100 120 140 160 180 200 0 0.026 0.040 0.052 0.071 γus (mJ/m 2 ) ∆uz (a0)
DFT pure metal (ZR)pure metal (a) 12.5% H (LR) 12.5% H (ZR) 25% H (LR) 25% H (ZR)
Figure 10. Variation of γusas a function ∆uz(the opening) for different H coverage and different relaxation
methods in DFT. ZR refers to relaxations in z only of the Al toms of the two first layers around the glide plane. LR refers to a local relaxation where Al atoms within a sphere of 0.73 a0.
4.3. Results obtained from DFT
Finally, we use DFT to evaluate the effect of H on the GSF, with the ∆uz range taken
from the EAM simulations. Different relaxation methods give different trends. We have compared relaxations in the z direction, limited to the layers in first neighbour position of the glide plane, with local relaxations, labeled respectively ZR and LR in Fig. 10 (see section 4.1). The ZR method shows a clear trend: H always reduces γus,
whatever the value of ∆uz, and the effect increases with increasing H coverage. Here
the coverage is a little different from EAM because of system size constraints. The concentration 12.5% is obtained by putting half a line of H every 4 rows of Al. On the contrary, the LR method shows a reduction of γus, only when the opening in z is
zero. For higher values of ∆uz, but still in the range obtained by a mechanical effect
only (∆uz = 0.05 a0 at kI = 0.187 MPa√m and kII = kIIe), H has a negligible effect
on γus. This contradicts the messages (that are contradictory) found in the literature
where it can be found that H decreases γus [41] or prevents glide [43], depending on
concentration. Concentrations are much higher than those used in the present work. We can also mention that, as a check, we reproduced the results obtained by G. Lu exactly using the same LDA functional.
When the values obtained by the LR method are introduced in the Rice formula, a decrease of kIIe is found. This effect is essentially related to the mechanical loading of
the predictions from the EAM on the influence of H on ∆uz are taken into account,
an extra decrease of kIIe is obtained (table 2, last column). Knowing that the EAM
gives an increase in γus, which is opposite to the DFT results, this effect might not
be realistic. Indeed, by construction, this EAM treats the Al-H bond as a short range pair repulsion in the bulk (the non linear embedding functional is used to handle the segregation of H to open structures like vacancies or surfaces), following the appealing picture for H in metals given by the early Effective Medium Theory [30, 44]. Upon shearing, the H atom is pushed from the atomic environment of a tetrahedral site of the fcc structure (T) to an octahedral site of the hcp structure (O hcp) [40]. In the undistorted fcc, the EAM was fitted to give an energy for H in the O site 0.15 eV higher than in the T site (which is the case in DFT, but without ZPE). In DFT, the two positions have almost the same energy when the zero point energy correction is taken into account [31]. Adding the ZPE to the values used for fitting the potential does not have any physical meaning and therefore was not done. The effect of a rigid block shearing on the segregation energy of H (∆Eseg) to the glide plane was quantified
in [40] (Fig. 4a with ∆uz = 0 and Fig. 4b with ∆uz = 0.05 a0, curve T+ → O (hcp)).
An increase of the segregation energy, with glide, explains qualitatively why the EAM gives an increase in γus. Especially when ∆uz = 0.05 a0, the segregation is very low
(-0.25 eV) in the absence of glide. This comes from the fitting of the segregation energy to open structures (vacancies and surfaces), which is low. Then the distorsion of the T site with glide leads to a steep increase in ∆Eseg [40]. This shows that the effect of
H on γus is deeply rooted in the potential, i.e. not only in the simple repulsive pair
part, and therefore difficult to correct: having a weak effect of ∆uz on the segregation
energy and, at the same time, a strong decrease of ∆Eseg at surfaces seems opposite.
An interest of the present DFT calculations is also to be used as a benchmark to evaluate the limits of the EAM potential.
It is therefore likely, but not proved, that we overestimate the effect of H on γus if
we take into account the influence of H on ∆uz given by the EAM at the crack tip.
A conservative approach is to ignore it and consider only the effect of the mechanical load on ∆uz. Then the essential results from DFT are:
• The first order effect on kIIecomes from the mode I loading, i.e. that an opening
mechanical load perpendicular to the glide plane can decrease γus by 40%, i.e.
decrease kIIe by 25%, for small values of kI ∼ 0.2MP a√m (∆uz ∼ 0.05 a0
implies a drop of γus from 180 to 105 mJ/m2).
• In comparison, H has a small effect, even for very large concentrations on the glide plane. For realistic concentrations, the effect is expected to be negligible, in Al.
5. Conclusion
In this paper, we have studied the impact of sub-surface H and of mixed mode loading on dislocation emission. Multiple methods were used combining EAM and DFT, crack simulations, GSF calculations and Rice’s model.
First, in the pure metal case, we found a strong effect of transverse mechanical load on kIIe measured directly by crack simulations, confirmed by γus calculations
by EAM and DFT. Up to 25% decrease in kIIe can be expected from Rice’s model
considering γus decreases from 180 to 105 mJ/m2 (from the DFT data in Fig. 7). The
crack plane. Second, the H effect was investigated. Using EAM, H slightly increases kIIe in comparison to kIIe in pure Al, both at the same kI. We have analysed this
result by calculating γus as a function of ∆uz (the crack opening) and H coverage.
∆uz are taken at the crack tip in the presence of H, at kIIe− . The H coverage for the
GSF calculations, was fixed to 12.5% (1 H line for 8 Al row, in the glide plane) based on a comparison between the crack simulations and the results obtained with Rice’s model. The same methodology was used to calculate γus by DFT (i.e. local relaxations,
low H coverage and ∆uz from crack simulations). The trend, from the DFT data and
Rice’s model, is that an decrease of γus can be expected at low mode I, but the effect
becomes negligible beyond kI = 0.1 M P a√m. This leads to the conclusion that the
strong effect is mechanical (mode I) and sub-surface H influence is negligible.
Acknowledgments
This work was granted access to the HPC resources of CALMIP (CICT Toulouse, France) under the allocations 2014-p0912 and 2014-p0749. The authors acknowledge the support of the French Agence Nationale de la Recherche (ANR), under grant EcHyDNA(Blanc 10-19424).
References
[1] R.P. Gangloff, Hydrogen assisted cracking of high strength alloys, in Comprehensive struc-tural integrity, I. Milne, R.O. Ritchie, and B. Karihaloo, eds. Elsevier Science New York, NY, 2003, pp. 31–101.
[2] R.P. Gangloff, H-enhanced deformation and fracture in the crack tip process zone, in Materials performance in hydrogen environments (Proceedings of the 2016 International Conference on fracture), B.P. Sommerday and P. Sofronis, eds. ASME, 2017, pp. 1–35. [3] G.M. Scamans, R. Alani, and P.R. Swann, Pre-exposure embrittlement and stress
corro-sion failure in AlZnMg alloys, Corrocorro-sion Science 16 (1976), pp. 443–459.
[4] A. Van der Ven and G. Ceder, Impurity-induced van der waals transition during decohe-sion, Phys. Rev. B 67 (2003), p. 060101.
[5] D. Jiang and E.A. Carter, First principles assessment of ideal fracture energies of ma-terials with mobile impurities: implications for hydrogen embrittlement of metals, Acta Materialia 52 (2004), pp. 4801 – 4807.
[6] H. Birnbaum, I. Robertson, P. Sofronis, and D. Teter, Mechanisms of Hydrogen Related Fracture-A review, in Proceedings of CDI’96, Th. Magnin ed., The Institute of Materials. 1997, p. 172.
[7] I.M. Robertson, Hydrogen emrbittlement understood, Met. Trans. A 46A (2015), p. 2323. [8] I. Aubert, N. Saintier, J.M. Olive, and F. Plessier, A methodology to obtain data at the slip-band scale from atomic force microscopy observations and crystal plasticity simulations., acta mater. 104 (2016), pp. 9–17.
[9] Y. Deng and A. Barnoush, Hydrogen embrittlement revealed via novel in situ fracture experiments using notched micro-cantilever specimens, acta mater 142 (2018), pp. 236– 247.
[10] S.P. Lynch, Mechanisms and Kinetics of Environmentally Assisted Cracking: Current Sta-tus, Issues, and Suggestions for Further Work, Metallurgical and Materials Transactions A 44 (2013), pp. 1209–1229.
[11] Y. Fukai and N. Okuma, Formation of superabundant vacancies in Pd hydride under high hydrogen pressures, Phys. Rev. Lett. 73 (1994), p. 1640.
[12] M. Nagumo, Hydrogen related failure of steels a new aspect, Materials Science and Tech-nology 20 (2004), pp. 940–950.
[13] D.G. Xie, Z.J. Wang, J. Sun, J. Li, E. Ma, and Z.W. Shan, In situ study of the initiation of hydrogen bubbles at the aluminium metal/oxide interface, Nature Materials 14 (2015), p. 899.
[14] A. Tehranchi and W.A. Curtin, Atomistic study of hydrogen embrittlement of grain bound-aries in nickel: II. decohesion, Model. Sim. Mat. Sci. Eng. 25 (2017), p. 075013.
[15] B. Kuhr, D. Farkas, and I.M. Robertson, Atomistic studies of hydrogen effects on grain boundary structure and deformation response in fcc Ni, Comp. Mat. Sci. 122 (2016), pp. 92–101.
[16] D. Tanguy, Cohesive stress heterogeneities and the transition from intrinsic ductility to brittleness, Phys. Rev. B 96 (2017), p. 174115.
[17] T. Miura, K. Fujii, and K. Fukuya, Micro-mechanical investigation for effects of helium on grain boundary fracture of austenitic stainless steel, Journal of Nuclear Materials 457 (2015), pp. 279–290.
[18] S. Li, Y. Li, Y.C. Lo, T. Neeraj, R. Srinivasan, X. Ding, J. Sun, L. Qi, P. Gumbsch, and J. Li, The interaction of dislocations and hydrogen-vacancy complexes and its importance for deformation-induced proto nano-voids formation in α-Fe, International Journal of Plasticity 74 (2015), pp. 175–191.
[19] A. Tehranchi, X. Zhang, G. Lu, and W.A. Curtin, Hydrogenvacancydislocation interac-tions in α-Fe, Modelling Simul. Mater. Sci. Eng. 25 (2017), p. 025001.
[20] J. Song and W. Curtin, Mechanisms of hydrogen-enhanced localized plasticity: An atom-istic study using α-Fe as a model system, Acta Materialia 68 (2014), pp. 61 – 69. [21] Y. Sun, Q. Peng, and G. Lu, Quantum mechanical modeling of hydrogen assisted cracking
in aluminum, Phys. Rev. B 88 (2013), p. 104109.
[22] R.J. Zamora, A.K. Nair, R.G. Hennig, and D.H. Warner, Ab initio prediction of environ-mental embrittlement at a crack tip in aluminum, Phys. Rev. B 86 (2012), p. 060101(R). [23] D.H. Warner, W.A. Curtin, and S. Qu, Rate dependence of crack-tip processes predicts
twinning trends in f.c.c. metals, nat. mat. 6 (2007), p. 876.
[24] J.R. Rice, Dislocation nucleation from a crack tip: An analysis based on the peierls concept, Journal of the Mechanics and Physics of Solids 40 (1992), pp. 239–271.
[25] S.J. Zhou, A.E. Carlsson, and R. Thomson, Dislocation nucleation and crack stability: Lattice Green’s-function treatment of cracks in a model hexagonal lattice, Phys. Rev. B 47 (1993), pp. 7710–7719.
[26] K. Gouriet and D. Tanguy, Dislocation emission from a crack under mixed mode loading studied by molecular statics, Philosophical Magazine 92 (2012), pp. 1663–1679.
[27] D. Tanguy, M. Razafindrazaka, and D. Delafosse, Multiscale simulation of crack tip shield-ing by a dislocation, acta mater. 34 (2008), p. 2441.
[28] Y. Mishin, D. Farkas, M.J. Mehl, and D.A. Papaconstantopoulos, Interatomic potentials for monoatomic metals from experimental data and ab initio calculations, Phys. Rev. B 59 (1999), pp. 3393–3407.
[29] D. Tanguy and T. Magnin, Atomic-scale simulation of intergranular segregation of H in AlMg: implications for H-induced damage, Philosophical Magazine 83 (2003), pp. 3995– 4009.
[30] X. Shen, D. Tanguy, and D. Conn´etable, Atomistic modelling of hydrogen segregation to the Σ9{221}[110] symmetric tilt grain boundary in al, Philosophical Magazine 94 (2014), pp. 2247–2261.
[31] C. Wolverton, V. Ozolins, and M. Asta, Hydrogen in aluminum: First-principles calcula-tions of structure and thermodynamics, Phys. Rev. B 69 (2004), p. 144109.
[32] D. Conn´etable, Y. Wang, and D. Tanguy, Segregation of hydrogen to defects in nickel using first-principles calculations: The case of self-interstitials and cavities, Journal of Alloys and Compounds 614 (2014), pp. 211 – 220.
[33] G. Kresse and J. Hafner, Ab initio molecular dynamics for liquid metals, Phys. Rev. B 47 (1993), p. 558.
[34] G. Kresse and J. Hafner, Ab initio molecular-dynamics simulation of the liquid-metalamorphous-semiconductor transition in germanium, Phys. Rev. B 49 (1994), p. 14251.
[35] G. Kresse and J. Furthm¨uller, Efficient iterative schemes for ab initio total-energy calcu-lations using a plane-wave basis set, Phys. Rev. B 54 (1996), p. 11169.
[36] J.P. Perdew, K. Burke, and M. Ernzerhof, Generalized gradient approximation made sim-ple, Phys. Rev. Lett. 77 (1996), pp. 3865–3868.
[37] G. Kresse and D. Joubert, From ultrasoft pseudopotentials to the projector augmented-wave method, Phys. Rev. B 59 (1999), p. 1758.
[38] H. Monkhorst and J. Pack, Special points for brillouin-zone integrations, Phys. Rev. B 13 (1976), p. 5188.
[39] J. Weertman and J.E. Hack, Stress intensity factors for crack tip shielding or anti-shielding by impurity atoms, International Journal of Fracture 30 (1986), pp. 295–299. [40] Y. Wang, D. Conn´etable, and D. Tanguy, Site stability and pipe diffusion of hydrogen
under localised shear in aluminium, Phil. Mag. 99 (2019), pp. 1184–1205.
[41] G. Lu, D. Orlikowski, I. Park, O. Politano, and E. Kaxiras, Energetics of hydrogen impu-rities in aluminum and their effect on mechanical properties, Phys. Rev. B 65 (2002), p. 064102.
[42] P. Andric, B. Yin, and W.A. Curtin, Stress-dependence of generalized stacking fault en-ergies, JMPS 122 (2019), pp. 262–279.
[43] F. Apostol and Y. Mishin, Hydrogen effect on shearing and cleavage of Al: A first-principles study, Phys. Rev. B 84 (2011), p. 104103.
[44] J. Nørskov and F. Besenbacher, Theory of hydrogen interations with metals, J. Less-Common Metals 130 (1987), pp. 475–490.

![Table 1. Results of the crack simulations, using the EAM potential in [30], under mixed mode I and mode II load](https://thumb-eu.123doks.com/thumbv2/123doknet/14222127.483905/11.892.309.584.163.358/table-results-crack-simulations-using-eam-potential-mixed.webp)