Publisher’s version / Version de l'éditeur:
Questions? Contact the NRC Publications Archive team at
PublicationsArchive-ArchivesPublications@nrc-cnrc.gc.ca. If you wish to email the authors directly, please see the first page of the publication for their contact information.
https://publications-cnrc.canada.ca/fra/droits
L’accès à ce site Web et l’utilisation de son contenu sont assujettis aux conditions présentées dans le site
LISEZ CES CONDITIONS ATTENTIVEMENT AVANT D’UTILISER CE SITE WEB.
Research Report (National Research Council of Canada. Institute for Research in
Construction), 2003-02-01
READ THESE TERMS AND CONDITIONS CAREFULLY BEFORE USING THIS WEBSITE. https://nrc-publications.canada.ca/eng/copyright
NRC Publications Archive Record / Notice des Archives des publications du CNRC :
https://nrc-publications.canada.ca/eng/view/object/?id=a77069ab-cc34-4c51-906b-6e07170b692e https://publications-cnrc.canada.ca/fra/voir/objet/?id=a77069ab-cc34-4c51-906b-6e07170b692e
Archives des publications du CNRC
For the publisher’s version, please access the DOI link below./ Pour consulter la version de l’éditeur, utilisez le lien DOI ci-dessous.
https://doi.org/10.4224/20386351
Access and use of this website and the material on it are subject to the Terms and Conditions set forth at
Report from Task 6 of MEWS Project: Experimental Assessment of
Water Penetration and Entry into Wood-Frame Wall Specimens - Final
Report
Report from Task 6 of MEWS Project
Experimental Assessment of Water Penetration and Entry into
Wood-Frame Wall Specimens – Final Report
Lacasse, M.A.; O’Connor, T.J.; Nunes, S.;
Beaulieu, P.
IRC-RR-133
February 2003
The main emphasis of the MEWS project was to predict the hygrothermal responses of several wall assemblies that are exposed to North American climate loads, and a range of water leakage loads. Researchers used a method based on both laboratory experimentation and 2-D modeling with IRC’s benchmarked model, hygIRC. This method introduced built-in detailing deficiencies that allowed water leakage into the stud cavity - both in the laboratory test specimens and in the virtual (modeling) “specimens”- for the purpose of investigating water entry rates into the stud cavity and the drying potential of the wall assemblies under different climate loads. Since the project was a first step in investigating a range of wall hygrothermal responses in a parametric analysis, no field study of building characteristics was performed to confirm inputs such as water entry rates and outputs such as wall response in a given climate. Rather, ranges from ‘no water entry and no response’ to ‘too much water entry and too wet for too long’ were investigated.
Also, for the sake of convenience, the project used the generic cladding systems (e.g., stucco, masonry, EIFS, and wood and vinyl siding) for labeling and reporting the results on all wall assemblies examined in the study. However, when reading the MEWS publications, the reader must bear in mind that the reported results are more closely related to the nature of the deliberately introduced deficiencies (allowing wetting of the stud cavity) and the construction details of the wall systems investigated (allowing wetting/drying of the assembly) than to the generic cladding systems themselves. As a general rule, the reader must assume, unless told otherwise, that the nature of the deficiencies and the water entry rates into the stud cavity were different for each of the seventeen wall specimens tested as well as for each of the four types of wall assemblies investigated in the modeling study. For this reason, simply comparing the order of magnitude of results between different cladding systems would take the results out of context and likely lead to erroneous conclusions.
CONSORT I UM FOR MOI ST URE MANAGEMENT FOR EXT ERI OR WALL SYSTEMS M O I S T U R E C O N T R O L P E R F O R M A N C E O F W A L L S Y S T E M S & S U B S Y S T E M S
Chapter 1
T
ABLE OFC
ONTENTS — CHAPTER 1 —OVERVI EW OF EXPERI MENTAL WORK
LI ST OF FI GURES ... 1-ii LI ST OF FI GURES ...1-iii LI ST OF TABLES ...1-iv 1.1 I ntroduction... 1-1 i. Objectives... 1-1 ii. Approach... 1-1 Qualitative assessment... 1-1 Quantitative trials... 1-4 iii. Overview of report... 1-5 1.2 Description of Test Facility... 1-6 1.3 Description of Test specimens... 1-8 i. I ntroduction... 1-8 ii. Sensors... 1-8 Pressure taps... 1-8 Air barrier system leakage... 1-9 Moisture sensors in OSB... 1-9 Water entry points... 1-9 1.4 Description of Test protocol – summary... 1-12 i. Stage 1 - Air leakage and pressure equalisation characteristics... 1-14 Air leakage:... 1-14 Pressure equalisation potential... 1-15 ii. Stage 2 - Water penetration trials... 1-15 Water penetration under static conditions – no specified deficiences... 1-15 Water penetration under dynamic conditions – no specified deficiences... 1-16 iii. Stage 3 – Effect of continuous water spray... 1-16 iv. Stage 4 - Water entry assessments... 1-16 Water entry through specified deficiencies under static conditions... 1-17 Water entry through specified defeciencies under dynamic conditions... 1-17
CONSORT I UM FOR MOI ST URE MANAGEMENT FOR EXT ERI OR WALL SYSTEMS M O I S T U R E C O N T R O L P E R F O R M A N C E O F W A L L S Y S T E M S & S U B S Y S T E M S
L
IST OFF
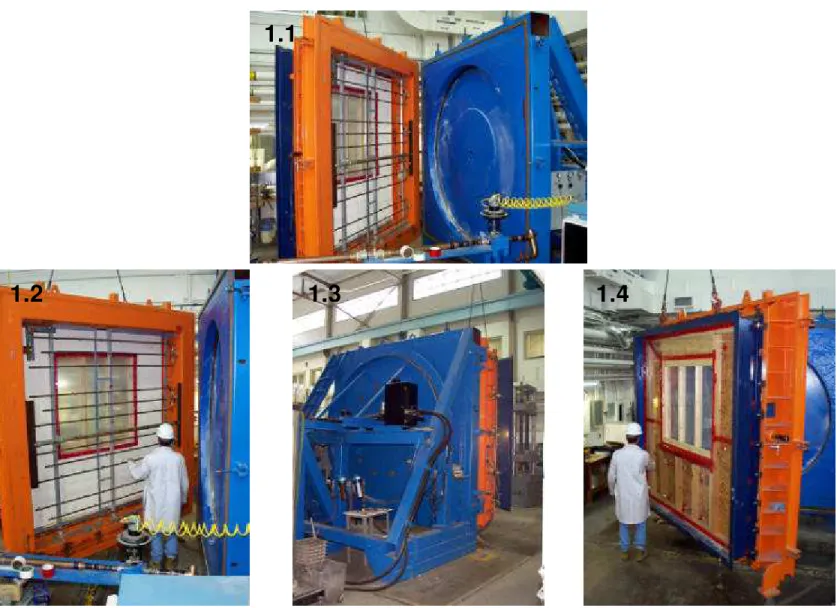
IGURESFigure 1.1 - Inside view of apparatus showing test specimen (sizes up to 2.44 by 2.44-m). The exterior
cladding faces the inside of the apparatus... 7
Figure 1.2 - Inside view of apparatus showing piston and water spray racks. ... 7
Figure 1.3 - Rear view of apparatus showing piston and hydraulic gear. ... 7
Figure 1.4 - Front view of apparatus - The wall specimen is installed integrally to the metal test frame (in blue). The specimen test frame is in turn mounted and sealed to the facility test frame (in orange). The facility test frame supports the water spray racks and is the operable door to the apparatus... 7
Figure 1.5 : View of ‘stud-cavity’ side of specimen WA-17 (Brick masonry veneer)... 10
Figure 1.6 : Location of pressure taps and air leakage openings ... 10
Figure 1.7: View of moisture sensors in stucco wall specimen (WA-2A)... 11
Figure 1.8: Location of moisture sensors in a stucco-clad specimen... 11
L
IST OFT
ABLESTable 1.1 – Static test pressures... 14
Table 1.2 – Dynamic pressure fluctuations ... 15
Table 1.3 – Static test pressures at nominal spray rate of 3.4 L/s-m2... 16
Table 1.4 – Dynamic pressure loads at nominal spray rate of 3.4 L/s-m2... 16
Table 1.5 – Static test conditions ... 17
1 . 1 I n t r o d u ct i o n
i . O b j e ct i v e s
The objective of this task was to measure the moisture control performance of wall systems and subsystems and to determine the quantity of water entry in relation to climate loads.
i i . Ap p r o a ch
The requirements, as set out for the MEWS project, for understanding and assessing the moisture management potential of different wall assembly types when subjected to North American climate loads necessitated developing a flexible approach that would permit obtaining on the one hand, qualitative information on watertighness performance and on the other,
quantitative information for the purposes of providing the simulation model data in a form useful for carrying out the parametric studies.
QU A L I T A T I V E A S S E S S M E N T
In terms of qualitative information, the intent was to subject the different types of walls to simulated wind-driven rain at loads and for time periods in keeping with current industrial standards. Typically in industrial performance tests, wind-driven rain is simulated by the
simultaneous application of water spray, per unit time and specimen surface area, and pressure difference across the specimen. Evidently the spray is intended to emulate the deposition of water on the facade due to rainfall whereas pressure difference mimics the action of wind. Standard performance assessment tests, such as the ASTM standard, require the wall
specimens be subjected to a specific spray rate and pressure differential for a given amount of time. The assessment is based on whether penetration was observed over the course of the specified test period under the designated test conditions. Given this situation, it was felt that additional information could be gained from applying test pressures in increasing steps of pressure differential at a given spray rate. It was surmised that a water penetration ‘event’, indicative of when penetration of the assembly was first observed and conditions under which it occurred, could be established over the course of the tests. This ‘staged’ approach thus
permitted assessing the pressure level at which penetration events occurred offering a rough estimate of the degree to which resistance to penetration might be achieved for a given wall specimen. Additionally, such type of tests could provide information on the most vulnerable parts of the assembly given that observation of an ‘event’ would also include where penetration
In addition to the above water penetration assessments, information was sought on the air tightness of the assemblies as well as pressure response, in both the static and dynamic mode, as this might offer indications of a propensity for water entry. Obtaining pressure differentials across as well as from various points within the assembly would provide a measure of the
potential for driving water across openings in the interstitial layers of the assembly. Characterising the air leakage of specimens was sought to provide a means of assessing whether the degree of air leakage could be readily related to a propensity for water penetration; e.g. is water penetration more or less likely to occur in walls that have a high degree of air leakage?
Given that at least in some specimens water penetration was likely to occur, information was also sought on the likelihood of moisture penetration to the wood-based and other moisture sensitive materials in the assembly, in particular oriented strand board (OSB). Electric sensors were used to indicate the presence of moisture and taking into consideration the limited number of sensors available, these were located in proximity to areas where water was likely to penetrate or migrate to. The activation of sensors over the test period provided a ready assessment of the degree of penetration to specific elements and hence the extent to which moisture might migrate in a given time under the specified conditions. In essence, it offered a qualitative measure of the resistance to entry of different assemblies based on the total number of sensors activated over the course of a test. As well, it helped identify the moisture sensitive locations of a specimen. In combining information obtained from moisture sensors and penetration ‘events’, a qualitative assessment of the watertighness of the specimen was completed.
It is to be noted that the specimens in this sequence of performance tests were prepared without any specified deficiencies in the cladding proper, although the specimens did include deficiencies in the second line of defence as described in MEWS Report T2-021. The basis for choosing the various deficiencies is provided in Appendix – A2 whereas MEWS Report T2-02, provides details on how the specimens were built and what deficiencies were introduced in the several layers of components making up the specimens. The generic deficiencies for a typical wall assembly, as provided in Appendix – A, in the first and second lines of defense, are given in Figures 1.1 and 1.2 respectively.
1
Bomberg et al. (2002), “Description of 17 large-scale wall specimens built for water entry investigation in IRC dynamic wall testing facility: Summary Report from MEWS Task 2”, MEWS Project Report T2-02, Institute for Research in Construction, May 2002, 134p.
2
Additional information concerning the configuration of the test specimens and details regarding deficiencies is provided in §1.2 of this chapter.
It is also worthwhile noting that given the specimens were fabricated in a laboratory setting, considerable care went into insuring that common elements among the different specimens were fabricated as specified.
QU A N T I T A T I V E T R I A L S
In regard to obtaining quantitative information for the purposes of providing the simulation model useful input for parametric studies, this portion of the test sequence was carried out on specimens that included specified cladding deficiencies. Cladding deficiencies represented openings of known type, size and location that were incorporated in the cladding such that water passing over these deficiencies might enter within the wall assembly proper. These, as
mentioned previously, are provided in Appendix – A.
The simulation program required information on hourly rates of water entry at a given location in the wall assembly for specified climatic conditions. In essence, a relation was needed that linked climate variables, such as wind speed and rainfall rate, to water entry. Hence the test sequence required some measure of water entry rates at specified locations under simulated wind-driven rain conditions. This was achieved by the collection of water in troughs at specified locations over a known period when the specimen was subjected to a series of simulated wind-driven rain conditions. The simulated wind-driven rain conditions were implemented by applying increasing levels of pressure difference across the specimen at given water spray rates. Using this approach, rates of entry at specified locations in the specimen were obtained for each combination of pressure differential and spray rate. This provided a basis for generalising water entry for specific types of wall assemblies in relation to climate variables such as wind speed and rainfall intensity. Each generic type of specimen (i.e. Base-case, stucco, EIFS, brick masonry, siding) had water entry functions developed that were used as a basis for admitting water into the wall assembly for use in the simulation program.
This experimental program was hence comprised of two test sequences: water penetration performance assessments and water entry trials. These formed the basis for the results provided in the subsequent chapters of this report.
i i i . Ov e r v i e w o f r e p o r t
The following provides an overview of the work reported in the accompanying chapters.
• Chapter 1 - Introductory chapter providing the objectives, approach and description of test facility, test protocol and test parameters used in the experimental work.
• Chapter 2 - Results from water entry experiments carried out on the acrylic sheathing wall assembly (base-case) and subsequently used in the development of water entry functions for the wall assemblies.
• Chapter 3 - Summary report on results from water penetration trials and entry assessments on stucco wall assemblies. Selected air leakage, static and dynamic pressure response characteristics of the stucco wall assemblies are provided in Appendix - B.
• Chapter 4 – Summary report on results from EIFS wall assemblies; selected air leakage and pressure response information provided in the Appendix B.
• Chapter 5 – Summary report on brick masonry clad wall assemblies; additional information on air leakage and pressure response given in the Appendix B
• Chapter 6 – Summary report on siding wall assemblies; selected information on air leakage and pressure response provided in the Appendix B
• Chapter 7 – Overview of results from the 17 wall assemblies, including a review of water penetration, water entry and the derivation of water entry functions. Details of
experiments carried out on the deposition of water in the stud cavity are provided in Appendix B.
• Appendix – A: provides information on the basis for the selection of deficiencies in the cladding and within the wall assembly.
• Appendix – B: offering selected air leakage, static and dynamic pressure response information.
Each of the Summary reports on water penetration trials and water entry assessments are essentially self-contained and include an overview of the type of wall construction and the key components of the wall assembly as well as a summary of the test protocol described in this chapter. As well, the overview chapter (Chapter 7) provides additional information regarding the comportment of the different wall assemblies in relation to one another not provided in the other chapters.
1 . 2 D e scr i p t i o n o f T e st Fa ci l i t y
The facility used to conduct the tests was the Dynamic Wind and Wall test Facility (DWTF). This facility, shown in Figure 1.3 to 1.4, is capable of subjecting full-scale test specimens (nominal size 2.44 by 2.44-m) to static or dynamic pressure fluctuations of over 2 KPa and spray rates of up to 8 L/min.-m2 (Figure 1.3 and Figure 1.6). Dynamic pressure fluctuations are obtained by the displacement of a sealed 2.4-m diameter piston, which forms part of the back of the apparatus (Figure 1.5). The displacement of the piston (up to 75 mm) causes the volume of the space between it and the test specimen assembly to increase or decrease, thus varying the air pressure difference across the specimen. The movement of the piston can be programmed to produce sinusoidal, triangular or square waveforms of air pressure at frequencies ranging from 0.1 to 10Hz and amplitudes up to or exceeding 2KPa. A secondary blower generates the steady-state (static) component of air pressure. This blower provided the means to assess the air leakage characteristics of the specimens.
The apparatus also contains a pressure regulated water spray system (Figure 1.4) that simulates the action of rain deposition on the cladding surface. Different water deposition rates (hereafter referred to as spray rates) are achieved by regulating the pressure level along specific arrays of spray nozzles.
Figure 1.3 - Inside view of apparatus showing test specimen (sizes up to 2.44 by 2.44-m). The exterior cladding faces the inside of the apparatus. Figure 1.4 - Inside view of apparatus showing piston and water spray racks.
Figure 1.5 - Rear view of apparatus showing piston and hydraulic gear.
1.1
1.3
1.4
1 . 3 D e scr i p t i o n o f T e st sp e ci m e n s
i . I n t r o d u ct i o n
The basis for development of the final configuration of the test specimens is provided in Appendix – A3. The approach and most of the deficiencies proposed in Appendix – A have been adopted for implementation in the experimental work described in this Chapter. During the course of the project, TG 6 and TG 2 further revised the selection of the deficiencies in
consultation with the industry partners representing each of the four generic cladding system (e.g. Masonry Canada and Canada Brick for the four masonry specimens) in the months that preceded the construction and testing of those specimens. Given these activities some of the deficiencies proposed by the working group were not implemented for the following reasons:
• Some deficiencies would have been difficult to reproduce in a consistent manner from specimen to specimen (e.g. poor bond between masonry units, or blocked drainage holes);
• The number of test parameters was limited in any given specimen so that the analysis and interpretation of the experimental results would meet the objectives.
Finally, report TG2-02 entitled "Description of 17 large-scale wall specimens built for water entry investigation in IRC Dynamic Wall Testing facility" provides details on how the specimens were built and what deficiencies were introduced in the several layers of components making up the specimens.
The final test configuration showing the location of pressure taps, moisture sensors and water entry points are provided in Figures 1 to 3 respectively.
i i . Se n so r s
A photograph depicting the specimen is provided in Figure 1.7 and shows the stud cavity side of the specimen in which the various pressure and moisture sensors are identified. PRESSURE TAPS
Pressure taps are located in six wall portions (Figure 1.8), with the first portion located at the left extremity of the wall (facing the weather-side). Typically in each portion, taps are located both in the wall cavity between the cladding and the sheathing board and in the stud space.
3
Additionally, taps have been added to obtain measurements of pressure differential at points of water entry.
AI R B A R R I E R S Y S T E M L E A K A G E
Air barrier system (ABS) leakage was regulated by introducing a series of ca. 6-mm
diameter holes in the ABS (Figure 1.8), a series of seven (one in each stud cavity) representing an equivalent leakage area (ELA) of 169-mm2, provided a nominal ABS leakage of
0.2 L/s-m2. An ABS leakage of 0.5 L/s-m2 (ELA 508-mm2) was achieved using twenty-one holes of the same diameter, three in each stud cavity. The desired nominal leakage through the ABS was achieved by “opening” or “closing” the appropriate number of holes in the ABS.
MO I S T U R E S E N S O R S I N OSB
Photographs of typical moisture sensors are provided in Figure 1.9 and their location in the wall specimen is shown in Figure 1.10. Sixteen (16) moisture pin pairs (imbedded to either ¼ or ¾ sheathing thickness; e.g. see schematic) were placed in the OSB sheathing at locations where either water might first accumulate or at the base of the wall.
Moisture pin pairs imbedded at ¾ thickness provided moisture contents in proximity to the front of the sheathing; those at ¼ thickness (#4 & #12) were intended to offer information of the moisture profile across the sheathing. The sensors had been previously calibrated such that a light diode, located between the pairs of pins, activated if the moisture content reached or exceeded ca. 14%. The calibration curve used for relating electrical resistance to moisture content of the sheathing board is provided in Appendix B, §4. Over a test period, note was taken of the time and conditions under which the light was first activated
WA T E R E N T R Y P O I N T S
The location of specified water entry points, provided in Figure 1.11, were deemed representative of typical deficiencies located at the interface between the cladding and penetrations, and include the following entry points:
• Above the electrical outlet – a 50-mm length of sealant is missing between the outlet cover and the wall (approximate size: 1-mm by 50-mm)
• Above the duct – a 50-mm length of sealant is missing between the duct and the wall (approximate size: 1-mm by 50-mm)
• Below the windowsill and between finishing strips – a 90-mm length of sealant is missing between the ending strips (approximate size: 10-mm by 90-mm).
Figure 1.7 : View of ‘stud-cavity’ side of specimen WA-17 (Brick masonry veneer)
Figure 1.8 : Location of pressure taps and air leakage openings
2.44-m
200-mm
356-mm
3 - 6-mm diameter holes to regulate air leakage through air barrier
Pressure taps behind cladding - (?) Located in stud cavity - (?)
2.22-m
406-mm
2.44-m 1 10 2 3 4 5 6 7 8 9 12 11 14 13 15 16 ¾ d OSB Stucco cladding Membrane Moisture pin d
1.7
1.7
1.8
1 . 4 D e scr i p t i o n o f T e st p r o t o co l – su m m a r y
The protocol was established to determine the air leakage, pressure equalisation response and water penetration and entry characteristics of different wall assemblies when subjected to simulated driving rain using the DWTF. The approach adopted for the protocol consisted of conducting the tests in a series of stages, each of which is described below.
1. Characterisation of air leakage and pressure equalisation potential of the wall assembly. 2. Water penetration trials in both static and dynamic mode at a nominal spray rate of
3.4 L/s-m2 (no planned deficiencies incorporated in cladding)
3. Subjecting specimen to 16 hours continuous water spray of 0.4 L/s-m2 at a nominal pressure difference of 20 Pa to simulate effects of exposure to a long-term rain event.
4. Characterisation of water entry through specified deficiencies in the wall assembly using both static and dynamic pressure differentials and varying spray rates.
A description of each stage is provided below, complete with test condition inputs and expected outputs. Where possible, water entering cavities and interstitial spaces through specified deficiencies was collected such that the rate of water entry at these locations could be estimated.
Cavity and driving pressures were measured using differential pressure transducers such that the driving potentials for each water entry point could be estimated. Pressure data was collected on a continual basis over the duration of a test at specified locations shown in Figure 1.8. The location, configuration and size of specified deficiencies are identified in Figure 1.11. Air leakage characteristics for the entire wall (perimeter leakage; window leakage, etc.) as well as for each of the specified deficiencies (i.e. water entry points) were determined using no less than five pressure data points and including a pressure point at 75Pa. Nominal air barrier leakage was set a 0.2 L/s-m2.
Water entry data was collected at each entry point having a collection trough and rates of water entry were calculated for both static and dynamic conditions for each of the pressure steps. Data on water entry under the influence of gravity alone (i.e. no pressure differential across assembly) was also obtained.
2.44-
V
D
E
L
T1
T2
T3
T4
T5
TW
W
Location of deficiencies ca. 1-mm x 50-mm Location of deficiencies ca. 10-mm x 90-mmi . ST A G E 1 - AI R L E A K A G E A N D P R E S S U R E E Q U A L I S A T I O N C H A R A C T E R I S T I C S
AI R L E A K A G E:
Air leakage is to be measured using laminar flow elements (MIRIAM) from which pressure readings are taken using a micromanometer (Air Limited) capable of assessing pressures to an accuracy of ± 0.5 Pa. For each test sequence, laboratory temperature and atmospheric
pressure are measured to apply corrections to the results obtained using the micromanometer.
The system leakage, Qs is given by: Qs = Qtl – (Qbl + Qpl)
Where:
• Qtl: Total system leakage derived from leakage tests at different pressures.
• Qbl: Base leakage (Leakage around DWTF door and piston) – Polyethylene is tightly
sealed to the steel frame on the laboratory side of the DWTF covering the specimen and its seal to the frame such that the only leakage is through the seals around the door and piston.
• Qpl: Specimen perimeter leakage – All leakage holes in the air barrier system are closed
such that leakage occurs through the specimen perimeter seal.
Air barrier system leakage – The air leakage across a series of holes in the air barrier was evaluated such that the chosen combination of holes provides the nominal requirement of 0.6 L/s or less (i.e. 0.1 L/s-m2 for a specimen having an area of 5.95m2)at a pressure difference of 75 Pa. Air leakage through the system was measured as a function of static pressure
difference across the assembly.
The characteristic leakage rate (L/s) of airflow through leakage holes was fitted to the pressure difference across the air barrier system by a least squares fit to the following equation:
Q = C • ?Pn
Leakage tests were conducted at the static pressure differentials provided in Table 1.1: Table 1. 1 – Static test pressures
Step Static pressure,
Pa 1 50 2 75 3 150 4 300 5 500 6 1000
PR E S S U R E E Q U A L I S A T I O N P O T E N T I A L
Dynamic tests were conducted to evaluate the pressure equalisation potential of the wall assemblies. Dynamic tests were conducted under a sinusoidal varying pressure with mean and amplitude given in Table 1.2 below. Two (2) test frequencies were used to assess the pressure equalisation response of the wall assemblies: 0.5 Hz and 2 Hz.
Table 1. 2 – Dynamic pressure fluctuations
Step Dynamic pressure, Pa
1 75 + 40•sin(2pft)
2 150 + 60•sin(2pft)
3 300 + 125•sin(2pft)
4 700 + 300•sin(2pft)
The driving pressure and pressure differences at each of the pressure taps were recorded and fitted to sine/cosine functions using a least squares fit. For the analysis ofthe data, amplitude and phase angle were determined and pressure equalisation response calculated.
i i . ST A G E 2 - WA T E R P E N E T R A T I O N T R I A L S
WA T E R P E N E T R A T I O N U N D E R S T A T I C C O N D I T I O N S – N O S P E C I F I E D D E F I C I E N C E S
Water penetration trials of Stage 2 were conducted on wall assemblies having no specified deficiencies. Wall assemblies were subjected to both static and dynamic pressure differentials and water entry was monitored through the use of moisture resistance sensors and by visual inspection. Water entry assessment through specified deficiencies is described in Stage 4 of the protocol.
The water penetration trials under static conditions consisted of 6 steps of increasing static pressure differential (Table 1.3) subjected to a nominal water spray rate of 3.4 L/s-m2. Each pressure “step” was conducted over either a 10 or 20-minute period such that water entry through the assembly can be determined either through the use of moisture resistance sensors or by visual inspection of the second line of defence.
Table 1. 3 – Static test pressures at nominal spray rate of 3.4 L/s-m2
Step Static pressure, Pa Dwell time, min.
1 0 20 2 75 20 3 150 20 4 300 20 5 500 20 6 1000 20 Total = 120 WA T E R P E N E T R A T I O N U N D E R D Y N A M I C C O N D I T I O N S – N O S P E C I F I E D D E F I C I E N C E S
Water penetration trials under dynamic conditions consisted of 5 steps of increasing dynamic pressure differential at 0.5 Hz (Table 1.4) and simultaneous application of a nominal water spray rate of 3.4 L/s-m2. Each pressure “step” was conducted over a 20-minute period such that water entry through the assembly could be determined either through the use of moisture resistance sensors (if these have not been activated in the previous trial) or by visual inspection of the second line of defence.
Table 1. 4 – Dynamic pressure loads at nominal spray rate of 3.4 L/s-m2
Step Dynamic pressure, Pa Dwell time, min.
1 75 + 40•sin(2pft) 20
2 150 + 60•sin(2pft) 20
3 300 + 125•sin(2pft) 20
4 700 + 300•sin(2pft) 20 Total = 80
i i i . ST A G E 3 – EF F E C T O F C O N T I N U O U S W A T E R S P R A Y
Immediately following Stage 2, water was applied to the surface of the wall specimen over a 16-hour period at a rate of 0.4 L/s-m2 and a pressure differential of 50 Pa. The intent was to
observe evidence of water penetration through unidentified deficiencies in the wall proper when subjecting the wall to a simulated extended “rain event”.
iv. ST A G E 4 - WATER ENTRY ASSESSMENTS
Water entry through specified deficiencies in the wall assembly was characterised using both static and dynamic pressure differentials and varying spray rates. Rates of water entry through specified deficiencies in the wall assembly were determined from the collection of water in troughs over a given time period. The troughs were fitted to the backside of the second line of defence as shown in Figure 1.11 or in the ventilation-drainage (hereafter referred to as
WA T E R E N T R Y T H R O U G H S P E C I F I E D D E F I C I E N C I E S U N D E R S T A T I C C O N D I T I O N S
The water entry assessments under static conditions consisted of 3 steps of increasing static pressure differential (Table 1.5) with simultaneous application of nominal rates of spray of 1.7 L/s-m2 and 3.4 L/s-m2. Each pressure “step” was conducted over either a 10 or 20-minute period such that water entry through the assembly could be determined from collection in specified gauges located behind second line of defence.
Table 1. 5 – Static test conditions
Step Nominal spray rate L/s-m2 Static pressure, Pa Dwell time, min. 1 0* 20 2 300 20 3 150 20 4 1.7 75 20 5 75 20 6 150 20 7 3.4 300 20
*preconditioning of simulated defects
WA T E R E N T R Y T H R O U G H S P E C I F I E D D E F E C I E N C I E S U N D E R D Y N A M I C C O N D I T I O N S
Water entry trials under dynamic conditions consisted of 3 steps of increasing dynamic pressure differential at 0.5 Hz (Table 1.6) with simultaneous application of nominal rates of spray of 1.7 L/s-m2 and 3.4 L/s-m2. Each pressure “step” was conducted over a 20-minute period such that water entry through the assembly could be determined from collection in specified gauges located behind second line of defence.
Table 1. 6 –Dynamic test conditions
Step
Nominal spray rate
L/s-m2
Dynamic pressure, Pa Dwell time, min. 1 0 5 2 75 + 40•sin(2pft) 20 3 150 + 60•sin(2pft) 20 4 1.7 300 + 125•sin(2pft) 20 5 75 + 40•sin(2pft) 20 6 3.4 150 + 60•sin(2pft) 20
CONSORTI UM FOR MOI STURE MANAGEMENT FOR EXTERI OR WALL SYSTEMS M O I S T U R E C O N T R O L P E R F O R M A N C E O F W A L L S Y S T E M S & SU B SY ST E M S
Chapt er 2
T
ABLE OFC
ONTENTS — Chapter 2 —Results on Base-Case Wall Assembly
TABLE OF CONTENTS ... 2-ii LI ST OF FI GURES ...2-iii LI ST OF TABLES...2-iv
2.1 INTRODUCTI ON... 2-1
2.2 EXPERI MENTAL APPROACH... 2-2
2.2.1 Specified Rainscreen Deficiencies... 2-3 2.2.2 Test Procedure... 2-4
2.3 RESULTS... 2-7
2.3.1 Static Results: Deficiency at Ventilation duct... 2-9 2.3.2 Dynamic Results : Ventilation duct Deficiency... 2-18 2.3.3 Electrical Outlet Deficiency... 2-24 2.3.4 Window Corner Deficiencies:... 2-26
LI ST OF TABLES
Table 2.1: Water Penetration Testing Standards ... 4 Table 2.2: Spray (Run Off) Rates in the Proximity of the Ventilation duct and Electrical Outlet
Rainscreen Deficiencies for the Base Case Wall as tested in the DWTF... 5 Table 2.3: Spray Rates (Run Off) in the Proximity of the Window and Window-Wall Interface
Deficiencies for Base Case Wall as tested in the DWTF... Error! Bookmark not defined.
Table 2.4: DWTF System Air Leakage Results ... 5
Table 2.5: Index of Tables for deficiency at the ventilation duct ... 7 Table 2.6: Water entry rates through deficiency atop ventilation duct for spray rates of 3.9 to 6.07
L/min.-m2 at given chamber pressures... 9
Table 2.7: Water entry rates through deficiency atop ventilation duct for spray rates of 3.9 to 6.07 L/min.-m2 at given chamber pressures* ... 12 Table 2.8: Water entry rates through deficiency atop ventilation duct for spray rates of 3.9 to 6.07 L/min.-m2
at given chamber pressures* ... 14
Table 2.9: Water entry rates through deficiency atop ventilation duct for spray rates of 3.9 to 6.07 L/min.-m2 at given chamber pressures* ... 16 Table 2.10: Water entry rates through deficiency atop ventilation duct for spray rates of 3.9 to 6.07
L/min.-m2 at given chamber pressures*... 18
Table 2.11: Water entry rates through deficiency atop ventilation duct for spray rates of 3.9 to 6.07 L/min.-m2 at given chamber pressures* ... 20
Table 2.12: Water entry rates through deficiency atop ventilation duct for spray rates of 3.9 to 6.07 L/min.-m2 at given chamber pressures* ... 21 Table 2.13: Water entry rates through deficiency atop ventilation duct for spray rates of 3.9 to 6.07
L/min.-m2 at given chamber pressures*... 22
Table 2.14: Water collection rates through deficiency above electrical outlet for various water flow rates and chamber pressures - *rainscreen not vented... 24 Table 2.15: Water collection rates through deficiency above electrical outlet for various water flow
rates and chamber pressures - *rainscreen fully vented (5400 mm2) ... 24 Table 2.16: Water entry rates through a 6-mm diameter deficiency in OUTBOARD window corner
for spray rates of 3.9 to 7 l/min-m2 at given chamber pressures... 27
Table 2.17: Water entry rates through a 6-mm diameter deficiency in OUTBOARD Window Corner
for spray rates of 3.9 to 7 L/min-m2 at given chamber pressures... 29
Table 2.18: Water entry rates through a 6 mm ø deficiency at INBOARD window corner for spray rates of 3.9 to 7 l/min-m2 at given chamber pressures... 29
Table 2.19: Water entry rates through a 6 mm diameter deficiency at INBOARD window corner for
LI ST OF FI GURES
Figure 2.1 - General configuration of the Base-Case wall assembly No. 2 showing location of nominal deficiencies in wall assembly and water collection troughs ... 2 Figure 2.2 - DWTF System Air Leakage, Pressure Difference vs. Air Leakage... 6 Figure 2.3 - Flow through deficiency as a function of differential chamber pressure – 90-mm2 Ventilation duct deficiency through a non vented rainscreen having a sealed second line of defence ... 10 Figure 2.4 – Flow through deficiency as a function of simulated precipitation rate – 90-mm2 Ventilation duct
deficiency through a non vented rainscreen having a sealed second line of defence ... 11 Figure 2.5 – Flow through deficiency as a function of differential chamber pressure – 90-mm2 Ventilation duct deficiency through a fully vented rainscreen having a sealed second line of defence... 13 Figure 2.6 – Flow through deficiency as a function of differential chamber pressure – 90-mm2 Ventilation duct deficiency through a fully vented rainscreen having a sealed second line of defence... 13 Figure 2.7 – Flow through deficiency as a function of differential chamber pressure – 90-mm2 Ventilation duct deficiency on non-vented rainscreen having the second line of defence not sealed ... 15 Figure 2.8 – Flow through deficiency as a function of differential chamber pressure – 90-mm2 Ventilation duct deficiency on non-vented rainscreen having second line of defence not sealed... 15 Figure 2.9 – Flow through deficiency as a function of differential chamber pressure – 90-mm2 Ventilation duct deficiency on fully vented rainscreen having the second line of defence not sealed... 17 Figure 2.10 – Flow through deficiency as a function of differential chamber pressure – 90-mm2 Ventilation
duct deficiency on fully vented rainscreen having second line of defence not sealed... 17 Figure 2.11 - Flow through deficiency as a function of differential dynamic pressure – 90-mm2 Ventilation
duct deficiency rainscreen not vented having the second line of defence sealed... 19 Figure 2.12 - Flow through deficiency as a function of differential dynamic pressure – 90-mm2 Ventilation
duct deficiency on fully vented rainscreen having the second line of defence sealed... 19 Figure 2.13 - Flow through deficiency as a function of differential dynamic pressure – 90-mm2 Ventilation
duct deficiency on fully vented rainscreen having the second line of defence sealed... 20 Figure 2.14 - Flow through deficiency as a function of differential dynamic pressure – 90-mm2 Ventilation
duct deficiency on not vented rainscreen having the second line of defence not sealed... 21 Figure 2.15 - Flow through deficiency as a function of differential dynamic pressure – 90-mm2 Ventilation
duct deficiency on fully vented rainscreen having the second line of defence not sealed ... 23 Figure 2.16 - Flow through deficiency as a function of precipitation rate at a mean dynamic pressure
differential of 700 Pa for 4 conditions investigated: (1) No rainscreen venting – sealed second line; (2) full rainscreen venting - sealed second line; (3) No rainscreen venting –second line not sealed; and, (4) full rainscreen venting - second line not sealed. ... 23 Figure 2.17 – Water entry (L/min.) through deficiency as a function of static differential pressure – 45-mm2
deficiency above electrical outlet for a non vented rainscreen having the second line of defence not sealed ... 25 Figure 2.18 – Water entry (L/min.) through a 45-mm2 deficiency above electrical outlet as a function of mean
Figure 2.19 – Water entry (L/min.) through a 6-mmdiam. deficiency in OUTBOARD corner of window as a function of static pressure differential. Results derived from a non-vented rainscreen having the second line of defence not sealed ... 27 Figure 2.20 – Water entry (L/min.) through a 6-mmdiam. deficiency in OUTBOARD corner of window as a
function of static pressure differential. Comparison of results from vented and non-vented
rainscreens having the second line of defence not sealed... 28 Figure 2.21 – Water entry (L/min.) through a 6-mmdiam. deficiency in OUTBOARD corner of window as a
function of mean dynamic pressure differential for non-vented rainscreen having the second line of defence not sealed... 28 Figure 2.22 – Water entry (L/min.) through 6-mmdiam. deficiencies in corner of window as a function of
mean dynamic pressure differential for both non-vented and vented rainscreens having the second line of defence not sealed ... 30
2 .1 I n t r o d u ct i o n
Information to help establish the performance characteristics of a “Base-case” wall assembly (initial acrylic wall) provided both qualitative as well as quantitative information on water entry and this would subsequently be used for assessing the water entry performance of generic wall types. Water entry through specified deficiencies located on the rainscreen of known size and location, was quantified in terms of simulated precipitation rate and pressure difference across the wall. Results indicated the quantity of water entering a specific deficiency could be evaluated as a function of the pressure differential across the deficiency. For a given pressure differential, quantities of water entering a deficiency varied in accordance with
precipitation rates and the size and nature of the opening.
In this Chapter, observations are provided from data collected on the water entry through a deficiency located in Base case (acrylic) wall assembly No. 2, specifically, an entry point located above a ventilation duct that penetrates the wall assembly proper. This assembly has the same through-wall penetrations (i.e. window, ventilation duct and electrical duplex) incorporated in it as those found in the generic wall assemblies (i.e. stucco, EIFS, masonry, siding).
The prototype wood-frame cavity wall sheathed in clear acrylic was designed and fabricated such that it included a rainscreen, a barrier acting as second line of defence, and an air barrier. Nominally, this permits qualitative information to be derived given that one can see through the clear acrylic sheathing during water entry tests. The use of an impermeable and clear material helped focus the investigation on water entry, exclusive of the effects due to water absorption by the cladding material. Here it is assumed that water will penetrate the first line of defence, and the qualitative information derived from identifying the path the water follows is of importance as is information on the possibility it comes into contact with the second line of defence or inner barrier.
The work focused on quantifying the amount of water entering deficiencies of known size at specific locations on a wall assembly given simulated precipitation rates (water spray rates), wind pressure differentials and air leakage characteristics of the assembly. Based on this information, the likelihood of water reaching the second line of defence for a given simulated wind driven rain condition and known deficiencies on the weather screen, will be a function of the assembly specific conditions, in particular: the dimensions and size of the venting cavity, the vent sizes, and the overall air leakage characteristics of the assembly.
2 .2 Ex pe r i m e n t a l a ppr oa ch
The experiment consisted of subjecting an acrylic sheathed wall assembly, in which deficiencies of known type, size and location were introduced, to various levels of simulated precipitation and pressure difference such that the rate of water entry through these deficiencies could be determined.
A diagram depicting the general configuration of the wall in elevation view is given in Figure
2.1. A description of the types of deficiencies is provided in §2.1. The test procedure is
described in §2.2, and includes calibration of simulated precipitation rates in proximity to the deficiencies and system air leakage.
The rainscreen was constructed such that a 19-mm cavity was formed between it and the second line of defence. The air barrier had an effective leakage area (ELA) of 120 mm2, assuming a rigid rainscreen.
Figure 2.1 - General configuration of the Base-Case wall assembly showing location of nominal
deficiencies in wall assembly and water collection troughs
2.44-m
Corner deficiencies in windows 6-mm diameter holes
Sealant deficiency 90-mm
Gasket deficiency 45-mm
Inboard Outboard
2 . 2 . 1 SP E C I F I E D RA I N S C R E E N DE F I C I E N C I E S
Details regarding specified deficiencies introduced onto the rainscreen cladding are provided below. Note that when reference is made in this chapter to “deficiencies”, in all instances this is referring to specified deficiencies.
2.2.1.1 SPECI FI ED ANCI LLARY FI XTURE DEFI CI EN CI ES:
(1) Horizontal sealant deficiency: A dryer ventilation duct set into a 175 mm circular opening in the wall at a height of 1590 mm from the bottom of the frame was sealed around its outer flange (flange-wall interface) with the exception of 90 mm of the interface located at the top horizontal edge. The deficiency was 90 mm long by 1.0 mm wide providing a cross sectional area of ca. 90 mm2
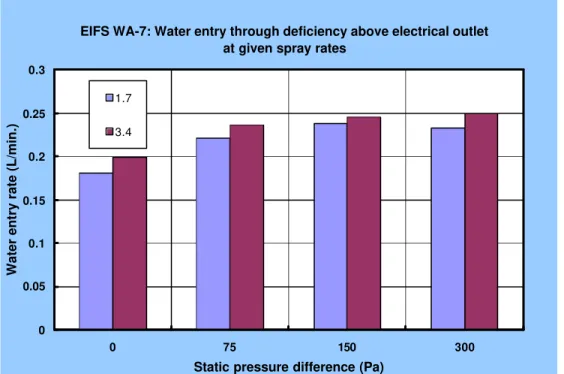
(2) Horizontal sealant deficiency: An exterior electrical outlet with a 45 mm wide deficiency cut into the cover plate neoprene gasket on the top horizontal edge.
2.2.1.2 SPECI FI ED WI N D O W-WALL IN T ERFA CE DEFI CI EN CI ES:
(3) Horizontal sill deficiency: A 90-mm portion of sealant missing between the windowsill and the wall sill interface (above the backing rod). 3/8” backing rod stuffed into the interface acts as a seal from the weather side elements.
(4) “L” shaped edge deficiency: A 180-mm portion of sealant missing between the window and wall interface at the lower left corner. The deficiency is a combination of a 90-mm horizontal and a 90-mm vertical deficiency. Backing rod (3/8” diameter) is placed in the space between adjacent the interface acts as a seal from the weather side elements.
2.2.1.3 SPECI FI ED WI NDOW DEFI CI EN CI ES:
(5) Circular hole (6-mm) bored through the weather side of the lower left corner of the vinyl window frame, outboard toward the sill edge. This is to simulate a weather side mitred corner deficiency in the window itself more exposed to the weather side elements than the inboard corner
(6) Circular hole (6-mm) bored through the lower right corner of the vinyl window frame, inboard toward the room side. This is to simulate a weather side mitred corner deficiency in the window less exposed to the weather side elements than the outboard deficiency.
2 . 2 . 2 TE S T PR O C E D U R E
2.2.2.1 PRECI PI T AT I ON RA T ES
In order to determine the actual rate of cascading water down the rainscreen surface it was determined that baseline calibration testing should be carried out on the assembly. A 59 cm Plexiglas trough was built, fitted and sealed against the weather-side of the rain screen at each area of the respective deficiency to be evaluated (ventilation duct, electrical outlet and window deficiencies). The trough was graded in ten 1-litre increments. At various pressure and nozzle settings (nozzles at 12-in. centres, at 24-in. centres and at 12/24-in. combination centres) the time for ten litres of water to be collected was recorded to the nearest second and the rate of water spray at a given location calculated in terms of l/min-m2 based on the gross area extending directly above the width of the trough.
Current standard specifications for water penetration testing are given in Table 2.1. Water spray rates at given test pressures are only measured in terms of initial impinging water on the rainscreen, not impinging and collected run off water.
Table 2.1: Water Penetration Testing Standards
Standard Test Pressure (Pa) Water Spray (L/min-m2) AAMA 501 575 3.4 ASTM E547 137 3.4 CAN-A440-M 700 3.4 European 500 1.0 JSI-A-1517 490 4.0
Baseline precipitation results are shown in Table 2.2. For the cases of the ventilation duct deficiency and the electrical outlet deficiency the collection area (impinging and runoff) totalled 0.686 m2 (0.59 m wide X 1.16 m high). The amount of time required for the collection trough to collect 10 litres of run off water was recorded. In order to approximate the current standard specifications for water penetration testing (see Table 2.1) a combination of half the 12” centred nozzles and half the 24” centred nozzles was used. The precipitation calibration procedure does not account for water that bounces off the wall after initial contact.
Table 2.2: Spray (Run Off) Rates in the Proximity of the Ventilation duct and Electrical Outlet Rainscreen Deficiencies for the Base Case Wall as tested in the DWTF
24 ” Center Nozzles 12 ” Center Nozzles 12/24 ” Center Nozzles * Regulator Pressure (psi) Spray Rate (L/min- m2) Regulator Pressure (psi) Spray Rate (L/min- m2) Regulator Pressure (psi) Spray Rate (L/min- m2) 10 0.85 10 2.99 10 3.90 15 1.02 15 4.17 15 4.28 20 1.15 20 5.21 20 4.56 25 1.24 25 5.91 25 4.73 30 1.25 30 6.38 30 5.57 35 1.31 35 6.63 35 5.83 40 1.35 40 7.00 40 6.07 2.2.2.2 DWTF SYST EM AI R LEA KA GE
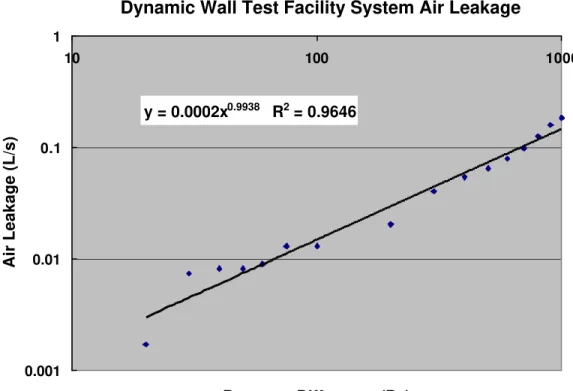
In order to provide accurate air leakage profiles of all specimens, it was necessary to establish baseline air leakage results for the DWTF system as a whole using and air-tight specimen (metal enclosure). The piston, door and specimen seals as well as pipe, wire and instrumentation joint, hatches are not completely air-tight. By isolating certain components of the system with polyethylene sheathing then gathering air leakage data, baseline air leakage results were obtained. Table 2.3 provides results obtained for the DWTF system leakage that have been subsequently plotted in Figure 2.2. Any subsequent specimen results would have this system leakage result deducted from the collected specimen data. Figure 2.2 shows pressure difference as a function of air leakage plotted with logarithmic scales.
Table 2.3: DWTF System Air Leakage Results
Chamber Pressure (Pa) Air leakage (l/s) Chamber Pressure (Pa) Air leakage (l/s) 30 0.0074 400 0.0540 40 0.0082 500 0.0644 50 0.0082 600 0.0788 60 0.0090 700 0.0980 75 0.0130 800 0.1251 100 0.0130 900 0.1592 200 0.0203 1000 0.1837 300 0.0404
Figure 2.2 - DWTF System Air Leakage, Pressure Difference vs. Air Leakage
Dynamic Wall Test Facility System Air Leakage
y = 0.0002x0.9938 R2 = 0.9646 0.001 0.01 0.1 1 10 100 1000
Pressure Difference (Pa)
2 .3 R e su l t s
In this Chapter results are provided from water entry through deficiencies located at the top of a ventilation duct (VL), an electrical outlet (E) and at adjacent lower corners of a vinyl window (W). The deficiencies were subjected to simulated precipitation (water spray) concurrent with either static or dynamic pressure differentials across the assembly.
Rates of water collection were recorded for water entry through horizontal sealant
deficiencies located on the rainscreen of the wall assembly for the simulated precipitation rates (spray rate) and under both static and dynamic pressure modes (air pressure mode). The degree of venting of the rainscreen was varied between none and fully open. In the case of fully open, the rainscreen had a series of openings at the base of wall assembly that collectively offered approximately 5400-mm2 of venting area to the rainscreen. Tests were also carried out such that the second line of defence at the periphery of the joint between the ventilation duct and the sheathing board was either sealed or not (i.e. open). An overview of the results is provided in Table 2.4 in which a dot (•) indicates instances where observations have been made, the data from these tests being provided in Table 2.5 to
Table 2.18.
Table 2.4: Index of Tables for deficiency at the ventilation duct
Table Spray
Rate Air Pressure mode
Rainscreen Venting 2nd Line of Defence… * 3.90-6.07 (l/min m 2 ) 0-1000 (Pa) 75 ± 40 (Pa) 150 ± 60 (Pa) 300 ± 125 (Pa) 700 ± 300 (Pa) None (0 mm 2 ) Full (5400 mm 2 )
Sealed Open Deficiency type
6 • • • • VL 7 • • • • VL 8 • • • • VL 9 • • • • VL 10 • • • • • • • VL 11 • • • • • • • VL 12 • • • • • • • VL 13 • • • • • • • VL 14 • • • • • • • • E 15 • • • • • • • • E 16 • • • • • • • • W-O 17 • • • • • • • • W-O 18 • • • • • • • • W-I
2 . 3 . 1 ST A T I C RE S U L T S: DE F I C I E N C Y A T VE N T I L A T I O N D U C T
2.3.1.1 RAI N SCREEN N O T VEN T ED / SECON D LI N E OF D EFEN CE SEALED
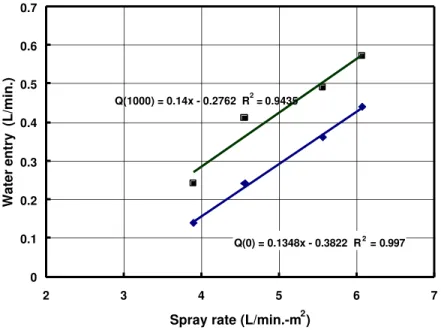
Data is provided in Table 2.5 on water entry rates through a 90-mm horizontal deficiency of ca. 1-mm height located in the top portion of the ventilation duct that penetrates the rainscreen. These trials were conducted for a rainscreen that was not vented and in which the second line of defence around the ventilation duct is sealed.
Table 2.5: Water entry rates through deficiency atop ventilation duct for spray rates of
3.9 to 6.07 L/min.-m2 at given chamber pressures
Water entry through deficiency (L/min.) Nominal Water Spray rate (L/min-m2 )
Chamber Pressure (Pa) 3.90 4.56 5.57 6.07 Air Leakage Through Deficiency (L/s) 0 0.14 0.24 0.36 0.44 0.00 75 0.17 0.29 0.48 0.56 0.42 150 0.18 0.30 0.49 0.59 1.36 300 0.27 0.32 0.54 0.63 2.99 600 0.24 0.32 0.57 0.62 4.33 1000 0.25 0.34 0.58 0.64 5.94
The water entry varies as a function of both the spray rate and differential chamber pressure as shown in Figure 2.3 and Figure 2.4 below. The dependency of water entry on changes in the differential pressure is not as evident as is water entry in relation to the spray rate. As can be seen in Figure 2.4, water entry rates vary linearly as a function of the simulated rate of
precipitation up to rates upwards of 6 L/min.-m2.
Figure 2.3 - Water entry through deficiency as a function of differential chamber pressure – 90-mm2
Ventilation duct deficiency through a non-vented rainscreen having a sealed second line of defence
Values in the legend relate to spray rate (L/min-m2)
Q(1000) = 0.19x - 0.5024 R2 = 0.9866 Q(0) = 0.1348x - 0.3822 R2 = 0.997 0 0.1 0.2 0.3 0.4 0.5 0.6 0.7 2 3 4 5 6 7
Spray rate (L/min.-m2)
Water entry (L/min.)
0 0.2 0.4 0.6 0.8 1 1.2 0 200 400 600 800 1000 1200 1400
Static pressure differential (Pa)
Water entry (L/min. )
3.90 4.56 5.57 4.50 6.07 5.21 6.34 7.00
Figure 2.4 – Water entry through deficiency as a function of simulated precipitation rate – 90-mm2
2.3.1.2 RAI NSCREEN FULLY VENT ED / SECON D LI N E OF D EFEN CE SEALED
Data is provided in Table 2.6 on water entry rates through a 90-mm horizontal deficiency of ca. 1-mm height located in the top portion of the ventilation duct that penetrates the rainscreen. These trials were conducted for a rainscreen that was fully vented and in which the second line of defence around the ventilation duct is sealed.
Table 2.6: Water entry rates through deficiency atop ventilation duct for spray rates of
3.9 to 6.07 L/min.-m2 at given chamber pressures
Rainscreen fully vented / second line of defence sealed
Water entry through deficiency (L/min.) Nominal Water Spray rate (L/min-m2 )
Chamber Pressure (Pa) 3.90 4.56 5.57 6.07 Air Leakage Through Deficiency (L/s) 0 0.14 0.24 0.36 0.44 0.00 75 0.14 0.24 0.39 0.44 0.76 150 0.14 0.24 0.42 0.53 1.76 300 0.16 0.25 0.50 0.54 2.15 600 0.18 0.26 0.53 0.57 4.76 1000 0.20 0.27 0.54 0.60 6.71
The water entry varies as a function of both the spray rate and differential chamber pressure as shown in Figure 2.5 and Figure 2.6 below. As in the previous instance, the dependency of water entry on the spray rate is more significant than for changes in the differential pressure. Water entry rates are shown to vary linearly with precipitation rate (Figure 2.6).
Figure 2.5 – Water entry through deficiency as a function of differential chamber pressure – 90-mm2
Ventilation duct deficiency through a fully vented rainscreen having a sealed second line of defence Values in the legend relate to spray rate (L/min-m2)
Figure 2.6 – Water entry through deficiency as a function of differential chamber pressure – 90-mm2
Ventilation duct deficiency through a fully vented rainscreen having a sealed second line of defence
Q(1000) = 0.1988x - 0.5965 R2 = 0.9742 Q(0) = 0.1348x - 0.3822 R2 = 0.997 0 0.1 0.2 0.3 0.4 0.5 0.6 0.7 2 3 4 5 6 7
Spray rate (L/min.-m2)
Water entry (L/min.)
0 0.2 0.4 0.6 0.8 1 1.2 0 200 400 600 800 1000 1200 1400
Static pressure differential (Pa)
Water entry (L/min.)
3.9 4.56 5.57 6.07 4.5 5.21 6.34 7
2.3.1.3 RAI N SCREEN N O T VEN T ED / SECON D LI N E OF D EFEN CE N OT SEALED
Data is provided in Table 2.7 on water entry rates through a 90-mm horizontal deficiency of ca. 1-mm height located in the top portion of the ventilation duct that penetrates the rainscreen. These trials were conducted for a rainscreen that was not vented and in which the second line of defence around the ventilation duct is not sealed.
Table 2.7: Water entry rates through deficiency atop ventilation duct for spray rates of 3.9 to 6.07 L/min.-m2 at given chamber pressures
-Rainscreen not vented / second line of defence not sealed
Water entry through deficiency (L/min.) Nominal Water Spray rate (L/min-m2 )
Chamber Pressure (Pa) 3.90 4.56 5.57 6.07 Air Leakage Through Deficiency (L/s) 0 0.14 0.24 0.36 0.44 0.00 75 0.16 0.28 0.40 0.50 0.05 150 0.14 0.31 0.41 0.49 0.16 300 0.20 0.32 0.46 0.51 0.56 600 0.21 0.36 0.48 0.52 1.33 1000 0.24 0.41 0.49 0.57 2.02
Water entry varies as a function of both the spray rate and differential chamber pressure and the dependency of water entry on changes in the differential pressure is not as evident as is the water entry in relation to the simulated precipitation rate (Figure 2.7 and Figure 2.8).
Figure 2.7 – Water entry through deficiency as a function of differential chamber pressure – 90-mm2
ventilation duct deficiency on non-vented rainscreen having the second line of defence not sealed Values in the legend relate to spray rate (L/min-m2)
Figure 2.8 – Water entry through deficiency as a function of differential chamber pressure – 90-mm2
Q(1000) = 0.14x - 0.2762 R2 = 0.9435 Q(0) = 0.1348x - 0.3822 R2 = 0.997 0 0.1 0.2 0.3 0.4 0.5 0.6 0.7 2 3 4 5 6 7
Spray rate (L/min.-m2)
Water entry (L/min.)
0 0.2 0.4 0.6 0.8 1 1.2 0 200 400 600 800 1000 1200 1400
Static pressure differential (Pa)
Water entry (L/min.)
3.9 4.56 5.57 4.5 6.07 5.21 6.34 7
2.3.1.4 RAI NSCREEN FULLY VENT ED / SECON D LI N E OF D EFEN CE N OT SEALED
Data is provided in Table 2.8 on water entry rates through a 90-mm horizontal deficiency of ca. 1-mm height located in the top portion of the ventilation duct that penetrates the rainscreen. These trials were conducted for a rainscreen that was fully vented and in which the second line of defence around the ventilation duct is not sealed.
Table 2.8: Water entry rates through deficiency atop ventilation duct for spray rates of
3.9 to 6.07 L/min.-m2 at given chamber pressures
Rainscreen fully vented / second line of defence not sealed
Water entry through deficiency (L/min.) Nominal Water Spray rate (L/min-m2 )
Chamber Pressure (Pa) 3.90 4.56 5.57 6.07 Air Leakage Through Deficiency (L/s) 0 0.12 0.23 0.35 0.44 0.00 75 0.12 0.22 0.38 0.44 0.99 150 0.13 0.23 0.39 0.50 1.85 300 0.14 0.24 0.44 0.50 2.29 600 0.16 0.25 0.47 0.53 4.79 1000 0.17 0.26 0.52 0.56 6.69
Results plotted in these figures also follow the same pattern reported earlier: water entry varies as a function of both the simulated precipitation rate and differential chamber pressure and the dependency of water entry on changes in the differential pressure are not as evident as is water entry to the spray rate (Figures 2.9 and 2.10)
Figure 2.9 – Water entry through deficiency as a function of differential chamber pressure – 90-mm2
Ventilation duct deficiency; fully vented rainscreen; second line of defence not sealed Values in the legend relate to spray rate (L/min-m2)
Figure 2.10 – Water entry through deficiency as a function of differential chamber pressure – 90-mm2
Ventilation duct deficiency on fully vented rainscreen having second line of defence not sealed
Q(1000) = 0.1938x - 0.5965 R2 = 0.9763 Q(0) = 0.1423x - 0.4302 R2 = 0.9941 0 0.1 0.2 0.3 0.4 0.5 0.6 0.7 2 3 4 5 6 7
Spray rate (L/min.-m2)
Water entry (L/min.)
0 0.2 0.4 0.6 0.8 1 1.2 0 200 400 600 800 1000 1200 1400
Static pressure differential (Pa)
Water entry (L/min.)
3.9 4.56 5.57 4.5 6.07 5.21 6.34 7
2 . 3 . 2 DY N A M I C RE S U L T S : VE N T I L A T I O N D U C T DE F I C I E N C Y
Results from water entry tests through a deficiency in a ventilation duct and conducted under dynamic pressure conditions (0.5 Hz) are provided in Table 2.9 to 2.21 and Figure 2.11 to 2.15. Details on the type of data specific to a given test condition are provided in the respective sub-sections.
2.3.2.1 RAI N SCREEN N O T VEN T ED / SECON D LI N E OF D EFEN CE SEALED
Data is provided in Table 2.9 on water entry rates through a 90-mm horizontal deficiency of ca. 1-mm height located in the top portion of the ventilation duct that penetrates the rainscreen. These trials were conducted under dynamic pressure fluctuations for a rainscreen that was not vented and in which the second line of defence around the ventilation duct is sealed.
Table 2.9: Water entry rates through deficiency atop ventilation duct for spray rates of 3.9 to 6.07 L/min.-m2 at given chamber pressures
Rainscreen not vented / second line of defence sealed
Water entry through deficiency (L/min.) Nominal Water Spray rate (L/min-m2 )
Chamber Dynamic Pressure @ 5 Hz. (Pa) 3.90 4.28 4.56 5.06 5.57 5.83 6.07 75 ± 50 0.14 0.22 0.34 0.38 0.38 0.42 0.46 150 ± 60 0.16 0.25 0.36 0.38 0.44 0.48 0.53 300 ± 125 0.20 0.24 0.33 0.40 0.46 0.48 0.55 700 ± 300 0.18 0.26 0.38 0.39 0.47 0.52 0.57
Figure 2.11 - Water entry through deficiency as a function of differential dynamic pressure – 90-mm2 Ventilation duct deficiency; rainscreen not vented; second line of defence sealed
Values in the legend relate to spray rate (L/min-m2)
Figure 2.12 - Water entry through deficiency as a function of differential dynamic pressure – 90-mm2
Ventilation duct deficiency on fully vented rainscreen having the second line of defence sealed
Q ( 7 5 ) = 0 . 1 2 9 6 x - 0 . 3 1 8 7 R2 = 0 . 8 7 5 2 Q ( 7 0 0 ) = 0 . 1 6 5 3 x - 0 . 4 3 7 3 R2 = 0 . 9 5 5 3 0 0 . 1 0 . 2 0 . 3 0 . 4 0 . 5 0 . 6 2 3 4 5 6 7 S p r a y r a t e ( L / m i n . - m2)
Water entry (L/min.)
0 0.1 0.2 0.3 0.4 0.5 0.6 0.7 0.8 0.9 1 0 200 400 600 800 1 0 0 0
Mean dynamic pressure (Pa)
Water entry (L/min.)
2.57 2.84 3.11 3.43 3.75 3.89 4.03 4.27 4.31 4.48 5.02 5.61 5.57 6.07
2.3.2.2 RAI NSCREEN FULLY VENT ED / SECON D LI N E OF D EFEN CE SEALED
Data is provided in Table 2.10 on water entry rates through a 90-mm horizontal deficiency of ca. 1-mm height located in the top portion of the ventilation duct that penetrates the rainscreen. These trials were conducted under dynamic pressure fluctuations for a rainscreen that was fully vented and in which the second line of defence around the ventilation duct is sealed.
Table 2.10: Water entry rates through deficiency atop ventilation duct for spray rates of
3.9 to 6.07 L/min.-m2 at given chamber pressures
Rainscreen fully vented / second line of defence sealed
Volume through deficiency (L/min.) Nominal Water Spray rate (L/min-m2 )
Chamber Dynamic Pressure @ 5 Hz. (Pa) 3.90 4.56 5.57 6.07 75 ± 50 0.16 0.37 0.45 0.51 150 ± 60 0.20 0.35 0.38 0.49 300 ± 125 0.22 0.34 0.38 0.47 700 ± 300 0.20 0.32 0.37 0.49
Figure 2.13 - Water entry through deficiency as a function of differential dynamic pressure – 90-mm2
Ventilation duct deficiency on fully vented rainscreen having the second line of defence sealed Q(75) = 0.1484x - 0.3734 R2 = 0.9027 Q(700) = 0.1184x - 0.2499 R2 = 0.9294 0.0 0.1 0.2 0.3 0.4 0.5 0.6 2 3 4 5 6 7
Spray rate (L/min.-m2)
2.3.2.3 RAI N SCREEN N O T VEN T ED / SECON D LI N E OF D EFEN CE N OT SEALED
Data is provided in Table 2.11 on water entry rates through a 90-mm horizontal deficiency of ca. 1-mm height located in the top portion of the ventilation duct that penetrates the rainscreen. These trials were conducted under dynamic pressure fluctuations for a rainscreen that was not vented and in which the second line of defence around the ventilation duct is not sealed.
Table 2.11: Water entry rates through deficiency atop ventilation duct for spray rates of
3.9 to 6.07 L/min.-m2 at given chamber pressures
Rainscreen not vented / second line of defence not sealed
Volume through deficiency (L/min.) Nominal Water Spray rate (L/min-m2 ) Chamber Dynamic Pressure @ 5 Hz. (Pa) 3.90 4.56 5.57 6.07 75 ± 50 0.23 0.29 0.38 0.57 150 ± 60 0.26 0.34 0.41 0.38 300 ± 125 0.26 0.34 0.42 0.29 700 ± 300 0.27 0.38 0.44 0.23
Figure 2.14 - Water entry through deficiency as a function of differential dynamic pressure – 90-mm2
Ventilation duct deficiency on not vented rainscreen having the second line of defence not sealed Q(75) = 0.1425x - 0.3486 R2 = 0.8825 Q(700) = 0.1127x - 0.159 R2 = 0.9533 0 0.1 0.2 0.3 0.4 0.5 0.6 2 3 4 5 6 7
Spray rate (L/min.-m2)