A Cellular Taxonomy of the Bone Marrow
Stroma in Homeostasis and Leukemia
The MIT Faculty has made this article openly available.
Please share
how this access benefits you. Your story matters.
Citation
Baryawno, Ninib et al. "A Cellular Taxonomy of the Bone Marrow
Stroma in Homeostasis and Leukemia." Cell 177, 7 (June 2019):
P1915-1932.e16 © 2019 Elsevier
As Published
http://dx.doi.org/10.1016/j.cell.2019.04.040
Publisher
Elsevier BV
Version
Author's final manuscript
Citable link
https://hdl.handle.net/1721.1/126112
Terms of Use
Creative Commons Attribution-NonCommercial-NoDerivs License
A cellular taxonomy of the bone marrow stroma in homeostasis
and leukemia
Ninib Baryawno1,2,3,4,†, Dariusz Przybylski5,†, Monika S. Kowalczyk5,†, Youmna Kfoury1,2,3,
Nicolas Severe1,2,3, Karin Gustafsson1,2,3, Konstantinos D. Kokkaliaris1,2,3, Francois Mercier1,2,3, Marcin Tabaka5, Matan Hofree5, Danielle Dionne5, Ani Papazian1,2,3, Dongjun
Lee1,2,3,6, Orr Ashenberg5, Ayshwarya Subramanian5, Eeshit Dhaval Vaishnav5, Orit
Rozenblatt-Rosen5, Aviv Regev5,7,8,*, and David T. Scadden1,2,3,8,*,#
1Center for Regenerative Medicine, Massachusetts General Hospital, Boston, MA 02114, USA 2Harvard Stem Cell Institute, Cambridge, MA 02138, USA
3Department of Stem Cell and Regenerative Biology, Harvard University, Cambridge, MA 02138,
USA
4Childhood Cancer Research Unit, Dep. of Children’s and Women’s Health, Karolinska Institutet,
171 77 Stockholm, Sweden
5Klarman Cell Observatory, Broad Institute of Harvard and MIT, Cambridge, MA 02142, USA 6Department of Convergence Medical Science, Pusan National University School of Medicine,
Yangsan 50612, Republic of Korea.
7Howard Hughes Medical Institute, Koch Institute of Integrative Cancer Research, Department of
Biology, Massachusetts Institute of Technology, Cambridge, MA 02142, USA
8Senior author
SUMMARY
*Correspondence: aregev@broadinstitute.org (AR), david_scadden@harvard.edu (D.T.S.).
Author contributions. Conceptualization, N.B., D.P., M.K., A.R. and D.T.S;Investigation,N.B., M.K., N.S., K.G., A.P., F.M., D.D.,
K.D.K., M.H., D.D., O.R.R. and D.L; Validation, N.B. and K.D.K.; Computational investigation and analysis, D.P. with help and code contributions from M.T., M.H., A.S., O.A., and E.D.V.; Writing -– Original draft, N.B., D.P., M.K., A.R. and D.T.S.; Writing – Review & Editing, N.B., D.P., M.K., Y.K., N.S., K.D.K., A.R., and D.T.S; Funding Acquisition, Resources & Supervision, A.R. and D.T.S. †These authors contributed equally
#Lead contact: david_scadden@harvard.edu (D.T.S.)
Publisher's Disclaimer: This is a PDF file of an unedited manuscript that has been accepted for publication. As a service to our
customers we are providing this early version of the manuscript. The manuscript will undergo copyediting, typesetting, and review of the resulting proof before it is published in its final citable form. Please note that during the production process errors may be discovered which could affect the content, and all legal disclaimers that apply to the journal pertain.
Data and Software Availability
The scRNA-seq data generated in this study are deposited in GEO (GSE128423, https://www.ncbi.nlm.nih.gov/geo/query/acc.cgi? acc=GSE128423).
Declaration of Interests
D.T.S., director and shareholder of Magenta Therapeutics, Agios Pharmaceuticals, Editas Medicines, Clear Creek Bio, Red Oak Medicines and LifeVaultBio; a shareholder of Fate Therapeutics, a consultant for Magenta Therapeutics, Clear Creek Bio, Red Oak Medicines, VCanBio and a SAB member of FOG Pharma. A.R., a founder and equity holder of Celsius Therapeutics; a member of the
HHS Public Access
Author manuscript
Cell
. Author manuscript; available in PMC 2020 June 13.Published in final edited form as:
Cell. 2019 June 13; 177(7): 1915–1932.e16. doi:10.1016/j.cell.2019.04.040.
A
uthor Man
uscr
ipt
A
uthor Man
uscr
ipt
A
uthor Man
uscr
ipt
A
uthor Man
uscr
ipt
Stroma is a poorly defined non-parenchymal component of virtually every organ with key roles in organ development, homeostasis and repair. Studies of the bone marrow stroma have defined individual populations in the stem cell niche regulating hematopoietic regeneration and capable of initiating leukemia. Here, we use single-cell RNA-seq to define a cellular taxonomy of the mouse bone marrow stroma and its perturbation by malignancy. We identified seventeen stromal subsets expressing distinct hematopoietic regulatory genes spanning new fibroblastic and osteoblastic subpopulations including distinct osteoblast differentiation trajectories. Emerging acute myeloid leukemia impaired mesenchymal osteogenic differentiation and reduced regulatory molecules necessary for normal hematopoiesis. These data suggest that tissue stroma responds to malignant cells by disadvantaging normal parenchymal cells. Our taxonomy of the stromal compartment provides a comprehensive bone marrow cell census and experimental support for cancer cell crosstalk with specific stromal elements to impair normal tissue function and thereby enable emergent cancer.
Graphical Abstract
eTOC Blurb
Molecular definition of the cell populations comprising bone marrow stroma is provided with single cell resolution. Seventeen distinct cell subsets with new mesenchymal, pericyte, fibroblast and endothelial subpopulations, new inferred osteolineage differentiation trajectories and
distinctions among Lepr, Nestin and NG2-expressing HSC niche populations defined. The changes imposed by an emergent AML indicate impaired stromal differentiation among mesenchymal cells
A
uthor Man
uscr
ipt
A
uthor Man
uscr
ipt
A
uthor Man
uscr
ipt
A
uthor Man
uscr
ipt
and decreased expression of hematopoietic regulatory genes consistent with cancer cells indirectly impairing the normal hematopoietic cells with whom they must compete.
Keywords
Hematopoiesis; stem cell; stroma; bone marrow niche; single-cell RNA-sequencing; leukemia; tumor microenvironment
INTRODUCTION
Stem cell niches are a tissue microenvironment that maintains and regulates stem cell function through cellular interactions and secreted factors (Schofield, 1978; Scadden, 2014). Hematopoiesis provides a paradigm for understanding mammalian stem cell niches with pivotal knowledge from numerous in vivo studies on the critical role of specific non-hematopoietic, stromal cells in regulating hematopoietic stem cell (HSC) function (Calvi et al., 2003; Ding et al., 2012; Kunisaki et al., 2013; Mendez-Ferrer et al., 2010; Zhang et al., 2003).
One major component is multipotent mesenchymal stem/stromal cells (MSCs),
nonhematopoietic cells derived from the mesoderm with potential to differentiate into bone, fat and cartilage in vitro (Kfoury and Scadden, 2015). While MSCs are found in most tissues, their diversity and lineage relationships are incompletely understood. For instance, several subtypes of MSCs that regulate HSCs have been described in specialized bone niches. Most of them are located in the perivascular space and associated with arteriole or sinusoidal blood vessels, produce key HSC niche factors such as Cxcl12 and Stem Cell Factor (SCF, also named Kitl) (Morrison and Scadden, 2014). They are identified by expression of Leptin receptor (Lepr) (Ding and Morrison, 2013; Ding et al., 2012), Nestin (Nes) (Mendez-Ferrer et al., 2010) or NG2 (Cspg4) (Kunisaki et al., 2013), and were mostly studied in Lepr-cre, Nes-GFP and NG2-CreER reporter lines, respectively. However, the Lepr-cre (Zhou et al., Cell Stem Cell, 2014) and Nes-GFP (Mendez-Ferrer et al., Nature 2010) are non-inducible mouse lines withexpression throughout development or with discrepancy between expression of the marker gene and that of the endogenous locus. Therefore, it is unclear if these markers delineate distinct or overlapping cell populations. Other non-hematopoietic cells, including bone marrow derived endothelial cells (BMECs) and MSC-descendent osteolineage cells (OLCs), also function as niche cells. BMECs produce Cxcl12 and Kitl and are critical regulators of HSC function (Butler et al., 2010; Ding et al., 2012; Doan et al., 2013; Hooper et al., 2009; Itkin et al., 2016; Kobayashi et al., 2010; Kusumbe et al., 2016). OLCs are critical for HSC homing after lethal irradiation and bone marrow transplantation (Lo Celso et al., 2009), modulate hematopoietic progenitor function and lineage maturation (Ding and Morrison, 2013; Yu et al., 2016; Yu et al., 2015), and dysfunction in some of them has been implicated in development of myelodysplasia and leukemia (Dong et al., 2016; Kode et al., 2014; Raaijmakers et al., 2010; Zambetti et al., 2016).
Despite extensive studies, a comprehensive analysis of bone marrow stromal cells is missing, limiting our ability to prospectively isolate and functionally characterize niche
A
uthor Man
uscr
ipt
A
uthor Man
uscr
ipt
A
uthor Man
uscr
ipt
A
uthor Man
uscr
ipt
cells. Previous profiling studies used reporter genes to purify bulk cell populations
(Morrison and Scadden, 2014), which necessarily underestimate cell complexity and restrict analysis in a marker-biased manner.
Here, we use single cell RNA-seq (scRNA-seq) to chart a comprehensive census of the bone marrow stroma. We identified 17 distinct cell subsets and their gene signatures, and defined stromal cells expressing key niche factors at steady-state hematopoiesis. We further inferred their differentiation relationships, and characterized diversity within specific cell types. Finally, we dissected the global influence of developing acute myeloid leukemia (AML) on the bone marrow microenvironment and described resulting cellular and molecular
abnormalities.
RESULTS
A scRNA-seq census of bone marrow stroma identifies six distinct cell populations, and their differentiation relations
To explore the cellular composition of the mouse bone marrow stroma, we profiled non-hematopoietic bone marrow cells from C57Bl/6 mice (n=14) by droplet-based scRNA-seq (Figure 1A,B, S1A–E). Unbiased clustering of the stroma resulted in 17 clusters originating from bone or bone marrow (Figure 1B (insert), Table S1), spanning MSCs, OLCs,
chondrocytes, fibroblasts, BMECs and pericytes and possible transitional states (Figure 1B– H, S1F–H). In particular, there were: (1) MSCs (cluster 1, expressing Lepr (Ding and Morrison, 2013) and Cxcl12 (Greenbaum et al., 2013)); (2) two OLC subsets (Cluster 7 and 8, expressing osteocalcin (Bglap) (Delmas et al., 1986)); (3) four chondrocyte subsets (clusters 2, 10, 13 and 17; expressing the chondrocyte markers, Aggrecan (Acan) (Doege et al., 1991) and Col2a1 (Chan et al., 1995)); (4) five fibroblasts subsets (Cluster 3, 5, 9, 15 and 16; expressing Fibroblast specific protein-1 (S100a4) (Strutz et al., 1995); (5) three BMEC subsets (Clusters 0, 6, 11; expressing the pan-endothelial marker Ve-cadherin (Cdh5) (Corada et al., 2001)); (6) pericytes (Cluster 12, expressing alpha smooth muscle actin (Acta2) (Armulik et al., 2011)); and (7) Clusters 4 and 8, expressing markers of chondrocytes, osteoblasts and fibroblasts. Fibroblasts, OLCs and chondrocytes had the lowest proliferation status (Figure S1I).
To help resolve differentiation relations among cells we used correlations of average expression profiles between clusters (Figure 1F), graph abstraction (Wolf et al., 2017b) (Figure 1G), and diffusion map analysis (Schiebinger et al., 2017) (Figure 1H, S1F). We discuss these below in the context of each lineage and differentiation path.
We validated two of the most abundant subsets, MSCs and BMECs by FACS, showing that the four clusters can be partitioned prospectively by using antibodies that label BMECs (CD31, Sca-1(Ly6a), CD34, Cdh5) or MSCs (CD106) (Figure S1G, K, L).
Lepr-MSCs produce HSC regulators and partition into subsets spanning a differentiation continuum
The prevailing model of MSCs in the bone marrow is that of a multipotent stem cell that can differentiate into bone cells, adipocytes and chondrocytes (Dominici et al., 2006), but their
A
uthor Man
uscr
ipt
A
uthor Man
uscr
ipt
A
uthor Man
uscr
ipt
A
uthor Man
uscr
ipt
exact identity remains unclear. While many protein markers have been proposed and deployed in mice (e.g., Cxcl12, Lepr, Nes, NG2 (Ding and Morrison, 2013; Ding et al., 2012; Kunisaki et al., 2013; Mendez-Ferrer et al., 2010; Sugiyama et al., 2006), or human (CD73 (Nt5e), CD106 (Vcam1) (Mabuchi et al., 2013), CD105 (Eng) (Dominici et al., 2006), CD90 (Thy1) (Pittenger et al., 1999)), there is no single accepted combination and some may also be expressed by pericytes, BMECs and chondrocytes (Kfoury and Scadden, 2015). We hypothesized that more comprehensive transcriptional profiles will better identify subsets and relate them to legacy markers.
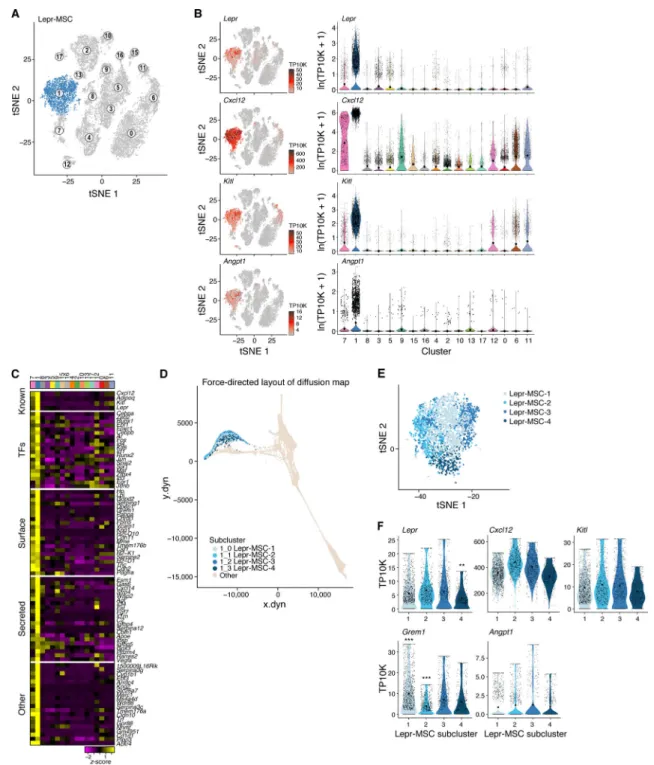
We annotated cluster 1 (Figure 2A) as Lepr+ mesenchymal stromal cells (hereafter referred to as Lepr-MSCs) with pre-adipocytic features. First, the cells highly expressed Lepr, a perivascular MSC marker (Ding et al., 2012; Morrison and Scadden, 2014), adiponectin (Adipoq), a gene highly expressed in preadipocytes (Lara-Castro et al., 2007), and the key HSC niche factors Cxcl12, Kitl and Angiopoietin-1 (Angpt1) (Figure 2B,C, S2C). The cells expressed MSC markers (Nt5e, Vcam1 and Eng) as well as Grem1, a marker of mouse skeletal stem cells (Worthley et al., 2015) (Figure S2A,C). Other previously proposed MSC markers, such as Thy1, Ly6a and the perivascular MSC markers Nes and NG2 (Cspg4), were not expressed in cluster 1, but were expressed in other clusters. This indicated the potential for MSC activity in other clusters (Figure S2A–C). Our designation of mesenchymal stromal cells does not preclude the functional attributes of mesenchymal stem cells in other stromal populations. Our taxonomy was based on gene expression with annotations of putative functions; current methods do not allow in vivo functional assessment of each cell cluster. Within Lepr-MSCs, we distinguished four subsets (Lepr-MSC-1–4) by subclustering and diffusion trajectory analysis (Angerer et al., 2016) (Figure 2D,E, S2D,E). While Kitl and Angpt1 were comparably expressed in all four subsets, they were distinguished by the expression of Cxcl12, Lepr, Grem1 and multiple other genes (Figure 2F, S2E). In particular, one subset (Lepr-MSC-4) had significantly higher expression of the key functional OLC-specification genes Sp7 (osterix), and Alpl (Huang et al., 2007; Nakashima et al., 2002)) while the OLC-specification gene Runx2 showed no difference between the subclusters (Figure S2E,F), suggesting differentiation towards the osteoblastic lineage, supported by the continuous transition inferred between cells from the Lepr-MSC and OLC-1 clusters in differentiation trajectories (Figure 1G,H). Indeed, OLCs that include osteoprogenitors and mature osteoblasts, can be derived from MSCs (Park et al., 2012; Worthley et al., 2015; Zhou et al., 2014a).
Inferred lineage relations suggest two OLC subsets of different differentiation origins and distinct hematopoietic support potential
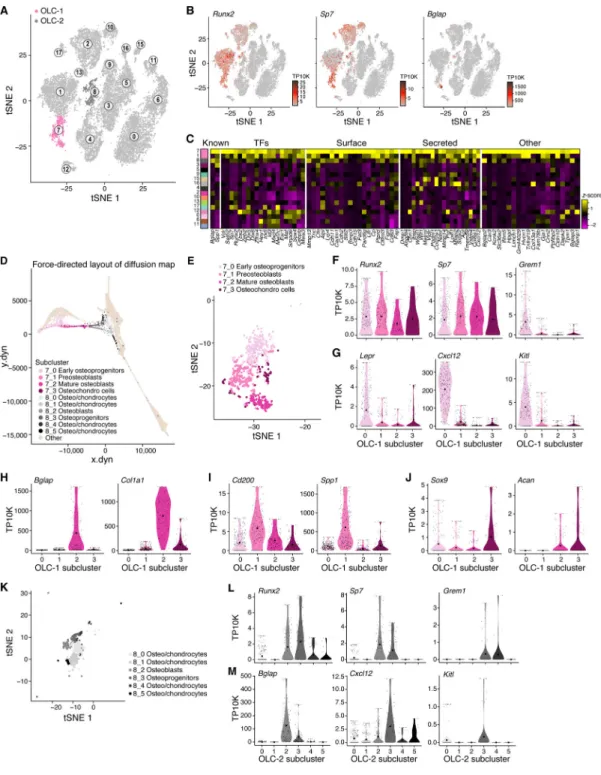
To further analyze osteolineage differentiation, we focused on Lepr-MSC-4, along with cluster 7 (OLC-1) and 8 (OLC-2) (Figure 3A) that expressed the osteoblast maturation marker Bglap (Figure 3B, S3A) (Delmas et al., 1986), and formed a continuum in the diffusion map (Figure 1H). All three clusters differentially expressed Runx2, the master regulator transcription factor (TF) controlling the commitment of MSCs to OLCs (Huang et al., 2007), and both OLC-1 and OLC-2 further expressed Sp7, its downstream target TF, which together are required for early and late osteolineage differentiation (Figure 3B,C,
A
uthor Man
uscr
ipt
A
uthor Man
uscr
ipt
A
uthor Man
uscr
ipt
A
uthor Man
uscr
ipt
S3A). Furthermore, Bglap was expressed in a subset of the clusters’, along with other osteoblastic maturation makers (Alpl, Col1a1, Spp1 and Pth1r (Huang et al., 2007)) (Figure 3B,C, S3B).
Whereas Lepr-MSC-4 consisted of putative committed osteolineage MSCs, the cells in OLC-1 spanned a continuum of osteoblastic states in the diffusion map (Figure 3D,E) and differential gene expression (Figure S3C) analyses, including, in order: (1) early
osteoprogenitors that were in a cell transition-state from Lepr-MSC-4 (Figure 2E and 3D,E), expressing Runx2, Sp7, Grem1, Lepr, Cxcl12 and Kitl (Figure 3F,G, S3C), but not
osteoblast maturation markers (Bglap and Col1a1; Figure 3H); (2) preosteoblasts (e.g. late osteoprogenitors), highly expressing the osteoprogenitor marker CD200 (Abdallah et al., 2015; Chan et al., 2015) and Spp1 (Figure 3I), a marker of later stages of osteoblastic differentiation (Huang et al., 2007), but lowly expressing osteoblast maturation markers (Figure 3H); and (3) mature osteoblasts expressing Bglap and Col1a1 (Figure 3H). In addition, the subcluster included (4) putative chondrocytes expressing low levels of Sox9, a TF essential for chondrocyte differentiation (Foster et al., 1994; Wagner et al., 1994), and Acan, a chondrocyte marker gene (Doege et al., 1991) (Figure 3J).
Remarkably, the OLC-2 (mostly bone origin, Figure 1B (insert)) cells highlighted a distinct subset of OLCs from those found in a continuum from Lepr-MSC-4. Along the continuum spanned by OLC-2 cells (Figure 3D,K, S3D and Table S2) we observed: (1)
Osteoprogenitors (8_3), expressing Runx2, Sp7, Grem1, and Mmp13, the matrix metalloproteinase that regulates the calcification and degradation of cartilage during the endochondral ossification process (Nishimura et al., 2012) (Figure 3L, S3E), but low levels of Bglap and Sox9 (Figure 3M, S3E); (2) Osteoblasts (8_2) expressing OLC markers (Runx2, Sp7, Spp1, Bglap and Pth1r, Figure 3L,M, S3E) and (3) osteo/chondrocytes (8_0, 8_1, 8_4 and 8_5) that appeared to be in the process of being ossified into bone (Yang et al., 2014; Zhou et al., 2014b). Notably, only OLC-1 cells expressed key hematopoietic
regulatory cytokines (albeit 8_3 in OLC-2 expressed relatively low levels Cxcl12) (Figure 3M) suggesting that there were two OLC subsets of distinct differentiation origins and with distinct hematopoietic support potential.
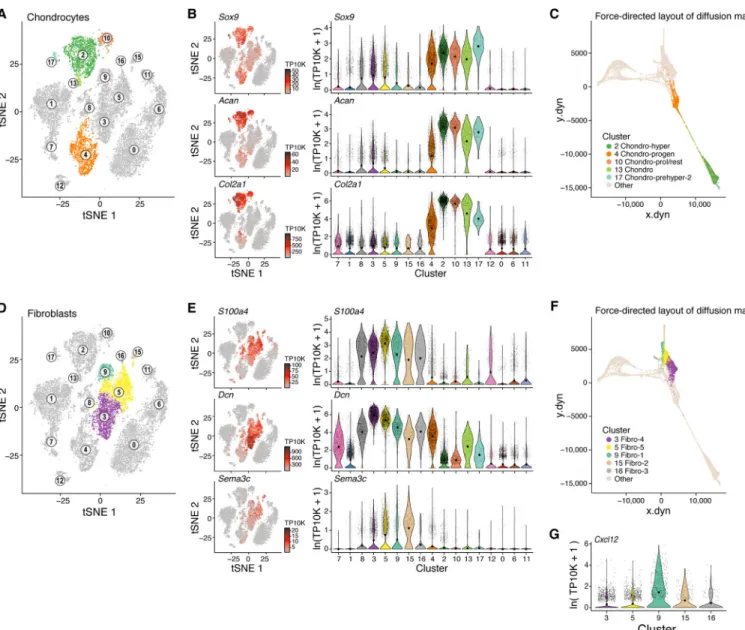
Characterization of chondrocyte cell differentiation
We next examined the differentiation of chondrocytes. Cells in five clusters (Clusters 2, 4, 10, 13, 17) all expressed the chondrocyte lineage genes Sox9, Acan and Col2a1 (Figure 4A,B), formed a sequence in the overall diffusion map (Figure 4C) and distinguished: (1) Proliferating and resting chondrocytes (Cluster 10) expressing Col2a1 (Inada et al., 1999) (Figure 4A,B, S1I); (2) prehypertrophic chondrocytes that started the maturation process (Clusters 2 and 17), co-expressing Ihh, Pth1r (Vortkamp et al., 1996), Mef2c (Arnold et al., 2007) (Figure 4A, S4A–C), (3) hypertrophic chondrocytes (Cluster 2) co-expressing Runx2, Ihh, Mef2c and Col10a1 (Figure 4A, S4A–C) (Arnold et al., 2007); as well as (4) putative chondrocyte progenitor cells (cluster 4) that were in transition into OLC-2 (Figure 4C, 1H) expressing Grem1 (Figure S4B), OLC markers (Runx2, Sp7, Alpl, Spp1) (Figure 3B, S3B) and chondrocyte markers (Sox9, Acan; Figure 4B).
A
uthor Man
uscr
ipt
A
uthor Man
uscr
ipt
A
uthor Man
uscr
ipt
A
uthor Man
uscr
ipt
A fibroblast subset expresses hematopoietic niche regulators
Fibroblasts are cells of mesenchymal origin that are ubiquitous in the bone marrow and consist of phenotypically and functionally distinct subpopulations (Kalluri, 2016). Due to the paucity of distinctive markers and similar morphology and phenotypes, they are commonly confounded in the bone marrow with MSCs and pericytes limiting the accuracy of functional studies (Soundararajan and Kannan, 2018).
Five fibroblasts clusters (3, 5, 9, 15, 16) all highly expressed the fibroblast specific genes Fibronectin-1 (Fn1), S100a4, Decorin (Dcn), and Semaphorin-3C (Sema3c) (Figure 4D,E, S4D) lowly expressed the chondrocyte genes Sox9, Acan, and Col2a1 (Kalluri, 2016) (Figure 4B), and were distinguishable from both Lepr-MSCs and pericytes.
Fibroblasts-1 (cluster 9) and 2s (cluster 15) cells expressed the progenitor marker Cd34 (Figure S1G) and MSC markers (Ly6a, Pdgfra, Thy1 and Cd44; Figure S4D, E), but not BMEC or pericytes genes (Cdh5, Acta2 (Figure 1C)), suggesting these fibroblasts are MSC-like. Fibroblast-1s also expressed Cxcl12 and Angpt1 (Figure 2B, 4G) indicating a possible niche regulatory function that resembles CAFs that facilitate cancer growth and metastasis (Ahirwar et al., 2018; Costa et al., 2018).
Fibroblasts-3 (cluster 16), Fibroblast-4 (cluster 3), and Fibroblast-5 (cluster 5) were
related to tendon/ligament cells. They co-expressed Sox9 (Figure 4B) and the TF Scleraxis (Scx) (Figure S4F) which regulate differentiation of tenocytes and ligamentocytes (Sugimoto et al., 2013). Fibroblast-4 and −5s further expressed key bone and cartilage genes including the Spp1 (Figure S3B) and the chondrocyte genes Nt5e, Cspg4 (Figure S2A, S2B) and Cilp (Figure S4F). The three clusters formed a continuum from Fibroblasts-3s to Fibroblast-4s and −5s (Figure 4F). Thus, fibroblast-3s may be tenocyte progenitors (Sugimoto et al., 2013), whereas Fibroblast-4s and −5s may consist of tendon/ligament cells (Sugimoto et al., 2013).
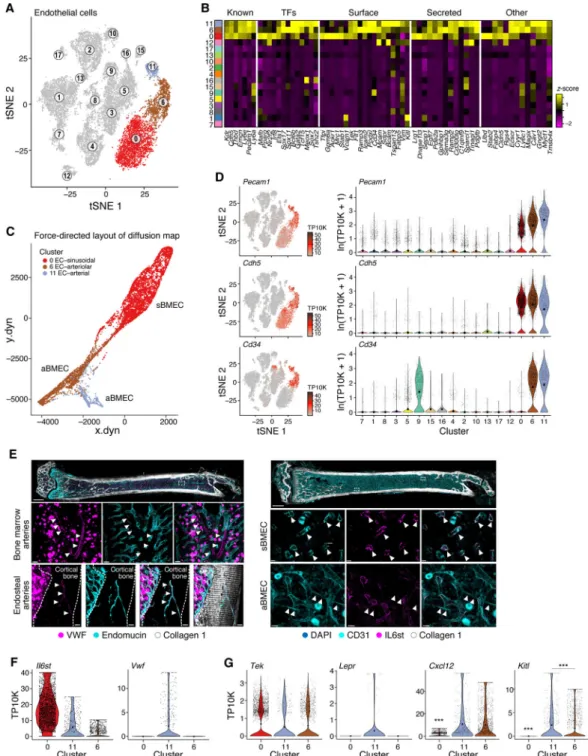
Arterial BMECs express higher levels of niche factors compared to sinusoidal and arteriolar vascular cells
We identified three BMEC subsets each supported by distinct differentially expressed genes (Figure 5A,B, S5B and Table S1): cluster 0 consisted of putative sinusoidal BMECs, cluster 6 of cells from arterioles/capillaries and cluster 11 containing BMECs from endosteal and bone marrow arteries. All subsets were related along a continuum (Figure 5C) and expressed known markers of endothelial cells - Pecam1, Cdh5, Cd34, Kdr, and Emcn (Rafii et al., 2016) (Figure 5B, D). We annotated cluster 0 and 6 cells as sinusoidal and arteriolar BMECs (sBMECs and aBMECs), respectively. Cluster 0 cells had high expression of Flt4 (Vegfr-3) and low expression of Ly6a (Sca-1), while cluster 6 cells had the opposite pattern (Figure S5A). This was consistent with previous reports that sBMECs are Vegfr-3+/Sca-− while arteriolar cells are Vegfr-3−/Sca-1+ (Hooper et al., 2009; Itkin et al., 2016). Bone-marrow imaging was used to determine whether cluster 11 is a subset of aBMECs or sBMCEs. Vwf, expressed exclusively but heterogeneously in cluster 11, stained endosteal and some bone marrow arteries but not sinusoids (Figure 5E,F, S5C) indicating these cells are a subset of aBMECs. Also, Cd34 has been previously associated with aBMECs, not sinusoids, and we
A
uthor Man
uscr
ipt
A
uthor Man
uscr
ipt
A
uthor Man
uscr
ipt
A
uthor Man
uscr
ipt
noted gene expression in clusters 6 and 11, not cluster 0 (Coutu et al., 2017). In contrast, Il6st, predominantly expressed in cluster 0 and not cluster 6 nor 11 (Figure 5F, S5B), exclusively stained bone marrowsinusoids by bone marrow imaging (Figure 5E). Therefore, cluster 11 is a subset of aBMECs.
The three subsets expressed different ligands and secreted factors (Figure 5B). All three expressed the endothelial tyrosine kinase receptor, Tie2 (Tek) for angiopoietin ligands (Figure 5G, S5D). However, Kitl and Cxcl12 were most abundant in aBMECs, and Kitl most highly expressed by cluster 11 when compared with cluster 6 (Wilcoxon rank sum test p-value 6.9×10⁻⁵ and 35% higher average expression per cluster), while sBMECs expressed vastly smaller quantities of either factor (Figure 5G). Differential expression analysis comparing differences between both aBMEC clusters revealed a number of genes
characterizing both clusters (Figure S5E and Table S3), suggesting that arterial BMEC may be a distinctively relevant subpopulation within BMECs, that regulates HSC function as has been previously proposed (Ding et al., 2012; Xu et al., 2018).
Pericyte subpopulations vary in hematopoietic regulatory gene expression
NG2+ and Nestin+ perivascular MSCs, have been proposed as critical regulators of HSC function through production of Cxcl12 and Kitl (Kunisaki et al., 2013; Mendez-Ferrer et al., 2010). Notably, under homeostasis, HSCs reside in perisinusoidal or periarteriolar locations predominantly found in close proximity to Lepr-Cre+ cells, also shown to produce Cxcl12 and Kitl (Acar et al., 2015; Ding et al., 2012; Morrison and Scadden, 2014). However, determining whether NG2+ and Nestin+ perivascular MSCs share developmental origins and functional properties with perivascular Lepr-Cre+ cells has been challenging as there is currently no single marker that separates them (Armulik et al., 2011).
We annotated a distinct cluster of perivascular mesenchymal stromal cells/pericytes (cluster 12; hereafter referred to as Pericytes), by the co-expression of the classical MSC markers Nes, NG2 (Cspg4), and the pericytes markers Acta2, Myh11 and Mcam (Armulik et al., 2011) (Figure 6A–C, S6A). The pericytes differentially expressed Jag1, the Notch signaling ligand, and Il-6, both implicated in promoting HSC maintenance (Bernad et al., 1994; Calvi et al., 2003) (Figure S6C). Notably, cells in this cluster expressed only very low levels of Lepr, in contrast to the high expression of Lepr in Lepr-MSCs (Figure 2B,C). Thus, pericytes and Lepr-MSCs were clearly distinguishable.
Within the pericytes, we identified three subsets (Figure 6D, S6B and Table S2). Pericyte-1 cells, distinguished by relatively higher expression of Cdh2, Lepr and specific expression of MSC marker Ngfr, expressed Kitl most abundantly with low levels of Cxcl12 (Figure 6E,F). Conversely, Pericyte-3 expressed Cxcl12 with minimal Kitl and Pericyte-2 expressed low levels of both suggesting a possible distinction in HSC support. Pericyte-2 and Pericyte-3 had molecular features similar to previously reported periarteriolar cells (NG2-CreER/Nes-GFPhigh (Coutu et al., 2017; Kunisaki et al., 2013)) and perisinusoidal cells (Nes-GFP+ (Mendez-Ferrer et al., 2010)) respectively. Unlike Lepr-MSCs, none of the pericyte subsets expressed high levels of both Cxcl12 and Kitl (Figure 6E,F and 2F). Therefore, while Lepr-MSC, NG2+ and Nes+ cells have each been defined as HSC niche cells, they are molecularly distinct.
A
uthor Man
uscr
ipt
A
uthor Man
uscr
ipt
A
uthor Man
uscr
ipt
A
uthor Man
uscr
ipt
Systemic survey of changes in bone marrow stromal cells induced by emerging primary leukemia
Several bone marrow stromal cell populations that regulate hematopoiesis can when perturbed, lead to niche-initiated myelodysplasia or leukemia in animal models (Arranz et al., 2014; Dong et al., 2016; Kode et al., 2014; Raaijmakers et al., 2010). Moreover, myeloid malignancies can remodel their niche to support malignant growth (Hanoun et al., 2014; Schepers et al., 2013; Schmidt et al., 2011).
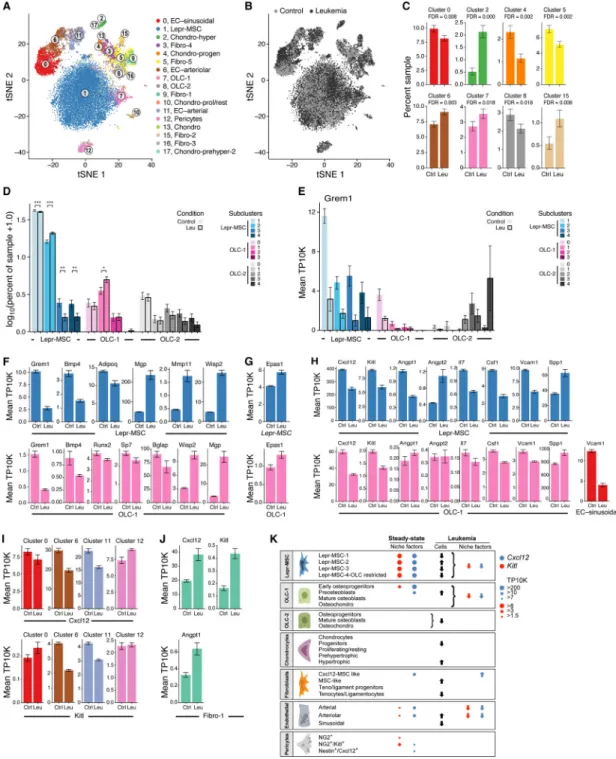
To comprehensively assess changes in the stroma during malignant growth, we compared (Corral et al., 1996) stromal cell scRNAseq from mice with normal or MLL-AF9-knocked-in bone marrow transplanted 6–10 months before analysis (Figure 7A,B, S7A–D, Table S1).
Remodeling of bone marrow stromal cell proportions in leukemia
We detected significant changes in the proportions of key subsets in leukemia. These often reflected coupled effects in OLCs (increase in OLC-1, reduction in OLC-2), BMECs (reduction in sBMECs, increase in cluster 6 aBMECs), chondrocytes (increase in cluster 2, decrease in 4) and fibroblasts (decrease in Fibroblast-5s, increase in Fibroblast-2s) (Figure 7C, S7E).
The shift in OLCs was consistent with previous studies of leukemia, where OLC lineage dysfunction is caused by leukemia cells and favorable for their growth (Duarte et al., 2018; Frisch et al., 2012; Hawkins et al., 2016; Krevvata et al., 2014; Schepers et al., 2013). Moreover, proportions also varied within the OLC-1 subset with a significant increase in preosteoblasts (subcluster 1), but not in other cells (Figure 7D). While the overall proportion of Lepr-MSCs was unchanged, the relative proportions within were impacted by leukemia with significant increase in subcluster 2 and a concomitant reduction in subcluster 3 and 4 (committed osteolineage Lepr-MSCs) (Figure 7D, S7E). Overall, the concomitant decrease in committed osteolineage Lepr-MSCs and increase in preosteoblasts suggests that leukemia induced a block in osteolineage development (Hanoun et al., 2014; Kumar et al., 2018). The changes observed in Lepr-MSCs and OLCs, as well as BMECs, were consistent with the reported abnormalities seen in AML patients where leukemia induces vasculature remodeling that is accompanied by reduced osteocalcin (Bglap) serum levels, growth deficiency and impaired osteogenesis (Duarte et al., 2018; Geyh et al., 2016; Kumar et al., 2018; Passaro et al., 2017).
Leukemia compromises osteogenic and adipogenic differentiation pathways in Lepr-MSCs and OLCs
Analyzing changes in intrinsic gene programs within each cluster highlighted blunted adipogenic and osteogenic differentiation programs in Lepr-MSCs and OLCs (Figure S7F– G, Table S4). Cells in both clusters downregulated Grem1 (Worthley et al., 2015), across all Lepr-MSC subclusters and in early osteoprogenitors (subcluster 0) (Figure 7E) as well as the BMP pathway, including Bmp4 (GSEA (Subramanian et al., 2005) (GSEA qval=0.027, Table S4) (Wozney et al., 1988) and the early OLC-specification gene Sp7 (Figure 7F). Mature osteoblasts within OLCs further downregulated Runx2, an early marker of osteogenesis, and Bglap1-3, late markers of osteogenesis (Lee et al., 2007) (Figure 7F,
A
uthor Man
uscr
ipt
A
uthor Man
uscr
ipt
A
uthor Man
uscr
ipt
A
uthor Man
uscr
ipt
Figure S7F). Lepr-MSC cells further downregulated Adipoq (Figure 7F, Figure S7F) (Bauche et al., 2007) and other genes in the white adipocyte differentiation (GSEA qval=0.029, Table S4), and the PPAR signaling pathways (GSEA qval=0.022, Table S4) (Tontonoz et al., 1994). This was consistent with reports that AML induces a compromised adipocytic niche that leads to imbalanced stem and progenitor regulation and not favorable for normal blood cell production (Boyd et al., 2017). Furthermore, Wisp2, which has been implicated in restricting MSCs to an undifferentiated state (Grunberg et al., 2014;
Hammarstedt et al., 2013) was upregulated in all Lepr-MSC subsets and OLC progenitors (subcluster 0 and 1) (Figure S7F,I) further supporting compromised differentiation of Lepr-MSCs and OLCs. Conversely, key genes that inhibit bone formation and calcification were induced in Lepr-MSCs and OLCs (and others) including Mgp (inhibits calcification (Luo et al., 1997)), Igbfp5 and Igfbp3 (negative regulators on bone formation (Kanatani et al., 2000; Silha et al., 2003), and genes in the ECM degradation pathway (GSEA qval=0.04, Table S4) including Mmp2, Mmp11 and Mmp13 (Figure 7F, S7G). Taken together, these data are consistent with AML inducing alterations that affect bone formation and breakdown. The cell profiles further support a model where hypoxia contributes to the undifferentiated state of the MSCs and OLCs (Kim et al., 2009). Hypoxia pathway genes (GSEA qval=0.004, Table S4) were induced in MSCs and OLCs, including the key regulator Hif-2a (Epas1), but not Hif-1a (Figure 7G, S7H,J), consistent with reports that suppression of bone formation and osteoblast activity is directly linked to Hif-2a and not Hif-1a (Rauner et al., 2016). Notably, the Wisp2 promoter is regulated by Hif-2a (Fuady et al., 2014).
Leukemia broadly impairs normal hematopoiesis-regulatory gene expression
The changes in the stroma may contribute to altered support of normal blood cell growth through deregulation of the expression of key HSC niche factors, especially Cxcl12 and Kitl across Lepr-MSCs, cluster 6 and 11 aBMECs and the earliest OLCs (subcluster 0) (Figure 7H,I); conversely, Cxcl12, Kitl and Angpt1 were upregulated in Fibroblast-1s (Figure 7J). These findings are consistent with prior observations of AML reducing HSC persistence and localization to the bone marrow (Zhang et al., 2012) and that Cxcl12-secreting-CAFs (similar to Fibroblast-1s) are associated with a cancer promoting phenotype in breast cancer (Ahirwar et al., 2018; Costa et al., 2018).
Among other factors, Spp1, a negative regulator of HSC pool size (Stier et al., 2005) and HSC proliferation (Nilsson et al., 2005), which is correlated with poor prognosis in AML patients (Chen et al., 2017), was upregulated in Lepr-MSCs, OLCs, BMECs, fibroblasts and pericytes (Figure 7H, S7F). Lepr-MSCs downregulated other HSC niche factors including Angpt1, an agonist of Tek receptor expressed on BMECs and HSCs (Arai et al., 2004) (and upregulated its antagonist Angpt2 (Gomei et al., 2010)), factors that promote lymphoid (Il7) (Muegge et al., 1993; Namen et al., 1988) or myeloid (Csf1) differentiation (Mossadegh-Keller et al., 2013), and Vcam1, a regulator of HSC homing to bone marrow
(Papayannopoulou et al., 1995) (Figure 7H). Thus, the osteogenic differentiation block induced by leukemia in Lepr-MSCs and OLCs, was further accompanied by a loss of HSC niche factor production by multiple cell types.
A
uthor Man
uscr
ipt
A
uthor Man
uscr
ipt
A
uthor Man
uscr
ipt
A
uthor Man
uscr
ipt
DISCUSSION
While it is now well appreciated that non-parenchymal cells in the stroma of a tissue play key physiological roles in forming niche cells (Calvi et al., 2003; Zhang et al., 2003), the full repertoire of cells that comprise stroma has remained elusive in all complex adult tissues, including the bone marrow. Here, we systematically characterize the stroma of the mouse bone and bone marrow into six broad cell types with 17 cell subsets, with discrete
distinctions, differentiation continuums and HSC niche regulatory function often disrupted by the emergence of leukemia (Figure 7K). Note that a complementary analysis of bone marrow stroma using scRNA-seq has been published, after this manuscript was accepted in principle (Tikhonova et al., 2019), which focused on several cell subpopulations pre-sorted by pre-defined markers and on a stress model.
These findings provide a clear set of definitions and tools, including refined understanding of the relation between markers and cell types (and their limitations), clarify prior
controversies, and lead to several unexpected observations. Here we highlight some of these key findings.
First, OLCs segregated into two subsets that appear to arise from distinct lineage trajectories. Only one of these, which emerges from Lepr-MSCs, expresses high HSC regulatory genes and does so at the early osteoprogenitor stage of development.
Second, one of the five fibroblasts subsets we identified, expressed Cxcl12.
Cxcl12-expressing fibroblasts have been implicated in aggressive solid tumors (Ahirwar et al., 2018; Costa et al., 2018). We thus hypothesize that they may participate in bone metastases; future studies can test this possibility.
Third, BMECs consisted of a distinctive artery subset that was enriched for expression of hematopoietic regulators. This cell population was apparent in a periendosteal location and bone marrow and was in marked contrast to the large sinusoidal endothelium subset that minimally expressed the HSC niche factors, Cxcl12 and Kitl, despite prior reports that peri-sinusoidal positioning of HSC is common (Acar et al., 2015).
Fourth, we clarified that Lepr+ cells are common across multiple cell types, including osteolineage, endothelial, pericyte and fibroblastic cells. Thus, the use of Lepr-driven Cre to alter particular genes could impact their expression across many cell types, and must be interpreted with extreme care, especially where Lepr-Cre is expressed throughout
development, as commonly done to date (Zhou et al., 2014a). We further showed that there was discordant expression of Cxcl12 and Kitl among pericyte subpopulations that segregated with low level Lepr, NG2 (Cspg4) and Nes expression. Future studies can assess if these reflect functional distinctions in hematopoietic support, and how this subpopulation tracks with periarteriolar, quiescent HSCs (Kunisaki et al., 2013).
Finally, the presence of AML distorted the stromal compartment in select and specific ways. Osteogenic differentiation blockade occurs in Lepr-MSCs and OLCs, is accompanied by a cell intrinsic bone remodeling phenotype and disturbed production of hematopoietic regulatory factors that affect normal hematopoiesis. While most studies show that osteoblast
A
uthor Man
uscr
ipt
A
uthor Man
uscr
ipt
A
uthor Man
uscr
ipt
A
uthor Man
uscr
ipt
numbers are either reduced (Frisch et al., 2012; Krevvata et al., 2014; Kumar et al., 2018) or increased (Hanoun et al., 2014; Schepers et al., 2013), depending on type of leukemia model used, our study supports a loss of bone maturation phenotype and function. A parenchymal tumor affecting the maturation of tissue stromal cells does suggest a distinct type of cross-interaction between emerging cancer cells and their mesenchymal neighbors. It may be that differentiation blockade is not restricted in a cell autonomous manner to cancer cells, but may extend to the broader cell context of a cancerous tissue. These findings are consistent with a model where emerging cancer cells influence the stromal cells in the tissue they inhabit. They can alter differentiation patterns of those stromal cells, changing the complexity of cell types that are thought to play critical roles in governing tissue homeostasis. Furthermore, the malignant cells in our study reduced the expression of regulatory signaling molecules known to be essential for normal hematopoietic function. In so doing, the malignant cells create a microenvironment no longer as conducive to normal hematopoietic cell production and, thereby, impairing the parenchymal cells with which they compete. These data provide experimental support for a paradigm in which the
establishment of a malignant clone within a tissue shapes the features of the stromal
landscape of that tissue. The result compromises stromal cell support of normal parenchymal cells, fundamentally altering the competitive landscape of the tissue to disadvantage normal cells. In this way, cancer cells act not as fully independent and destructive rogues, but rather as self-serving architects of their neighborhood pushing out normal occupants by creating a less supportive environment.
Our stroma cell census will now allow a clearer and more consistent definition of the ways in which specific stromal cells contribute to homeostasis and aberrant hematopoiesis, and provide a foundation for developing stromal-targeted therapies in hematologic disease. It also offers experimental evidence for tumor evolution in which cross-communication between parenchymal and stromal elements may influence the emergence of cancer.
STAR METHODS
Contact for Reagent and Resource Sharing
Further information and requests for resources and reagents should be directed to and will be fulfilled by the lead contact David Scadden (david_scadden@harvard.edu).
Experimental models
Mice—The MLL-AF9 knock-in mice (Corral et al., 1996) and CD45.1 (STEM) mice (Mercier et al., 2016) were described previously. Littermates were used as controls for all experiments involving MLL-AF9 knockin and CD45.1 (STEM) mice. Male C57BL/6 mice (CD45.2, Jackson Laboratory) at age 6–8 weeks were employed as transplant recipients and for steady-state scRNA-seq experiments. All animal experiments were performed in accordance with national and institutional guidelines. Mice were housed in the
Massachusetts General Hospital (MGH) Animal Research Facility on a 12 hour light/dark cycle with stable temperature (22° C) and humidity (60%). All procedures were approved by MGH Internal Animal Care and Use Committee.
A
uthor Man
uscr
ipt
A
uthor Man
uscr
ipt
A
uthor Man
uscr
ipt
A
uthor Man
uscr
ipt
Generation of leukemic mice—To generate leukemic mice, we first crossed the MLL-AF9 knock-in mice (Corral et al., 1996) with the CD45.1 (STEM) mice (Mercier et al., 2016) to generate donor chimeric CD45.1.2 mice. Mice positive for the MLL-AF9 fusion transgene were used as donors (male, 4 weeks of age), and littermates (male, 4 weeks of age) negative for the MLL-AF9 fusion transgene were used as controls. Mice were sacrificed via CO2 asphyxia; tibiae and femurs were harvested and excess soft tissue was eliminated.
Bones were crushed and washed in PBS and passed through a 70μm filter into a collection tube and 1×10⁶ whole bone-marrow cells were transplanted by retro-orbital injection into 6– 8 weeks old male CD45.2 C57BL/6 recipient mice. One day prior to transplantation, mice were subjected to whole body irradiation (2 × 6Gy) with a 6-hour interval from a 137Cs source. Monthly retro-orbital bleeding was performed on isoflurane anesthetized mice and blood was withdrawn using heparinized capillaries and collected into EDTA containing tubes to prevent coagulation. Complete blood counts were done using the Element Ht5 Auto Hematology analyzer. Subsequently, RBCs were lysed as described previously and cells were stained in PBS, 2% FBS using the following antibodies: CD45.2-APCCy7 (Biolegend, Ref#109824, clone 102), CD45.1-FITC (Biolegend, Ref# 110706, clone A20), CD11b-Alexa Fluor 700 (Biolegend, Ref# 101222, clone M1/70), GR1-Brilliant violet 570
(Biolegend, Ref#108431, clone RB6-8C5), B220-eFluor450 (eBioscience, Ref#48-0452-82, clone RA3-6B2), and CD3e-APC (eBioscience, Ref#17-0031-83, clone 145-2c11), in addition to 7-Aminoactinomycin D (7AAD; ThermoFisher Scientific, Ref#A1310) for viability to monitor donor chimerism within the different lineages and the appearance of leukemic blasts characterized by a distinct scatter and lower GR1 and CD11b expression within the myeloid compartment. Leukemic mice were determined by the combination of disease symptoms, white blood cell counts and appearance of leukemic blasts.
Methods details
Isolation of bone marrow stroma cells—To obtain bone and bone marrow stromal cells for scRNA-seq, mice were sacrificed via CO2 asphyxia. Bones (femur and tibia) were
harvested and placed in Media 199 (ThermoFisher Scientific, Ref#12350039) supplemented with 2% Fetal Bovine Serum (FBS, ThermoFisher Scientific, Ref#10082147). Muscle and tendon tissue was removed and bone marrow was flushed. Stromal cells from the bone marrow fraction were isolated by digestion with 1 mg/mL STEMxyme1 (Worthington, Ref#LS004106) and 1 mg/mL Dispase II (ThermoFisher Scientific, Ref#17105041), in Media 199 supplemented with 2% FBS for 25 min at 37°C. Stromal cells from the bone fraction were isolated by gently crushing and cutting bones (including epiphysis) into small fragments and digested in the same digestion mix as the bone marrow for 25 min, at 37°C with agitation (120 rpm). After digestions, both fractions were filtered through a 70μm filter into a collection tube (Fisher Scientific, Ref#08–771–2), pooled into one sample or run separately (e.g. for bone vs. bone marrow fraction scRNA-seq analysis), and erythrocytes lysed in ACK-lysis buffer (ThermoFisher Scientific, Ref#A1049201) for 5 minutes on ice. Cells were then stained in Media 199 supplemented with 2% FBS for FACS cell sorting.
FACS enrichment of bone marrow stromal cells—For flow cytometry and FACS, cells were resuspended in Media 199 supplemented with 2% FBS and stained for Ter119-APC (eBioscience, Ref#17–5921–82, clone TER–119), CD71-PECy7 (Biolegend,
A
uthor Man
uscr
ipt
A
uthor Man
uscr
ipt
A
uthor Man
uscr
ipt
A
uthor Man
uscr
ipt
Ref#113812, clone RI7217), CD45-PE (eBioscience, Ref#12–0451–82, clone 30–F11), CD3-PE (Biolegend, Ref#100206, clone 17A2), B220-PE (Biolegend, Ref#103208, clone RA3–6B2), CD19-PE (Biolegend, Ref#115508, clone 6D5), Gr-1-PE (Biolegend, Ref#108408, clone RB6–8C5), and Cd11b-PE (Biolegend, Ref#101208, clone M1/70) for 30 minutes on ice. Dead cells and debris were excluded by FSC, SSC, 7-AAD
(ThermoFisher Scientific, Ref#00–6993–50) and Calcein AM (ThermoFisher Scientific, Ref#C3099) profiles. FACS and cytometry was performed on a BD FACSAria II sorter, and sorted bone marrow stromal cells were collected in Media 199 supplemented with 2% FBS and 0.4% UltraPure BSA (ThermoFisher Scientific, Ref#AM2616). Bone marrow stroma was enriched by sorting of live cells (7-AAD-/Calcein+) negative for erythroid (CD71/ Ter119) and immune lineage markers (CD45/CD3/B220/CD19/Gr-1/CD11b). For flow cytometric analysis (e.g. Figure S1K), we used Ly6a/Sca-1 (Biolegend, Ref#108127, clone), CD31 (Pecam1) (BD Bioscience, Ref#565097), Vcam1 (Biolegend, Ref#105710), CD34 (eBioscience, Ref#11–0341–82), Cdh5/CD144 (Biolegend, Ref#138006)
Immunostaining of bone marrow sections—Tissue preparation, immunostaining and imaging of full-bone femoral sections was performed as previously described (Coutu et al., 2018). Briefly, bones were fixed overnight in 4% paraformaldehyde and decalcified using 10% ethylenediaminetetraacetic acid (EDTA, pH=8) for two weeks. Longitudinal bone sections were stained overnight at RT with primary [anti-CD31 (goat, R&D, Ref#AF3628), anti-IL6st (rat, eBiosciences, Ref#17–1302–82), anti-collagen type I (rabbit, Cedarlene, Ref#CL50151AP), anti-von Willenbrand factor (rabbit, Thermo Scientific, Ref#RB–281– AO), anti-Endomucin (rat, eBiosciences, Ref#14–5851–82)] and secondary antibodies (CF488, CF555, CF633 and CF680, Biotium). Detection of IL6st was performed by biotin-streptavidin CF555 amplification. Sections were then optically cleared using graded series of 2,2-thiodiethanol (TDE, Sigma).
Full-bone imaging was performed on a Leica TCS SP8 confocal microscope equipped with two photomultiplier tubes, three HyD detectors and three laser lines (405-nm blue diode, argon and white light) using type F immersion liquid (RI: 1.518) and 20× multiple
immersion objective (NA 0.75, FWD 0.680 mm). Images were acquired at 8-bit, 400 Hz and 1024×1024 or 2048×2048 resolution with 2.49 μm z-spacing.
Single cell RNA-seq—Single cells were encapsulated into emulsion droplets using Chromium Controller (10× Genomics). scRNA-seq libraries were constructed using Chromium Single Cell 3’ v2 Reagent Kit according to the manufacturer’s protocol. Briefly, post sorting sample volume was decreased and cells were examined under a microscope and counted with a hemocytometer. Cells were then loaded in each channel with a target output of ~4,000 cells. Reverse transcription and library preparation were performed on C1000 Touch Thermal cycler with 96-Deep Well Reaction Module (Bio-Rad). Amplified cDNA and final libraries were evaluated on a Agilent BioAnalyzer using a High Sensitivity DNA Kit (Agilent Technologies). Individual libraries were diluted to 4nM and pooled for
sequencing. Pools were sequenced with 75 cycle run kits (26bp Read1, 8bp Index1 and 55bp Read2) on the NextSeq 500 Sequencing System (Illumina) to ~70–80% saturation level.
A
uthor Man
uscr
ipt
A
uthor Man
uscr
ipt
A
uthor Man
uscr
ipt
A
uthor Man
uscr
ipt
Quantification and Statistical Analysis
Pre-processing of scRNA-seq data—ScRNA-Seq data were demultiplexed, aligned to the mouse genome, version mm10, and UMI-collapsed with the Cellranger toolkit (version 2.0.1, 10× Genomics). We excluded cells with fewer than 500 detected genes (where each gene had to have at least one UMI aligned). Gene expression was represented as the fraction of its UMI count with respect to total UMI in the cell and then multiplied by 10,000. We denoted it by TP10K – transcripts per 10K transcripts.
Dimensionality reduction—We performed dimensionality reduction using gene expression data for a subset of variable genes. The variable genes were selected based on dispersion of binned variance to mean expression ratios using FindVariableGenes function of Seurat package (Satija et al., 2015) followed by filtering of cell-cycle, ribosomal protein, and mitochondrial genes. Next, we performed principal component analysis (PCA) and reduced the data to the top 50 PCA components (number of components was chosen based on standard deviations of the principal components – in a plateau region of an “elbow plot”).
Clustering and sub-clustering—We used graph-based clustering of the PCA reduced data with the Louvain Method (Blondel et al., 2008) after computing a shared nearest neighbor graph (Satija et al., 2015). We visualized the clusters on a 2D map produced with t-distributed stochastic neighbor embedding (t-SNE) (Maaten and Hinton, 2008). For sub-clustering, we applied the same procedure of finding variable genes, dimensionality reduction, and clustering to the restricted set of data (usually restricted to one initial cluster).
Differential expression of gene signatures—For each cluster, we used the Wilcoxon Rank-Sum Test to find genes that had significantly different RNA-seq TP10K expression when compared to the remaining clusters (paired tests when indicated) (after multiple hypothesis testing correction). As a support measure for ranking differentially expressed genes we also used area under receiver operating characteristic (ROC) curve.
Filtering hematopoietic clusters and doublets—Based on cluster annotations with characteristic genes, we removed hematopoietic clusters from further analysis. It is further expected that a small fraction of data should consist of cell doublets (and to an even lesser extent of higher order multiplets) due to co-encapsulation into droplets and/or as occasional pairs of cells that were not dissociated in sample preparation. Therefore, when we found small clusters of cells expressing both hematopoietic and stromal markers we removed them from further analysis (original cluster 14). A small number of additional clusters and subclusters was marked by genes differentially expressed in at least two larger stromal clusters and were annotated as doublets if their average number of expressed genes was higher than the averages for corresponding suspected singlet cluster sources and/or they were not characterized by specific differentially expressed genes (original clusters 18 and 19). All marked doublets were removed from further analysis.
Impact of dissociation on clustering—We checked the possible impact of dissociation by several analyses. First, we re-ran the clustering of our data set but after removing the known dissociation artifact genes (van den Brink et al., 2017) from the data matrix. We did
A
uthor Man
uscr
ipt
A
uthor Man
uscr
ipt
A
uthor Man
uscr
ipt
A
uthor Man
uscr
ipt
not observe substantial clustering changes in this approach. Specifically, the number of clusters remained the same and 98% of cell pairs had the same cluster assignment. Second, we performed binning of cells into “clusters” based on the expression of only dissociation signature scores (with the same bin sizes as the real clusters): the adjusted random index between our full clustering and this binning was 0.009 (for equivalent clustering the value is 1). This indicated that our global clustering was not driven by the dissociation signature expression. Third, we repeated this test for clusters that were further subclustered. The values were: 0.242 (Lepr-MSC, cluster 1), 0.006 (OLC-1, cluster 7), 0.027 (OLC-2, cluster 8), and 0.024 (Perictyes, cluter 12). This indicated that only the subclustering of Lepr-MSC cells was possibly partially correlated with dissociation signature or other biological processes with correlated signatures (we note that immediate early gene expression is the main feature of the “dissociation signature” and can also be a biological phenomenon). For visual clarity we show in Figure S1J the expression of the dissociation signature score (Tirosh et al., 2016) across a tSNE plot of our cells.
Estimation of proliferation status—To score cells for their relative proliferation status, we used a set of characteristic genes involved in cell-cycle (Kowalczyk et al., 2015). For each cell we computed the average expression (TP10K) of cell-cycle genes as a proxy for proliferation status.
Diffusion maps computation and visualization—We performed non-linear dimensionality reduction of scRNA-seq data by restricting a sparse diffusion matrix of expression data to the eigenspace spanned by eigenvectors corresponding to the top diffusion matrix eigenvalues. We used the destiny package (Angerer et al., 2016)), where we used the local estimation of Gaussian kernel width, and the number of nearest neighbors for diffusion matrix approximation was set to the smaller value between the square root of the number of all single cells in the data and 100. The diffusion matrix was constructed on sets of variable genes computed with the same procedure as the one used for clustering and sub-clustering of the data, such that variable genes were re-computed for each diffusion map.
We visualized diffusion maps following the approach described in (Schiebinger et al., 2017). Specifically, we built a nearest-neighbor graph in the projected space using an
implementation of k-NN algorithm from the package FNN (Beygelzimer et al., 2015), and thencomputed a force-directed layout using ForceAtlas2 (Jacomy et al., 2014) from the Gephi package (Bastian et al., 2009).
Connectivity of cell clusters—We quantified the connectivity of single-cell clusters using the partition based graph abstraction method PAGA (Wolf et al., 2017a), a part of the single-cell analysis package Scanpy (Wolf et al., 2018). The computations were carried out on the same subset of variable genes as for clustering, using default parameters.
Cell identity assignment in the leukemia data—For scRNA-seq data from control and leukemic mice, we removed hematopoietic cells from the data as described above, and assigned cell types/identities to each cell using differential expression signatures derived from steady state data. Specifically, we collected up to 50 top, most differentially expressed genes (Table S1) in each of the 20 original clusters from the homeostasis data set as
A
uthor Man
uscr
ipt
A
uthor Man
uscr
ipt
A
uthor Man
uscr
ipt
A
uthor Man
uscr
ipt
signatures. For each candidate cell, we computed its signature scores for ach of the 20 signatures. Each signature score was computed against a background gene set of randomly selected genes. A cell was assigned to the cell-type/cluster with the best signature score. When assigning the cluster identity, we further scored against signature genes of sub-clusters (Table S2) that consisted of up to 20 most differentially expressed sub-cluster genes.
Changes in cluster sizes in leukemia data—For each cluster, we used the Wald test to quantify the association of condition (control, leukemia) with binomial models.
Specifically, for each sample, we collected numbers of cells belonging to a given cluster and the number of cells outside of the cluster. Then we fit a generalized linear model with binomial parameters to the combined data with and without a parameter indicating condition (control, leukemia). We used an R implementation of Wald test to assess the statistical significance of the difference between the two models. Finally, we corrected the Wald test p-values from all clusters for multiple-hypothesis testing (Benjamini and Hochberg, 1995).
Differential expression in leukemia data—We observed some contamination of single cell data likely due to ambient RNA. Therefore, prior to computing differentially expressed genes between leukemia and control, we filtered out those genes that were differentially expressed in the hematopoietic contingent of the data when compared with the stromal contingent. The filtered genes were identified separately in leukemia and control conditions, since their respective hematopoietic contingents are known to be different. Specifically, this was achieved by computing differentially expressed genes using Bonferroni corrected Wilcoxon Sum-Rank Test as implemented in FindAllMarkers function (default parameters) of the Seurat package and excluding genes from hematopoietic clusters with adjusted p-values < 0.05.
Then, separately for each cluster, we computed genes that were differentially expressed between leukemia and control in two ways. First, we used Bonferroni corrected Wilcoxon Rank-Sum Test (using FindMarkers of Seurat package, logfc.threshold=ln(1.2)) to discover differentially expressed genes between conditions. Second, for each cluster, we computed average TP10K expression of cells in every replicate. Then, we used those values in a t-test to assess differences between leukemia and control conditions. This approach mimics bulk RNA-seq measurements. The second approach, although less powerful for discovery of differentially regulated genes, helped us to identify genes that tended to be coherently regulated in samples.
Gene set enrichment analysis—We used Gene Set Enrichment Analysis (GSEA) with MSigDB (Subramanian et al., 2005) gene sets to identify pathways and cellular states having induced or repressed expression in each cell cluster. Specifically, we used the pre-ranked analysis mode, with gene transcripts ranked according to differential expression analysis results (Wilcoxon Runk-Sum Test) of comparing leukemic and control conditions in each cluster. The most significantly over-expressed genes were placed at the top of the ranked list, while the most under-expressed were at the bottom before running the test.
Classify cells as having bone marrow origin—We used additional sequencing data samples from bone and bone marrow, together with a supervised classification strategy to
A
uthor Man
uscr
ipt
A
uthor Man
uscr
ipt
A
uthor Man
uscr
ipt
A
uthor Man
uscr
ipt
determine tissue origin of cells in our original data set. Specifically, we trained a multi-class Random Forest (RF) classifier using the R package “randomForest” (Liaw and Wiener, 2002) on a dataset combining cells from bone and bone marrow, clustered separately. The RF classifier was trained on the subset of variable genes (determined with Seurat package) from all data sets, using 5000 trees. The number of training cells per cell cluster was sampled to a min of 70% of cluster size or 1000. The remaining cells comprised the test set and were predicted with an accuracy of 93.1%. The RF model was then used to predict the cluster of origin of every cell in our data set. Lineage identity was assigned based on lineage origin of predicted cell class.
Supplementary Material
Refer to Web version on PubMed Central for supplementary material.
ACKNOWLEDGMENTS
N.B. was funded by the Swedish Research Council and The Childhood Cancer Foundation in Sweden. M.S.K. was supported by Charles A. King Trust Postdoctoral Research Fellowship Program and the Simeon J. Fortin Charitable Foundation. Work was supported by the Klarman Cell Observatory and HHMI (A.R.), NIH DK107784 and the Gerald and Darlene Jordan Professorship (D.T.S.). We thank professor Henry Kronenberg for helpful comments, Leslie Gaffney and Anna Hupalowska for helping with figures, and Carl de Boer, Christopher Smillie, Adam Haber, Joshua Gould and Bo Li for additional help.
REFERENCES
Abdallah BM, Al-Shammary A, Skagen P, Abu Dawud R, Adjaye J, Aldahmash A, and Kassem M (2015). CD34 defines an osteoprogenitor cell population in mouse bone marrow stromal cells. Stem cell research 15, 449–458. [PubMed: 26413784]
Acar M, Kocherlakota KS, Murphy MM, Peyer JG, Oguro H, Inra CN, Jaiyeola C, Zhao Z, Luby-Phelps K, and Morrison SJ (2015). Deep imaging of bone marrow shows non-dividing stem cells are mainly perisinusoidal. Nature 526, 126–130. [PubMed: 26416744]
Ahirwar DK, Nasser MW, Ouseph MM, Elbaz M, Cuitino MC, Kladney RD, Varikuti S, Kaul K, Satoskar AR, Ramaswamy B, et al. (2018). Fibroblast-derived CXCL12 promotes breast cancer metastasis by facilitating tumor cell intravasation. Oncogene.
Angerer P, Haghverdi L, Buttner M, Theis FJ, Marr C, and Buettner F (2016). destiny: diffusion maps for large-scale single-cell data in R. Bioinformatics 32, 1241–1243. [PubMed: 26668002]
Arai F, Hirao A, Ohmura M, Sato H, Matsuoka S, Takubo K, Ito K, Koh GY, and Suda T (2004). Tie2/ angiopoietin-1 signaling regulates hematopoietic stem cell quiescence in the bone marrow niche. Cell 118, 149–161. [PubMed: 15260986]
Armulik A, Genove G, and Betsholtz C (2011). Pericytes: developmental, physiological, and pathological perspectives, problems, and promises. Developmental cell 21, 193–215. [PubMed: 21839917]
Arnold MA, Kim Y, Czubryt MP, Phan D, McAnally J, Qi X, Shelton JM, Richardson JA, Bassel-Duby R, and Olson EN (2007). MEF2C transcription factor controls chondrocyte hypertrophy and bone development. Developmental cell 12, 377–389. [PubMed: 17336904]
Arranz L, Sanchez-Aguilera A, Martin-Perez D, Isern J, Langa X, Tzankov A, Lundberg P, Muntion S, Tzeng YS, Lai DM, et al. (2014). Neuropathy of haematopoietic stem cell niche is essential for myeloproliferative neoplasms. Nature 512, 78–81. [PubMed: 25043017]
Bastian M, Heymann S, and Jacomy M (2009). Gephi: an open source software for exploring and manipulating networks. Icwsm 8, 361–362.
Bauche IB, El Mkadem SA, Pottier AM, Senou M, Many MC, Rezsohazy R, Penicaud L, Maeda N, Funahashi T, and Brichard SM (2007). Overexpression of adiponectin targeted to adipose tissue in
A
uthor Man
uscr
ipt
A
uthor Man
uscr
ipt
A
uthor Man
uscr
ipt
A
uthor Man
uscr
ipt
transgenic mice: impaired adipocyte differentiation. Endocrinology 148, 1539–1549. [PubMed: 17204560]
Benjamini Y, and Hochberg Y (1995). Controlling the false discovery rate: a practical and powerful approach to multiple testing. Journal of the royal statistical society Series B (Methodological), 289–300.
Bernad A, Kopf M, Kulbacki R, Weich N, Koehler G, and Gutierrez-Ramos JC (1994). Interleukin-6 is required in vivo for the regulation of stem cells and committed progenitors of the hematopoietic system. Immunity 1, 725–731. [PubMed: 7895162]
Beygelzimer A, Kakadet S, Langford J, Arya S, Mount D, Li S, and Li MS (2015). Package ‘FNN’. Accessed June 1.
Blondel VD, Guillaume J-L, Lambiotte R, and Lefebvre E (2008). Fast unfolding of communities in large networks. Journal of statistical mechanics: theory and experiment 2008, P10008.
Boyd AL, Reid JC, Salci KR, Aslostovar L, Benoit YD, Shapovalova Z, Nakanishi M, Porras DP, Almakadi M, Campbell CJV, et al. (2017). Acute myeloid leukaemia disrupts endogenous myelo-erythropoiesis by compromising the adipocyte bone marrow niche. Nature cell biology 19, 1336– 1347. [PubMed: 29035359]
Butler JM, Nolan DJ, Vertes EL, Varnum-Finney B, Kobayashi H, Hooper AT, Seandel M, Shido K, White IA, Kobayashi M, et al. (2010). Endothelial cells are essential for the self-renewal and repopulation of Notch-dependent hematopoietic stem cells. Cell stem cell 6, 251–264. [PubMed: 20207228]
Calvi LM, Adams GB, Weibrecht KW, Weber JM, Olson DP, Knight MC, Martin RP, Schipani E, Divieti P, Bringhurst FR, et al. (2003). Osteoblastic cells regulate the haematopoietic stem cell niche. Nature 425, 841–846. [PubMed: 14574413]
Chan CK, Seo EY, Chen JY, Lo D, McArdle A, Sinha R, Tevlin R, Seita J, Vincent-Tompkins J, Wearda T, et al. (2015). Identification and specification of the mouse skeletal stem cell. Cell 160, 285–298. [PubMed: 25594184]
Chan D, Cole WG, Chow CW, Mundlos S, and Bateman JF (1995). A COL2A1 mutation in
achondrogenesis type II results in the replacement of type II collagen by type I and III collagens in cartilage. The Journal of biological chemistry 270, 1747–1753. [PubMed: 7829510]
Chen YB, Ren SM, Li SD, and Du Z (2017). Prognostic significance of osteopontin in acute myeloid leukemia: A meta-analysis. Molecular and clinical oncology 7, 275–280. [PubMed: 28781801] Corada M, Liao F, Lindgren M, Lampugnani MG, Breviario F, Frank R, Muller WA, Hicklin DJ,
Bohlen P, and Dejana E (2001). Monoclonal antibodies directed to different regions of vascular endothelial cadherin extracellular domain affect adhesion and clustering of the protein and modulate endothelial permeability. Blood 97, 1679–1684. [PubMed: 11238107]
Corral J, Lavenir I, Impey H, Warren AJ, Forster A, Larson TA, Bell S, McKenzie AN, King G, and Rabbitts TH (1996). An Mll-AF9 fusion gene made by homologous recombination causes acute leukemia in chimeric mice: a method to create fusion oncogenes. Cell 85, 853–861. [PubMed: 8681380]
Costa A, Kieffer Y, Scholer-Dahirel A, Pelon F, Bourachot B, Cardon M, Sirven P, Magagna I, Fuhrmann L, Bernard C, et al. (2018). Fibroblast Heterogeneity and Immunosuppressive Environment in Human Breast Cancer. Cancer cell 33, 463–479e410. [PubMed: 29455927] Coutu DL, Kokkaliaris KD, Kunz L, and Schroeder T (2017). Three-dimensional map of
nonhematopoietic bone and bone-marrow cells and molecules. Nature biotechnology 35, 1202– 1210.
Coutu DL, Kokkaliaris KD, Kunz L, and Schroeder T (2018). Multicolor quantitative confocal imaging cytometry. Nature methods 15, 39–46. [PubMed: 29320487]
Delmas PD, Demiaux B, Malaval L, Chapuy MC, and Meunier PJ (1986). [Osteocalcin (or bone gla-protein), a new biological marker for studying bone pathology]. Presse medicale 15, 643–646. Ding L, and Morrison SJ (2013). Haematopoietic stem cells and early lymphoid progenitors occupy
distinct bone marrow niches. Nature 495, 231–235. [PubMed: 23434755]
Ding L, Saunders TL, Enikolopov G, and Morrison SJ (2012). Endothelial and perivascular cells maintain haematopoietic stem cells. Nature 481, 457–462. [PubMed: 22281595]
A
uthor Man
uscr
ipt
A
uthor Man
uscr
ipt
A
uthor Man
uscr
ipt
A
uthor Man
uscr
ipt
Doan PL, Russell JL, Himburg HA, Helms K, Harris JR, Lucas J, Holshausen KC, Meadows SK, Daher P, Jeffords LB, et al. (2013). Tie2(+) bone marrow endothelial cells regulate hematopoietic stem cell regeneration following radiation injury. Stem cells 31, 327–337. [PubMed: 23132593] Doege KJ, Sasaki M, Kimura T, and Yamada Y (1991). Complete coding sequence and deduced
primary structure of the human cartilage large aggregating proteoglycan, aggrecan. Human-specific repeats, and additional alternatively spliced forms. The Journal of biological chemistry 266, 894–902. [PubMed: 1985970]
Dominici M, Le Blanc K, Mueller I, Slaper-Cortenbach I, Marini F, Krause D, Deans R, Keating A, Prockop D, and Horwitz E (2006). Minimal criteria for defining multipotent mesenchymal stromal cells. The International Society for Cellular Therapy position statement. Cytotherapy 8, 315–317. [PubMed: 16923606]
Dong L, Yu WM, Zheng H, Loh ML, Bunting ST, Pauly M, Huang G, Zhou M, Broxmeyer HE, Scadden DT, et al. (2016). Leukaemogenic effects of Ptpn11 activating mutations in the stem cell microenvironment. Nature 539, 304–308. [PubMed: 27783593]
Duarte D, Hawkins ED, Akinduro O, Ang H, De Filippo K, Kong IY, Haltalli M, Ruivo N, Straszkowski L, Vervoort SJ, et al. (2018). Inhibition of Endosteal Vascular Niche Remodeling Rescues Hematopoietic Stem Cell Loss in AML. Cell stem cell 22, 64–77e66. [PubMed: 29276143]
Foster JW, Dominguez-Steglich MA, Guioli S, Kwok C, Weller PA, Stevanovic M, Weissenbach J, Mansour S, Young ID, Goodfellow PN, et al. (1994). Campomelic dysplasia and autosomal sex reversal caused by mutations in an SRY-related gene. Nature 372, 525–530. [PubMed: 7990924] Frisch BJ, Ashton JM, Xing L, Becker MW, Jordan CT, and Calvi LM (2012). Functional inhibition of
osteoblastic cells in an in vivo mouse model of myeloid leukemia. Blood 119, 540–550. [PubMed: 21957195]
Geyh S, Rodriguez-Paredes M, Jager P, Khandanpour C, Cadeddu RP, Gutekunst J, Wilk CM, Fenk R, Zilkens C, Hermsen D, et al. (2016). Functional inhibition of mesenchymal stromal cells in acute myeloid leukemia. Leukemia 30, 683–691. [PubMed: 26601782]
Gomei Y, Nakamura Y, Yoshihara H, Hosokawa K, Iwasaki H, Suda T, and Arai F (2010). Functional differences between two Tie2 ligands, angiopoietin-1 and −2, in regulation of adult bone marrow hematopoietic stem cells. Exp Hematol 38, 82–89. [PubMed: 19945502]
Greenbaum A, Hsu YM, Day RB, Schuettpelz LG, Christopher MJ, Borgerding JN, Nagasawa T, and Link DC (2013). CXCL12 in early mesenchymal progenitors is required for haematopoietic stem-cell maintenance. Nature 495, 227–230. [PubMed: 23434756]
Grunberg JR, Hammarstedt A, Hedjazifar S, and Smith U (2014). The Novel Secreted Adipokine WNT1-inducible Signaling Pathway Protein 2 (WISP2) Is a Mesenchymal Cell Activator of Canonical WNT. The Journal of biological chemistry 289, 6899–6907. [PubMed: 24451367] Hammarstedt A, Hedjazifar S, Jenndahl L, Gogg S, Grunberg J, Gustafson B, Klimcakova E, Stich V,
Langin D, Laakso M, et al. (2013). WISP2 regulates preadipocyte commitment and PPARgamma activation by BMP4. Proceedings of the National Academy of Sciences of the United States of America 110, 2563–2568. [PubMed: 23359679]
Hanoun M, Zhang D, Mizoguchi T, Pinho S, Pierce H, Kunisaki Y, Lacombe J, Armstrong SA, Duhrsen U, and Frenette PS (2014). Acute myelogenous leukemia-induced sympathetic neuropathy promotes malignancy in an altered hematopoietic stem cell niche. Cell stem cell 15, 365–375. [PubMed: 25017722]
Hawkins ED, Duarte D, Akinduro O, Khorshed RA, Passaro D, Nowicka M, Straszkowski L, Scott MK, Rothery S, Ruivo N, et al. (2016). T-cell acute leukaemia exhibits dynamic interactions with bone marrow microenvironments. Nature 538, 518–522. [PubMed: 27750279]
Hooper AT, Butler JM, Nolan DJ, Kranz A, Iida K, Kobayashi M, Kopp HG, Shido K, Petit I, Yanger K, et al. (2009). Engraftment and reconstitution of hematopoiesis is dependent on VEGFR2-mediated regeneration of sinusoidal endothelial cells. Cell stem cell 4, 263–274. [PubMed: 19265665]
Huang W, Yang S, Shao J, and Li YP (2007). Signaling and transcriptional regulation in osteoblast commitment and differentiation. Frontiers in bioscience : a journal and virtual library 12, 3068– 3092. [PubMed: 17485283]