Publisher’s version / Version de l'éditeur:
ASHRAE Journal, 42, January 1, pp. 52-59, 2000-01-01
READ THESE TERMS AND CONDITIONS CAREFULLY BEFORE USING THIS WEBSITE. https://nrc-publications.canada.ca/eng/copyright
Vous avez des questions? Nous pouvons vous aider. Pour communiquer directement avec un auteur, consultez la première page de la revue dans laquelle son article a été publié afin de trouver ses coordonnées. Si vous n’arrivez pas à les repérer, communiquez avec nous à [email protected].
Questions? Contact the NRC Publications Archive team at
[email protected]. If you wish to email the authors directly, please see the first page of the publication for their contact information.
NRC Publications Archive
Archives des publications du CNRC
This publication could be one of several versions: author’s original, accepted manuscript or the publisher’s version. / La version de cette publication peut être l’une des suivantes : la version prépublication de l’auteur, la version acceptée du manuscrit ou la version de l’éditeur.
Access and use of this website and the material on it are subject to the Terms and Conditions set forth at
Ventilation for workstations: evaluating seven diffuser layouts
Shaw, C. Y.
https://publications-cnrc.canada.ca/fra/droits
L’accès à ce site Web et l’utilisation de son contenu sont assujettis aux conditions présentées dans le site LISEZ CES CONDITIONS ATTENTIVEMENT AVANT D’UTILISER CE SITE WEB.
NRC Publications Record / Notice d'Archives des publications de CNRC:
https://nrc-publications.canada.ca/eng/view/object/?id=8d5d6663-c5fe-48d7-881d-895bec5e5dea https://publications-cnrc.canada.ca/fra/voir/objet/?id=8d5d6663-c5fe-48d7-881d-895bec5e5deahttp://www.nrc-cnrc.gc.ca/irc
V e nt ila t ion for w ork st a t ions: e va lua t ing se ve n diffuse r la yout s
N R C C - 4 3 9 5 8
S h a w , C . Y .
J a n u a r y 2 0 0 0
A version of this document is published in / Une version de ce document se trouve dans:
ASHRAE Journal, 42, (1), January, pp. 52-59, January 01, 2000
The material in this document is covered by the provisions of the Copyright Act, by Canadian laws, policies, regulations and international agreements. Such provisions serve to identify the information source and, in specific instances, to prohibit reproduction of materials without written permission. For more information visit http://laws.justice.gc.ca/en/showtdm/cs/C-42
Les renseignements dans ce document sont protégés par la Loi sur le droit d'auteur, par les lois, les politiques et les règlements du Canada et des accords internationaux. Ces dispositions permettent d'identifier la source de l'information et, dans certains cas, d'interdire la copie de documents sans permission écrite. Pour obtenir de plus amples renseignements : http://lois.justice.gc.ca/fr/showtdm/cs/C-42
Evaluating Seven
Diffuser
Layouts
Ventilation for Workstations
JOURNAL
ASHRAE
By C. Y. Shaw, Ph.D., P.Eng.
Member ASHRAE
Measurement Methods
One direct way of assessing the per-formance of a ventilation system is to measure the supply air distribution pat-tern.' Several other parameters have also been proposed for assessing the perfor-mance of a ventilation system. They in-clude air change emciency, and ventila-tion efficiency'·'·6.7.'" The methods and procedures used to measure these param-eters follow.
About the Author
C. y. Shaw, Ph.D., PEng.• is Ihe group leader of the Ventilation and Indoor Air Quality Group, Institute for Research in Construc!ion, at the National Re-search Couneil Canada inOnawa.He is a correspond-ing member of ASH RAE Technical Committee (IC) 4.3, Ventilation Requirements and Infiltration and TC 4.10, Indoor Environmental Modeling.
January 2000
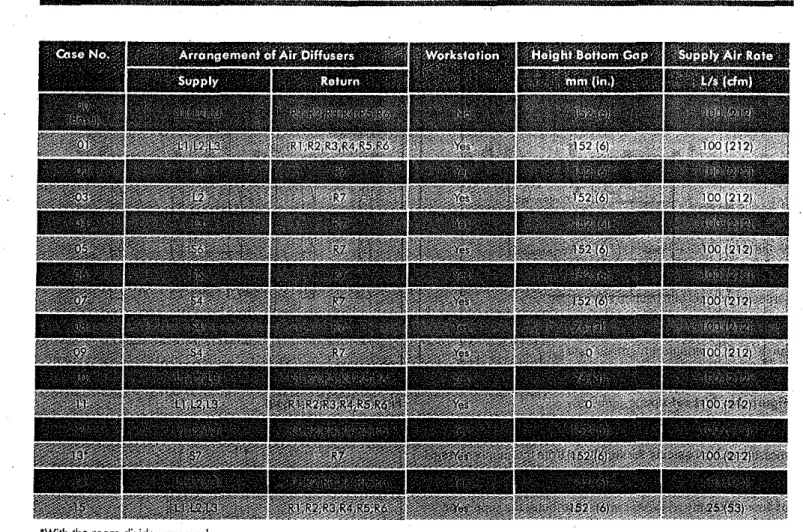
supply, return and outdoor air supply ductswere also sampled. In addition, sam-pling tubes were installed in the areas surrounding the test room. The worksta-tion was divided into eight volumetrically equal regions with a sampling station in-stalled in each region. As shown in Fig-ure2, sampling stations 1,2,3,4, and 5 were at the breathing height of a seated adult, and sampling stations 6, 7,8 and 9 were appro4imately at the nose height of a standing adult. Sampling stations 10, 11, 12, and 13 were placed at the breath-ing height of a seated adult outside the workstation near the' center of the space between the partition and the wall of the test room, and sampling stations 14 and 15 were placed above the workstation.
Two automated sampling systems were used for collecting tracer gas samples: one for collecting individual samples from the 15 locations inside the test room and the outdoors, and the other for collecting' samples from the HVAC system, and the !ocations outside the test room.
ducts to control and measure the airflows through these ducts.
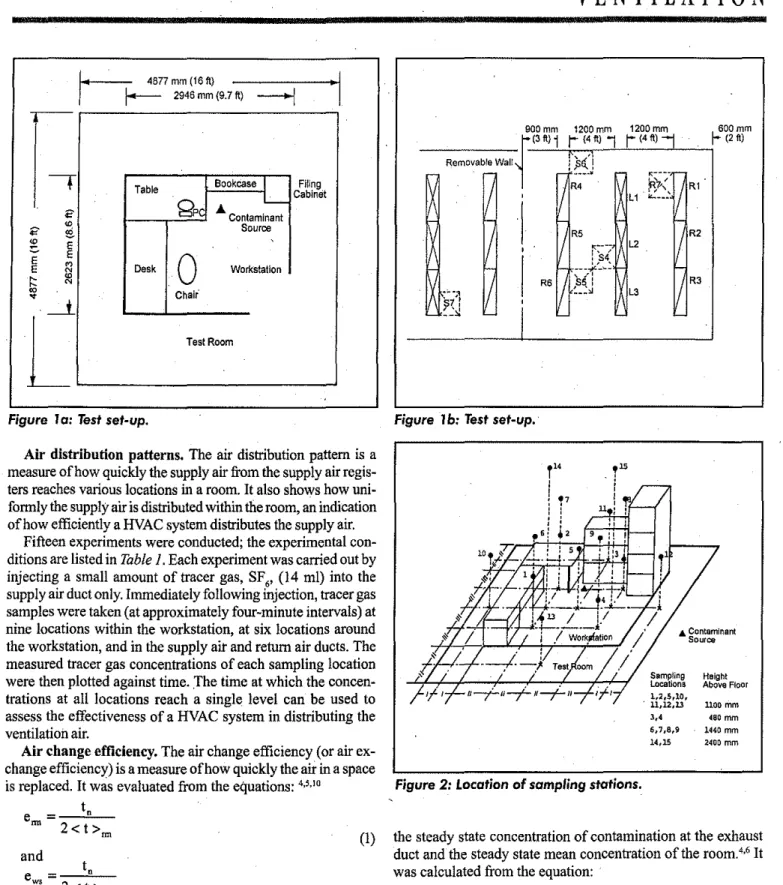
As shown inFigure 1,the rooms are equipped with two basic designs of sup-ply air outlets and return air inlets: light troffer diffusers (LT), 1.2 m or 4 ft long, and square-face, round-neck diffusers (SFRN), 0.6m' or 2 ft'. The light troffer diffusers are fi4ed, but the square-face, round-neck diffusers can be moved. Us-ing combinations of these diffusers, seven layouts of supply air inlets and re-turn air outlets were created and tested.
A2.9 m by 2.6 m (9.7 ft by 8.6 ft) mock-up workstation was placed inside one of the test rooms(Figure la).The height of the partition was 1.9 m (6.3 ft). The furni-ture, as shown, included desks, desk lamps, chairs, tables, bookcases, comput-ers and file cabinets. In addition, two light bulbs, one 60 Wand one 10,W, were placed on the chair to simulate the sen-sible heat of an omce worker.
Tracer gas sampling stations were in-stalled at 15 locations within the test room, including nine locations within the work-station, four locations around and two locations above the workstation. The
RAE.lsOnlin-e Magazine .ashraeiournal.org
ASH RAE Journal
52
or office buildingswith an open-floor layout, some workstations may
be over-ventilated and others may be inadequately ventilated, even
though the total ventilation (outdoor air supply) rate may be adequate.
This is because information related to workstation layouts rarelyis available
when designing the ventilation system. In addition, workstation layouts may
be changed as the use ofthe space changes. To ensure that every
worksta-tion is adequately ventilated, building managers and designers need to know
the influence ofvarious design parameters, such as the types and design
layouts ofsupply air registers and return air grilles on the performance ofa
HVAC system in a workstation.
The objective ofa recent study was to compare the performance ofseven differ-ent designs ofsupply air diffuser layouts in delivering the ventilation air within and around the workstation. Measurements also were taken to detennine the effects of gap heights at the base of workstation partitions and total airflow rates on the ventilation conditions within the work-station. This article summarizes the re-sults of two papers.J.'
Test Set·Up
Tests were conducted in a ventilation test facility consisting of two intercon-nected test rooms in a laboratory-office building. As shown inFigure 1,the di-mensions ofeach room are 4.9 m by 4.8 m . by 2.9 mhigh (16 ftby 15.7 ftby9.4 ft). Each room is equipped with an indepen-dent HVAC system. Dampers and orifice' plates have been installed in the supply, return, outdoor air supply and e4haust
VENTILATION
h
4877mm(16ft)セ 2946mm(9.7 ftl
--+j
...---
'I
+
Table BookCase I FilingA L- Cabinet
"
gpe
"'
Contaminant"
e
Source セ E E E0
'"
E N Desk Workstation セ"'
N ro Chair""
.-.1
L
Test Room 900mm 1200mm { 13ftljr
(4ft)"1
Removable Walt lセゥヲHA r セN⦅ .... 17 R'11
'
17!
11
R5I
i
1200mmr
(4ft)--j f-L2II
R2 II R3 L3 II t!00mm 1- (2ft)Figure Ia:Test set-up. Figure 1b:Testset-up.
where
t.=nominal time constant, the volume of the test room di-vided by the outdoor air supply rate,
<t>= room mean age of air, the average value of the local mean ages ofair for all points in a room (the local mean age ofair is the average time it takes for air to travel from the supply air register to any point in a room).
Ventilation efficiency. The ventilation efficiency (or con-taminant removal effectiveness) is defined as the ratio between
January 2000 53 uoo mm 480mm 1440mm 2400mm Height Above Floor '" Contaminant Source Sampling ャッ」。ャゥッョセ 1.2,5,10, . 1l,12,13 3,' 6,7,8,9 14,15
ASH RAE Journal
the steady state concentration of contamination at the exhaust duct and the steady state mean concentration of the room,,6It
was calculated from the equation: E= Cn -C,
<Cwo >-C, (3)
Figure2: Lacation of samplingstations.
where C
n = steady state concentration at the exhaust air duct,
<Cw,>=steady state mean concentration of the workstation, C,= steady state concentration at the supply
A constant flow of CH, was used to simulate a single con-taminant source on the floor, Detailed procedures used to
measure these paraI!1eters are given in the original papers.1
,2 (1) (2) and t e = n
w.
2 <t>wsAir distribution patterns. The air distribution pattern is a measure of how quickly the supply air from the supply air regis-ters reaches various locations in a room.Italso shows how uni-formly the supply air is distributed within the room, an indication of how efficiently a HVAC system distributes the supply air.
Fifteen experiments were conducted; the experimental con-ditions are listed in Table 1. Each experiment was carried out by injecting a small amount of tracer gas, SF" (14 ml) into the supply air duct only. Immediately following injection, tracer gas samples were taken (at approximately four-minute intervals) at nine locations within the workstation, at six locations around the workstation, and in the supply air and return air ducts. The measured tracer gas concentrations of each sampling location were then plotted against time. The time at which the concen-trations at all locations reach a single level can be used to assess the effectiveness of a HVAC system in distributing the ventilation air.
Air change efficiency. The air change efficiency (or air ex-change efficiency) is a measure ofhow quickly the air in a space is replaced. Itwas evaluated from the equations:4,',10
t
e
=
n. lieJglli 8otiom GoP'" IBBセwッエォウヲッエェーョ," ,
..
i Return Supply " セ ArrQngemen.ッヲセゥイ Diffusers ""\'1"With the room divider removed
Table 1: Experimental conditions for J5 experiments used to assess the effectiveness of an HVAC system.
Results and Discussion
Experiments were conducted to determine the influence of various factors on the performance ofa ventilation system for a workstation. These factors included types and layouts of sup-ply diffusers, gap heights at the base of workstation partitions, and supply airflow rates. As mentioned in the "Test Set-Up," tracer gas samples were taken at nine locations in the worksta-tion and six locaworksta-tions in the surrounding area. The samples were also taken from the supply and return ducts. Discussion of the results follows.
Types and Layouts
ofSupply Air Diffusers
(Case
00 to Case 07)
Tests were conducted on seven supply air diffuser lay-outs including either LT or SFRN diffusers (Figure 1). De-tails are given in Table 1. One of the seven layouts, Case 00, which included three LT diffusers for supply and six LT diffusers for return but no workstation (i.e., an empty room) was used as the base case for comparison. For this series of tests, the gap height at the base of the workstation parti-tions was 152 mm (6 in.). The supply air temperature was set at 23'C (73'F) and the supply airflow rate was controlled at 100 Lis (212 cfm), including 20 Lis (42 cfm) outdoor air. The airflow rates at the outdoor air supply, main supply air, re-turn air and exhaust air ducts were monitored continuously during the test.
Iii
II
II
II
54 ASHRAE Journol
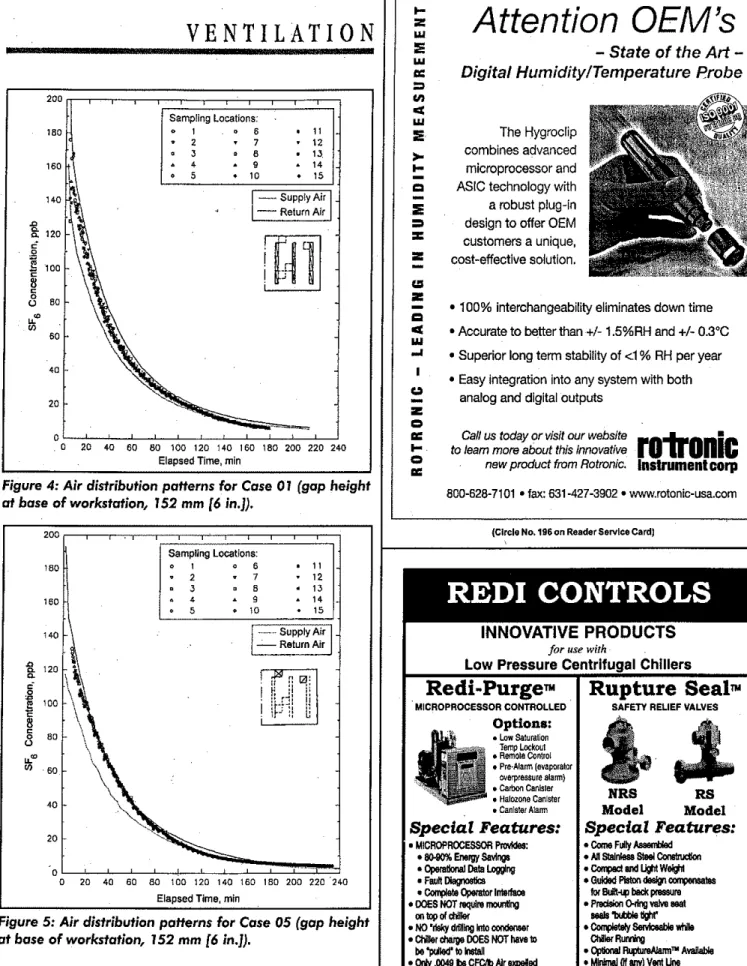
Air distribution patterns. Of the seven diffuser layouts in-vestigated, Figures 3 and 4 show the air distribution patterns without (Case 00) and with (Case 01) a workstation for the base air diffuser layout (three supply air LT diffusers and six return air LT diffusers). Figure 5 shows the air distribution pattern for the worst air diffuser layout, i.e., a SFRN supply air diffuser outside the workstation (Case 05) with a single return air grille located near another corner of the workstation. The results indicate that the tracer gas concentrations in the occupied zones inside and outside the workstation were almost indistinguish-able. Similar results were obtained for all other diffuser layouts. The results suggest that all diffuser layouts distributed the tracer gas, and hence the ventilation air, inside and outside the workstation equally well. No evidence was found to indicate that one diffuser layout was better than the others. This further suggests that, for the seven diffuser layouts, the presence of a workstation had no significant effect on the air distribution patterns within and around the workstation.
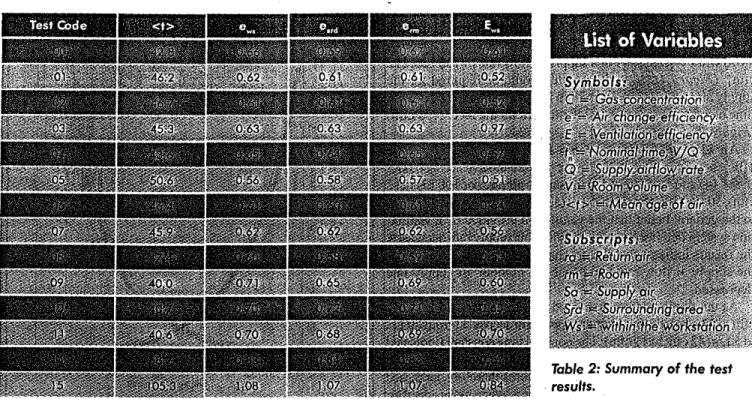
Air change efficiency. Table 2 lists the average values of the air change efficiency for the workstation (e ), the sur-rounding area (e",), and the room as a whole (e:). The re-sults indicate that for the seven air diffuser layouts, the measured air change efficiency for the workstation varied from 0.56 (Case 05) to 0.66 (Case 00), and that for the room varied from 0.57 (Case 05) to 0.67 (Case 00). The average values of air change efficiency for only the workstation Januory 2000
Test COde
---_..-VENTILATION
Table 2: Summaryofthe test results.
Effect
of
Gap Heightsat
the Baseof
Partitions (Cases 01, 07, 08, 09, 10and 11)To determine the effect of gap heights at the base of work-station partitions on air distribution patterns, for LT diffusers; Case 01 was tested three times each time with a different gap height. The three gap heights were 152 mm (6 in.), 76 mm (3 in.) and 0 mm. The air distribution patterns for all three-gap heights were similar, suggesting that the effect of gap heights was not detectable. Similar results were obtained for SFRN diffusers.
Effect
of
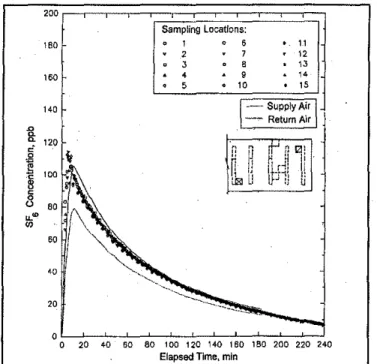
Supply Airflow Rate Changes (Cases 01, 14and 15)Case 0 I was tested two additional times, each with a differ-ent supply airflow rate (the return airflow rate was always equal to the supply airflow rate) to determine the effect of supply airflow rates on the air distribution patterns. The supply airflow rates tested were 100 Lis (212 cfro), 50 Lis (106 cfro) and 25 Lis (53 cfro)(the outdoor airflow rates were 20 Lis [42 cfro], 10 Lis [21 cfro], and 5 Lis [11 cfro], respectively). As an example,
Fig-ure 7 shows the air distribution patterns for the supply airflow
rates of25 Lis (53 cfro) (the results for the 100 Lis [212 cfro] about 1m. To determine the wall effect, Case 12 which had the same diffuser layout as Case 01 (see Figure 1) and Case 13 where the supply air diffuser was located in the next room (indi-cated as S7 in Figure1)were tested with the wall separating the two test rooms removed.
As an example, Figure 6 shows the air distribution patterns for Case 13. As the same amount of supply air was discharged into two rooms of identical size' instead of one, the concentra-tions at all sampling locaconcentra-tions were lower than those for Case 01. The concentrations at all sampling locations within and around the workstation were almost identical, indicating that the supply air was well mixed. Similar results were obtained for Case12. agreed closely with those for the room as a whole. The
agree-ment between these two was within 5%. Table 2 also lists the mean age-of-air values for the workstation. The mean age-of-air for the workstation ranged between 42.8 min (Case 00) and 50.6 min (Case 05).
The results appear to indicate that both the air change effi-ciency and the mean-air-of-air were able to identify the seem-ingly worst diffuser layout, I.e., Case 05, from the seven. In contrast, the air distribution pattern, as indicated by tracer gas profiles, was not able to do so.
Ventilation efficiency. The values of ventilation efficiency (Ew,)for the workstation are also given in Table 2. The results
indicate that ofthe seven diffuser layouts tested with the work-station (Cases 0 I to 07), two cases had much greater ventilation efficiency (1.22 and 0;97 for Cases 02 and 03, respectively) than the others (ventilation efficiency was typically about 0.57). To determine the possible reason for the difference, Cases 03 and 07, were examined. Case 03 (similar to Case 02) had one LT supply air diffuser (L2) and one SFRN return air grille (R7). The supply air diffuser was much closer to the contaminant source than for other cases (Figure1).
Case 07 had a similar design except that the supply air dif-fuser was replaced with a SFRN difdif-fuser (S4). Therefore, al-though the total supply air rate was identical, there was more air in Case 03 than Case 07 aiming at the source to stir the
contami-nant for mixing. As a result, more contamicontami-nant was removed
through the return air and hence, higher ventilation efficiency was achieved in Case 03 than in Case 07.
Effect
of
Test Room Walls (Cases 01, 12and 13)All the earlier tests were conducted in one test room with the workstation located almost at the center. The distance between each workstation partition and the nearest test room wall was
11 12 13 14 15 200QBMセMGMG[ZZZRZZZZZZZ]]c]]ZZZZZZ]][ャ Samplinglッ」。エゥッョセZ 1 6 2 7 3 8 , 9 5 10 180 180
(Circle No. 197 on Reader Service Card)
0 0 20 40 60 80 100 120 140 150 ·'80 200 220 240
Elapsed Time, min
140 20 '8. 120 セ
I
<'5 tL° '" 60 January 2000AUTOMATICALLY CORRECTS FOR AIR DENSITY &
BACKPRESSURE
CHOICE OF METERS· AIR FLOW ONLY, OR AIR FLOW, VELOCITY, PRESSURE&TEMPERATURE
OPTIONS INCLUDE: MEMORY, AVERAGE&SUM TO 100 READINGS, SEQUENTIAL RECALL, AUTO·READ REPAIR POLICY· ONE WEEK TURNAROUND OR LESS
CUSTOM TOPS MADE TO ORDER
Shortridge Instruments, Inc.
7855 East Redfield Road.Scousdale.Arizona 85260 (480) 991·6744 FAX (480) 443·1267
ELECTRON IC FLOWHOOD
DIRECT DIGITAL READOUT 0-2500 CFM
Figure 3: Air distribution patterns for Case 00 (base case, no workstation).
Relay-=-s
--I
Your Switching SolutionDELTROL
confjpo!s
(Circle No.201 on Reader ServIce Card)
ASHRAE Journal
supply air rate is show inFigure4). The results reveal that the scatter in the measured concentrations increased as the supply airflow rate decreased. For a supply airflow rate of I00 Lis [212 cfm] (Figure4), 20 to 40 minutes would be required for the supply air to be well mixed within the workstation. The mixing time increased to more than 240 minutes for the 25 Lis (53 cfm)
(Figure 7)supply air rate.
Air change efficiency. Table 2 shows that the air change efficiencies for the workstation, ewo'were 0.62 (Case 01), 0.83
(Case 14) and 1.08 (Case 15) for supply air rates of 100 Lis (212
din),50 Lis (106 cfin) and 25 Lis (53 cfin), respectively. Contrary
to the general belief that the ventilation provided by a ventila-tion system deteriorates as the outdoor air supply rate decreases, the results indicate that the air change efficiency increased as the supply airflow rate and hence the outdoor air supply rate decreased.
As the supply air rate decreased from 100 Lis to 25 Lis (212 cfm to 53 cfin), the outdoor air supply rate decreased from 20 Lis to 5 Lis (42 cfin to 11 cfin). The nominal time constant (indicated as t, in Equation 1, which is defmed as the volume of the test room divided by the outdoor air supply rate), therefore, increased fourfold from 55.7 min to 222.7 min. The average mean age ofair for the workstation (Table 2) increased only twofold from 46.2 min to 105.3 min (the corresponding room mean age ofair for the rooms were 46.3 min and 105.8 min, respectively). Equation 1
VENTILATION
ro1ronic
Instrument corp
Attention OEM's
- State of the Art
-Digital Humidity/Temperature Probe
Call us today or visit our website
tolearn more about this innovative new product from Rotronic.
The Hygroclip
combines advanced microprocessor and
ASIC technology with a robust plug-in design to offer OEM
customers a unique, cost-effective solution.
o100% Interchangeability eliminates down time oAccurate to better than+/-1.5%RH and+/-0.3°C oSuperior long term stability of <1 % RH per year oEasy Integration into any system with both
analog and digital outputs
800-628-7101 • fax: 631-427-3902 • www.rotonic-usa.com
:e
=
:z:z
...
Z w セ w lie=
en <I: w:e
>-...
Cl &II Z Cl <I: w...
I U -Z C> II:...
Cl II: Samplinglocations: 1 6 11 2 7 12 J 8 '3, 4 9 14 5 10 15 200 180 160'"
セ 8: 120"
0 セ Jl 100 0 8 0 0 80 U オNセ"'
'0"
Figure 4:Air distribution patterns for Case01 (gap height at baseofworkstation, 152 mm (6 in.).
'0
oPZMMZZLッZMMZZLPZMGZAZPZMNZAZPM]MGPZZPZMQRGBGPセQTBPMGZZGZMP --:'-=-.O=--=-':'Oo=--=-"'"'o--!,,o
Elapsed Time, min
200 (Circle No. 196 on Reader Service Card)
Figure 5:Air distribution patterns for Case 05(gap height at baseofworkstation, 152 mm [6in.).
57
NRS
as
Model Model
Special Features:
• Come Fully AaserrilIed • AllStaInless SteelConsttuc:tion
oセ IIIdl.\111Welg1l • GuIdedPIstond9s9lセャ・ウ
'"セ bad<ーiQssuセ • PAldslon o-ring valve 88at
... ...-lIght' •セ ServIceablewhile
CIl8IorRU!VO'Cl
• OptionalFqltureAlarnl'" Available
oMInImal(Ifany) v..Une _RequllOd oEaoy_
• InsuraooeSafety CMcb quIddy 00ne
whileChi10r0p0nl1lng
ASH RAE Journal
(Circle No. 195 on Reader Service Cardl
INNOVATIVE PRODUCTS
for use with
Low Pressure Centrifugal Chillers
REDICONTROLS
Redi-Purge™
Rupture Seal™
. MICROPROCESSOR CONTROLLED SAFETY RELIEF VALVES
Options: • Lowsaturation Temp Lockout • Remole Control • Pre·Alarm (evaporator overpressure alarm) • carbon C811lster • Hal020ne Canister • Canlstsr Alarm
Call for Pricing and Availability
Phone: (317)865-4130 (800)626-8640 Fax: (317) 865-4145
Special Features:
• M1CROPRcx:::ESSOR ProvkIes: • 80-90%Enelg'fSavlrqI
o0pe!BlI0naJDataloWng
• FaultDIagnoetlcs
• Cor1ll/6teOperator Interface • DOES NOT requiremountIrY;I
","PoI_
• NO "risky drilling Into condenser • Cliller charge DOES NOT have to
be'pcjlod' "_I
• Only.0049beCFCIbAir pP&IIed withcpIlonaJ Ca!bon _ CoId01C&rislar • VIrtuallyZeroEmIssIon with
HaJozone CollectionCanlster
180 160 140 セ セ セ C
セ
100 C 8 0 80 0 U オNセ"'
'0 '0 '0 Sampling Locations: 1 6 11 2 7 12 J B 13 4 9 14 5 10 15 o01-"'':-0セBZMMZBPZMXZAZPZMQMAMPP]]G[RPZZQTZPZMZQVセPセQXセPBBセPBBP
BBセRPセG
240Elapsed Time, min
indicates that such a disproportional increase in the two param-eters will lead to a large increase in the air change efficiency.
The results reveal that the air change efficiency failed to reflect the general expectation that the ventilation provided by a ventilation system worsened as the supply airflow rate (out-door air supply rate)decreased. Mean age-of-air, on the other hand, appears to be a better indicator than air change efficiency
January 2000
ッlMセMGMセ⦅セMGMMlMセ⦅セMGMセ⦅GMMMG
0 2 0 W W M ャPPQセGセQVP ャmwPRュRセ
Elapsed Time, min
11 12 13 14
"
Samplinglocations: 1 5 2 7 3 8 , 9 , 10Summary
Seven different diffuser layouts were compared for their ability to distribute the supply air into a workstation located in-side an enclosed room. The results, as indicated by the air distribution tests, under the conditions and diffuser/grille layouts studied are summarized as fol-lows: 20 200 160 160 140 1< ': 120
,g
V
セ 100 • B •8
セキ <nFigure 6:Air distributionpoffernsforCase 13withonetest
roomwall removed.
セ[OMMM Flexible
cable
MASON SAFEFLEX COMPETITORS
Y
MASDN INDUSTRIES. INC.
Mailing Address: P.O. Box410,Smithtown, NY11787
516·348-0282 • Fax: 516-348·0279 • E-mail: info@mason-lnd_com
• The Safeflex body is reinforced with Dupont Kevlaro-jar superior to nylon in jlghtlng heat·aging and bursting.
• Safeflex rubber flanges are buiit around a rigid flat steel ring, rather than a flexible cable,
so the jlange can't pull out.
Callor send today forfull information.
Why
take chances?
.Expansion joints are a critical component of heating,Aleand industrial systems. If they ieak or burst, it can cause
personal injury or costly property damage.
There are no safer expansion
joints than Safeflex.
to appropriately reflect changes in supply air rate. The results also suggest that air change efficiency may not be suitable for .comparing ventilation systems with different ventilation rates
(air change rates).
Ventilation efficiency. Table 2 shows that the ventilation
efficiencies were 0.52 (Case 01),0.67 (Case 14) and 0.84 (Case 15) forsupplyairratesofiOO Lis (212elin),50 Lis (106elin)and 25 Lis (53 cfm), respectively. These results indicate that the ventilation efficiency increased instead of decreased as the supply airflow rate and hence the outdoor air supply rate de-creased. This appears to be contrary to the general expectation that higher ventilation rates would result in a better ventilation efficiency than lower ventilation rates.
This seemingly unexpected result may be unique for this particular diffuser/grille layout only. One possible explanation may be that the contaminant source was simulated by il1iecting a constant flow ofCH,. The injection point was located on the floor near the corner of the worktable and the bookcase to simulate a point source. For the 100 Lis (212 Lis) supply air rate, the supply air jet would be strong enough to penetrate deeply into the workstation. The mixing of the contaminant with the interior air would likely have occurred mainly in the lower part of the workstation. This mixture migrated to the return/exhaust duct mainly through the opening ofthe workstation and through the surrounding area. As a resuit, the contaminant concentra' tion within the workstation was greater than that in the sur-rounding area and the return/exhaust duct.
i
II
Ii 'Ii
I
i
I' !i II I:] i! ';' 1II
I
II II ;:! I 'i IVENTILATION
ULTRA-Y
Combo StrainerIBall ValYe wIth PT Plug and DraIn Valve
1;
'NEX' has Ihe-answers! orturャGセBalancing Valve
セ
ZZptウ。ョ、カ・ョエセcd
• •
-=1
nセ
-9
i
CALL YOUR LOCALVii"0"'ln9 Se.1, NEXUS REP FOR SPECS & PRICESI
NEXUS
(Circle No. 203 on Reader Service Card)
SIS Braided Hose, 450psl W.P.
All Valves 11'160111 WOG Full Port, Forged Srass
"HOSE·PAKS"
by
Nexus Valve
featuring ULTRA·FLEX Hoses•...
Twin Union End Swivels! No Twists! No Kinks!
100_ Draln Vllve
wl1hHostEflll, CaplReWner
Nexus Valve Specialties, . Box20410Indpls, INTVRセo Ph: 888-900..(1947 Fax: 800·900-8654 olMMZLMMZGZMMZGZMMZG」MZセLMGMZMM」GMZLMMGZZMZセZZMGMZZMM」GMZNMj
o 20 セ 60 80 QPPQRPQセ QVPQXPRPPRRPRセ
Elapsed Time, min
All
diffuserl 200m-;-'--'-';:::::::':::::::::=::::C=2:=C::c::=:r:::::;j
workstation: Part I"":"'-air distributionpat-grille layouts dis- I:' Sampling Locations: terns,"ASHRAE Transactions97(2): 125-132. tributed the supply 180 セ 1 6 11 2. Shaw, c.Y., et aL 1993. "Effect of air
dif-air within the work- 2 7 12 fuser layout on the ventilation conditions ofa
. .) 8 13
statIon and inthe 160 4 9 14 workstation: Part II-air change efficiency and
surrounding area 5 10 15 ventilation efficiency,"ASHRAE Transactions
equally welL The 140 SupplyAir 97(2):133-145.
presence ofa work- _ ReturnAir 3. Shaw, c.Y. 1991. "Indoor air quality as-station had no sig- .r:J sessment in an office-library building: Part
1-セ 120
nificant effect on
m'
'1
test methods," ASHRAE TransactionsPthaettaeitrndis'StriF'obruttihone.
f
オMッセ
lOa II.wZNGセGᄋ
セMャ
97(2):129-135.4. Skaret, E. and Sandberg, M. 1985. "Airseven-diffuser! _ exchange and ventilation efficiency-new aids
grille layouts stud- 8 0 .
fortheventilationindustry,"NorskVVS(Nor-ied, no evidence l);'" way), No.7, pp.527-534, OA Trans 2869.
was found to indi- 60 5. AIVC 1990. "A guide to air change
effi-cate that one dif- ciency," AIVC Tech. Note 28, Air Infiltration
fuser layout was 40 and Ventilation Centre; UK.
&ignificantlybetter ··..セMN ..." M 6. AIVC 1991. "A gUide to contaminant
re-than another. With -"
all other test condi- 20 mova! effectiveness," AIVC Tech. Note 28.2,
Air Infiltration and Ventilation Centre, UK.
lions urichanged,
7. Anderson, R. 1988. "Determination of
ven-adding additional
tilation efficiency based upon short tenn tests,"
space toone side of
Proceedings, 9th AIVC Conference, Belgium. the room reduced
the amount of sup- Figure 7:A;r distribution patterns for Case01 (supply air- 8. Bauman, ES., et a!. 1993. "Air movement, ply ait to the work- flow rate, 25 Lis (53cfm}). comfort and ventilation in partitioned
work-station, but had no stations."ASHRAE Journai35 (3):42-50.
significant effect on the air distribution conditions would be needed to confirm 9. Bauman, F.S., et aL 1992. "Air movement, pattern within the workstation. these findings for offices with single and ventilation, and comfort in a partitioned
of-The effect of gap heights at the base multiple workstations. fice space."ASHRAE Transactions, 98(1).
ofworkstation partitions on the air distri- 10. Nordtest Method NTVVSO 19. 1983. bution patterns was minimal. Acknowledgments "Buildings: Local Mean Age," Nordtest, Fin-For the layout with three light troffer The authors wish to acknowledge the land. •
diffusers for supply ait and six identical contribution of Dr. J.T. Reardon in the Pl.... drd. th••pproprlat. numb.r .n the Re.d.r diffusers for return air which IS commonly preparation of this paper. Sarvl.. C.rd .r rh. b.ck .1 th. publilall.n.
used for office building, both the air change Extr.m.ly H.lpful 462
efficiency and ventilation efficiency de- References H.lpful 463
creased as the supply air rate increased. 1.Shaw, C. Y., et aL 1993. "Effect of air dif- S.m.wh.l H.lpful 464 This is contrary to the general belief that fuser layout on the ventilation conditions ofa NolH.lpful 465 for a properly designed ventila- イMMMMMMセMMMMMMMMMMMMMMGMMMMMMMMMMMMᆳ
tion system, the ventilation COn-dition itnproves as the ventilation rate increases. Further work is needed to verify that this COn-ciusion would also be applicable for other commonly used dif-fuser/grille layouts for office buildings. This example suggests that caution should be exercised when air change efficiency and ventilation efficiency are used as the criteria for comparing the per-formance of ventilation systems with different ventilation rates (ait change rates).
Further study under field