HAL Id: hal-02906983
https://hal.sorbonne-universite.fr/hal-02906983
Submitted on 26 Jul 2020
HAL is a multi-disciplinary open access
archive for the deposit and dissemination of
sci-entific research documents, whether they are
pub-lished or not. The documents may come from
teaching and research institutions in France or
abroad, or from public or private research centers.
L’archive ouverte pluridisciplinaire HAL, est
destinée au dépôt et à la diffusion de documents
scientifiques de niveau recherche, publiés ou non,
émanant des établissements d’enseignement et de
recherche français ou étrangers, des laboratoires
publics ou privés.
fingerprints in the coastal NW Mediterranean Sea
Raphaël Lami, Jf Ghiglione, Y. Desdevises, N West, P. Lebaron
To cite this version:
Raphaël Lami, Jf Ghiglione, Y. Desdevises, N West, P. Lebaron. Annual patterns of presence and
activity of marine bacteria monitored by 16S rDNA–16S rRNA fingerprints in the coastal NW
Mediter-ranean Sea. Aquatic Microbial Ecology, Inter Research, 2009, 54, pp.199-210. �10.3354/ame01264�.
�hal-02906983�
INTRODUCTION
Despite the importance of bacteria in marine bio-geochemical cycles (Azam et al. 1983), little is known about the dynamics of bacterial populations and of their activities (Fuhrman et al. 2006). In particular, the response of the bacterial community to environmental changes over mid- and long-term scales remains poorly characterized. The short-term variations of bac-terial populations have been frequently studied in the marine environment (i.e. Zubkov et al. 2001, Fandino et al. 2005, Pinhassi et al. 2005), but only a few studies
focused on the annual dynamics of the bacterial com-munity composition throughout the year (Murray et al. 1998, Ghiglione et al. 2005, Mary et al. 2006). In addi-tion, only a few studies have examined the activity of these populations (Alonso-Saez & Gasol 2007). Bulk measurements of bacterial production or respiration have been conducted over a year (Lemée et al. 2002, Reinthaler & Herndl 2005), but these studies did not provide any information regarding the distribution of activity among different members of the community.
The distribution of activity among different members of the bacterial community has been investigated
© Inter-Research 2009 · www.int-res.com *Email: lami@udel.edu
Annual patterns of presence and activity of
marine bacteria monitored by 16S rDNA–16S rRNA
fingerprints in the coastal NW Mediterranean Sea
Raphaël Lami
1, 2, 4,*, Jean-François Ghiglione
1, 2, Yves Desdevises
1, 3, Nyree J. West
1, 2,
Philippe Lebaron
1, 21Université Pierre Marie Curie – Paris 6, Laboratoire ARAGO, Avenue du Fontaule, BP44, 66650 Banyuls-sur-Mer, France 2CNRS, UMR 7621, Laboratoire d’Océanographie Biologique de Banyuls, Avenue du Fontaule, BP44,
66650 Banyuls-sur-Mer, France
3CNRS, UMR 7628, Modèles en Biologie Cellulaire et Evolutive, Avenue du Fontaule, BP44, 66650 Banyuls-sur-Mer, France 4Present address: College of Marine and Earth Studies, University of Delaware, Lewes, Delaware 19958, USA
ABSTRACT: The annual dynamics of the bacterial community structure and its activity remain poorly studied in marine environments. Our goal was to gain new insights into the year-long bacterial dynamics and activity in correlation with environmental changes in the NW Mediterranean Sea. To accomplish this goal, we combined 16S rDNA versus 16S rRNA fingerprints and environmental vari-ables using multivariate analyses. A clone library was constructed to determine to which bacterial taxa the major ribotypes were related. Our results revealed similar environmental controls of bacter-ial community structure at both the DNA and RNA levels. The 16S rRNA signal of several ribotypes differed relative to their 16S rDNA counterpart, suggesting that the members of the community have either a higher or lower activity than their relative abundance would suggest. Such differences included the dominant ribotypes observed in the fingerprints, such as Roseobacter, Synechococcus, SAR11 and SAR116. All these results give support to the 16S rDNA and 16S rRNA fingerprinting approach to monitor bacterial community structure and activity in marine environments.
KEY WORDS: Bacteria · 16S rDNA – 16S rRNA · Bacterial activity · CE-SSCP · Canonical correspondence analysis · Mediterranean Sea · Time series
using micro-autoradiography combined with fluores-cence in situ hybridization (micro-FISH) to examine uptake of radiolabeled substrates by specific phylo-genetic groups (Alonso-Saez & Gasol 2007). However, this technique is too laborious for intensive samplings and is limited to only a few substrates that can be radiolabeled. Capillary-based fingerprinting tech-niques are well adapted to study bacterial dynamics in marine environments at a high throughput (Brown et al. 2005). The 16S rDNA profiles describe the relative composition of the bacterioplankton community (i.e. Muyzer et al. 1993, Lee et al. 1996), and previous studies used the 16S rRNA profiles to characterize the active fraction of bacterial communities in different environments (i.e. Moeseneder et al. 2001, Troussellier et al. 2002, Gentile et al. 2006), based on the observa-tion that the number of ribosomes per cell is propor-tional to the growth rate (DeLong et al. 1989, Kemp et al. 1993, Kerkhof &Ward. 1993, Lee & Kemp 1994). To our knowledge, little is known on how the activity of individual members of a bacterial community varies in response to environmental changes.
In this study, we used an integrated approach com-bining capillary electrophoresis–single strand confor-mation polymorphism (CE-SSCP) of 16S rDNA and 16S rRNA profiles to obtain insights into the dynamics of the total and active communities during a 1 yr survey in the NW Mediterranean Sea. For text simplicity, we use the expression ‘16S rDNA’ to refer to the 16S rRNA genes, as did several authors in recently published papers (i.e. Gentile et al. 2006, West et al. 2008). Multi-variate analyses were performed to determine the frac-tion of the variance in both present and active bacter-ial communities that could be explained by the local environmental factors and time. In addition, a clone library was constructed to identify the ribotypes domi-nating the fingerprints.
MATERIALS AND METHODS
Sample collection and environmental measure-ments. Sampling was done from March 2003 and April 2004 at the SOLA station (42° 31’ N, 03° 11’ E), in the Bay of Banyuls-sur-Mer, on the French Mediterranean coast. Seawater was collected in 5 l Niskin bottles at 5 m depth. Environmental variables were measured by the French coastal monitoring program Service d’Ob-servation en Milieu Litoral (SOMLIT) (www.domino. u-bordeaux.fr/somlit_national) according to protocols previously described (i.e. Joux et al. 2006) and avail-able on the SOMLIT website. All samples were processed after sampling within 30 min.
Microbiological variables. Bacterial abundances were measured using the flow cytometry protocol
de-scribed by Lebaron et al. (1998). Briefly, 2 ml of sea-water was pre-filtered at 5 µm before being fixed (2% formaldehyde, 1 h, 4°C) and incubated with SYBR Green II (final conc. 0.05% [v/v] of the commercial so-lution, ≥15 min, at 20°C in the dark). A 10 to 15 µl vol-ume of this solution was used to envol-umerate and char-acterize cells with their right angle light scatter and their green fluorescence collected through a 530 ± 30 nm bandpass filter on a FacsCalibur cytometer (Becton Dickinson, San Jose, CA), equipped with an air-cooled argon laser (488 nm). Polycarbonate beads (1.002 µm, Polyscience Europe) were used to normal-ize cell fluorescence and light scattering values. Data were obtained and analyzed with CellQuest software (Becton Dickinson). Acquisition was triggered by green fluorescence. The volume analyzed (and thus cell con-centrations) was calculated by measuring the remain-ing volume and subtractremain-ing it from the initial volume. The sheath fluid was seawater filtered at 0.22 µm.
Nucleic acid extraction. A total of 5 l of seawater was pre-filtered onto 3 µm pore size filters (47 mm Nucleo-pore) before being filtered onto a 0.2 µm Sterivex-GV system (Millipore). The Sterivex filters were frozen at –80°C after addition of 1.8 ml of lysis buffer (EDTA 40 mM; Tris 50 mM pH = 8.3, sucrose 0.75 M) until extraction of nucleic acids. First, cells were lysed by adding 50 µl of lysozyme (1 mg ml–1, final conc.) to the lysis buffer on the filter and incubating at 37°C for 1 h. Next, 100 µl of sodium dodecyl sulfate (10% v/v) and 10 µl of proteinase K were added, and then the prepa-ration was incubated a second time at 55°C for 1 h. The lysate was examined under the microscope to check for complete lysis. Total DNA was extracted with the DNeasy tissue kit (Qiagen) with a modified protocol for marine samples. In brief, an 800 µl volume of lysate was extracted from the Sterivex, to which 800 µl of ethanol (95%) was added to clear the cell lysate before adding 400 µl of AW2 buffer. The final steps of the extraction were conducted by following the instructions of the manufacturer. Total RNA was extracted with an SV Total RNA kit (Promega) modified protocol. A total of 600 µl of lysate was extracted from the Sterivex and cleared with 240 µl of ethanol (95%). The final steps of RNA extraction were conducted using the manufac-turer protocol. Molecular size and purity of the DNA and RNA were analyzed by agarose gel and spec-trophotometry (GeneQuant II, Pharmacia Biotech). DNA removal was controlled by PCR amplification of 1 µl of each RNA sample (PCR conditions described be-low). In these controls, no amplifications were detected. 16S cDNA synthesis. 16S cDNA was synthesized just after total RNA extraction. RNA (2 µg) was incubated for 5 min at 90°C before cooling in a water/ice bath. Twenty units of M-MLV (Roche) was added, with 5 µl of buffer, and 50 µM of primers (Eurogentec). By using
the same protocols, Moeseneder et al. (2001) did not find a chimeric structure after a cloning-sequencing step of obtained cDNA.
PCR, RT (reverse transcription)-PCR and CE-SSCP. Specific bacterial primers were used for PCR and RT-PCR: w49dir (5’-CGGTCCAGACTCCTACGGG-3’; Delbès et al. 1998) and w34rev (5’-TTACCGCGGCT-GCTGGCAC-3’; Lee et al. 1996). Both of these were synthesized commercially (Eurogentec). Primer w34 was fluorescently 5’-labeled with phosphoramidite (TET, Eurogentec). Primers were designed to target a short sequence (around 200 bp) for the best resolution of the CE-SSCP signal (V3 region of 16S rDNA,
Es-cherichia coli positions 329 to 533; Brosius et al. 1981).
Amplifications were performed according to a previ-ously described protocol (Ghiglione et al. 2005). The CE-SSCP analysis used a Genetic Analyzer (Applied Biosystems) and protocols described in Ghiglione et al. (2005). Briefly, each sample was diluted between 2- and 40-fold in sterile water (molecular biology grade, Sigma) to obtain 10 ng µl–1of PCR products. From the diluted solution, 1 µl of PCR product was mixed with 0.1 µl of size standard (GeneScan 400 ROX, Applied Biosystems) and 18.9 µl of deionized formamide (Ap-plera), before heating (94°C, 10 min) followed by rapid cooling in a water/ice bath for 10 min. Samples were electrokinetically injected (5 s, 12 kV) into a capillary (47 cm × 50 µm) filled with polymer solution (5.6% GeneScan polymer gel, 10% autoclaved glycerol and 1× EDTA buffer; Applied Biosystems) and were elec-trophoresed at 12 kV and 30°C for 30 min. The fluores-cently labeled fragments were detected by laser with the virtual filter C (detection wavelengths 532, 537 and 584 nm). Data on the reproducibility of our methods on samples collected at the same station have been previ-ously published (Ghiglione et al. 2005). Similar obser-vations have also been collected by Zumstein et al. (2000). Variation of peak area between normalized similar profiles remained below 5% (data not shown).
Data were collected using ABI Prism 310 collection software (Applied Biosystems). Electrophoregrams were aligned with GeneScan analysis software by fix-ing positions of the internal standard (GeneScan 400 ROX) with a second-order, least-squares curve fit. Peak fingerprints were based on the first derivative of a poly-nomial curve fitted to the data within a window cen-tered on each data point (GeneScan analysis software). As some of the peaks overlapped in the environmental fingerprints we obtained, the polynomial degree was increased to 10 to avoid artifacts in peak enumeration or in peak area estimates and to maximize the sensitiv-ity of peak detection. The peak amplitude threshold ap-plied for both ROX and TET fluorescent dyes was fixed at 50. Peak areas were calculated by the GeneScan analysis software, based on the half-height peak width.
Total area of profiles was normalized to 100, and then the area of each identified peak was expressed as a percentage of the total area of each scan.
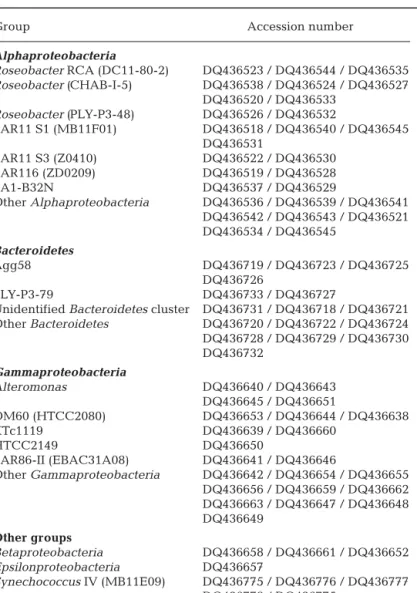
Clone library and SSCP peak assignments. CE-SSCP peaks were assigned using a clone library con-structed from samples taken at the same location on April 1, 2003. Cloning and restriction fragment length polymorphism (RFLP) procedures were performed as previously described (Ferrera et al. 2004), using bacter-ial primers SAdir (5’-AGAGTTTGATCATGGCTC-AGA-3’, Escherichia coli positions 8 to 28) and S17rev (5’-GTTACCTTGTTACGACTT-3’, E. coli positions 1492 to 1508). Among 184 clones, 84 different bacterial phylotypes were determined by RFLP, and 1 representa-tive from each phylotype was sequenced and identified in the GenBank data base using BLAST (www.ncbi. nlm.nih.gov/blast) to obtain their closest phylogenetic neighbors. The phylotypes identified as chimeras were removed from the data set using the RDP-II Chimera Check program (Cole et al. 2005). These sequences were submitted to GenBank under the accession numbers DQ436518 to DQ436545, DQ436638 to DQ436663, DQ436718 to DQ436733 and DQ436775 to DQ436778 (see Table 2). Phylogenetic groups or operational taxo-nomic units (OTUs) were defined at 99% similarity from a ClustalW alignment (500 bp) using the Clusterer soft-ware with the single linkage setting (Klepac-Ceraj et al. 2006). We assigned an environmental fingerprint ob-tained at the sampling point for the same date. Each clone was prepared according to the previously de-scribed protocols for CE-SSCP samples, and then aligned with each other and the environmental profiles using the same size standard as that used for all our environmental fingerprints.
Data analyses. Data were analyzed using 2 soft-ware packages: XLSTAT 2006 (Addinsoft, Paris) and CANOCO (ter Braak 1987) version 4.0. Fingerprints were analyzed by their peak areas, generating an intensity matrix. The similarity matrix was computed using Steinhaus’s similarity index. A canonical corre-spondence analysis (CCA) was used to investigate the variations in the intensity matrix under the con-straint of our set of environmental variables. Signifi-cant variables (i.e. variables that signifiSignifi-cantly ex-plained changes in 16S rDNA and 16S rRNA signals) in our data set were chosen using a forward-selection procedure and 999 permutations. In our analysis, we also introduced time as a variable to determine which proportion of the total variance in the 16S rDNA and 16S rRNA could be thus explained, following the vari-ation partitioning approach described in Borcard et al. (1992). We assumed in this work a unimodal response of species to environmental variations. When a linear response was assumed, the percentage of variation explained was lower (data not shown).
RESULTS
Physical, chemical and biological characteristics of the sampling site
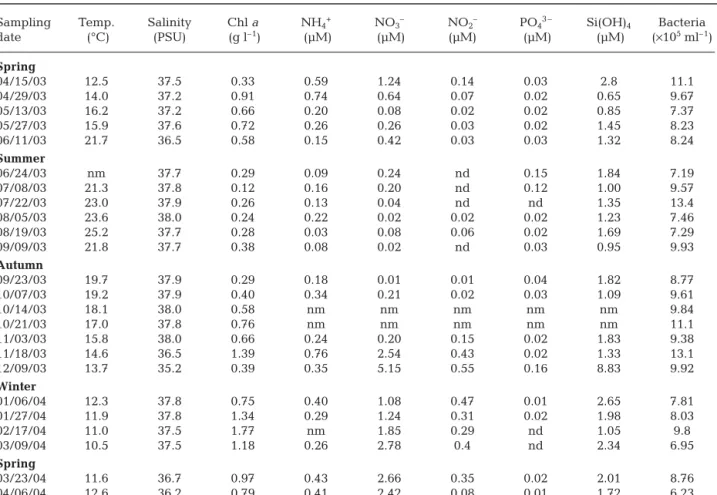
Environmental factors measured over the study pe-riod are reported in Table 1 and are expressed as mean values ± SD. Temperature varied between 11.6 and 21.7°C in spring (15.0 ± 3.5°C), 21.4 and 25.2°C in sum-mer (23.0 ± 1.6°C), 13.7 and 19.7°C in autumn (16.9 ± 2.3°C), and 10.5 and 12.3°C in winter (11.5 ± 0.8°C). Salinity varied seasonally with mean ± SD values of 37.0 ± 0.5 in spring, 37.9 ± 0.1 in summer, 37.4 ± 1.1 in autumn and 37.7 ± 0.2 in winter. Chl a was relatively low in summer (0.3 ± 0.3 g l–1) and highest in winter (1.3 ± 0.4 µg l–1). Average values in spring and autumn were 0.6 ± 0.4 µg l–1and 0.7 ± 0.2 µg l–1, respectively. Nutrients were present at either low or undetectable concentrations in summer (NH4+= 0.1 ± 0.1 µM, NO3–= 0.1 ± 0.1 µM, NO2–= undetectable levels, PO43 –= 0.1 ± 0.1 µM, Si(OH)4= 1.3 ± 0.4 µM). Nitrates, nitrites and silicates reached maximum concentrations in winter
(1.7 ± 0.8, 0.4 ± 0.1 and 2.0 ± 0.7 µM, respectively). Concentrations of ammonium were higher, on aver-age, in spring and autumn (mean 0.4 ± 0.2 µM). Phos-phate concentrations remained low year round, the values being highest in autumn (0.04 µM on Septem-ber 23, 2003) and in spring (0.03 µM on April 15, 2003). Bacterial abundances varied between 6.23 × 10⁵and 1.31 × 10⁶cells ml–1(8.93 ± 1.78 × 10⁵cells ml–1).
Clone library and assignment of the corresponding CE-SSCP profile
CE-SSCP peaks were assigned using a clone library constructed from samples taken at the same location on April 1, 2003. The library coverage was 61% and the total number of phylotypes was estimated to be 139 using the Chao-1 estimator (Chao 1987). Clustering of sequences (99% similarity) revealed 7 major clusters of
Alphaproteobacteria (Roseobacter RCA, Roseobacter
CHAB-I-5, Roseobacter PLY-P3-48, SAR11 S1, SAR11 S3, SAR116, LA1-B32N), 2 major clusters of
Bac-Sampling Temp. Salinity Chl a NH4+ NO3– NO2– PO43 – Si(OH)4 Bacteria
date (°C) (PSU) (g l–1) (µM) (µM) (µM) (µM) (µM) (×105ml–1) Spring 04/15/03 12.5 37.5 0.33 0.59 1.24 0.14 0.03 2.8 11.1 04/29/03 14.0 37.2 0.91 0.74 0.64 0.07 0.02 0.65 9.67 05/13/03 16.2 37.2 0.66 0.20 0.08 0.02 0.02 0.85 7.37 05/27/03 15.9 37.6 0.72 0.26 0.26 0.03 0.02 1.45 8.23 06/11/03 21.7 36.5 0.58 0.15 0.42 0.03 0.03 1.32 8.24 Summer 06/24/03 nm 37.7 0.29 0.09 0.24 nd 0.15 1.84 7.19 07/08/03 21.3 37.8 0.12 0.16 0.20 nd 0.12 1.00 9.57 07/22/03 23.0 37.9 0.26 0.13 0.04 nd nd 1.35 13.4 08/05/03 23.6 38.0 0.24 0.22 0.02 0.02 0.02 1.23 7.46 08/19/03 25.2 37.7 0.28 0.03 0.08 0.06 0.02 1.69 7.29 09/09/03 21.8 37.7 0.38 0.08 0.02 nd 0.03 0.95 9.93 Autumn 09/23/03 19.7 37.9 0.29 0.18 0.01 0.01 0.04 1.82 8.77 10/07/03 19.2 37.9 0.40 0.34 0.21 0.02 0.03 1.09 9.61 10/14/03 18.1 38.0 0.58 nm nm nm nm nm 9.84 10/21/03 17.0 37.8 0.76 nm nm nm nm nm 11.1 11/03/03 15.8 38.0 0.66 0.24 0.20 0.15 0.02 1.83 9.38 11/18/03 14.6 36.5 1.39 0.76 2.54 0.43 0.02 1.33 13.1 12/09/03 13.7 35.2 0.39 0.35 5.15 0.55 0.16 8.83 9.92 Winter 01/06/04 12.3 37.8 0.75 0.40 1.08 0.47 0.01 2.65 7.81 01/27/04 11.9 37.8 1.34 0.29 1.24 0.31 0.02 1.98 8.03 02/17/04 11.0 37.5 1.77 nm 1.85 0.29 nd 1.05 9.8 03/09/04 10.5 37.5 1.18 0.26 2.78 0.4 nd 2.34 6.95 Spring 03/23/04 11.6 36.7 0.97 0.43 2.66 0.35 0.02 2.01 8.76 04/06/04 12.6 36.2 0.79 0.41 2.42 0.08 0.01 1.72 6.23 Table 1. Environmental variables and bacterial abundances collected at the SOLA station (3 m water depth). nd = undetectable
teroidetes sequences (Agg58, PLY-P3-79) and 5 major
clusters of Gammaproteobacteria (Alteromonas, OM60 [HTCC2080], KTc1119, HTCC2149 and SAR86-II [EBAC31A08]) (Table 2).
The bacterial community structure from April 1, 2003 was determined by combining the correspond-ing CE-SSCP fcorrespond-ingerprint with the clone library (Fig. 1). Based on the retention times of the cloned 16S rDNA, we observed that each phylogenetic group had a different migration pattern.
Alphapro-teobacteria clones had the shortest retention times, Gammaproteobacteria clones were detected with the
largest retention times and Bacteroidetes clones were detected in between (except the 2
Gammaproteo-bacteria clones related to the OM60 cluster, which
co-migrated with the Bacteroidetes) (Fig. 1). For the
minor clone groups, 1 Epsilonproteobacteria and 3
Betaproteobacteria clones migrated with retention
times comparable to those observed for Bacteroidetes and Gammaproteobacteria clones, respectively. At a lower phylogenetic rank, all 10 Roseobacter clones and very close relatives migrated closely together. A similar observation was made for the 5 clones affiliated with Synechococcus. Two other ribotypes which appeared dominant on various profiles col-lected during the year are composed of different populations of Alphaproteobacteria, mostly SAR11 and SAR116. Interestingly, the 4 clones belonging to the Bacteroidetes Agg58 cluster and the 3 belonging to the Gammaproteobacteria cluster OM60 also co-migrated, allowing us to assign 2 other peaks in the fingerprints (Fig. 1).
Year-long monitoring of presence/ absence and relative abundance of 16S rDNA and 16S rRNA ribotypes
A total of 54 different ribotypes were observed during the year. Each 16S rDNA fingerprint had between 22 and 35 peaks (29.4 ± 4.0), and between 11 and 30 ribotypes were observed in each 16S rRNA fingerprint (24.4 ± 4.8) (Fig. 2). For both the 16S rDNA and 16S rRNA data sets, the total number of ribotypes varied between 31 and 46 for each sampling date (38.4 ± 4.8 ribotypes) (Fig. 2). Most of the ribotypes were detected in both 16S rDNA and 16S rRNA fingerprints, be-tween 30 and 90% of the ribotypes per sampling date (66.7 ± 13.7%). A ribotype was detected in a 16S rDNA fingerprint but not in the corresponding 16S rRNA fingerprint on average for only 7.6 ± 5.5 ribotypes per fingerprint. A ribotype was detected on a 16S rRNA fingerprint but not in the corresponding 16S rDNA pro-file for only 2.6 ± 1.9 ribotypes per finger-print, on average (Fig. 2).
Interestingly, both 16S rDNA and 16S rRNA fingerprints were dominated all year by 4 ribotypes (Figs. 3 & 4). When considering a specific sampling date, these 4 dominant ribotypes represented between 20 and 80% (48.7 ± 14.9%) of the 16S rDNA fingerprint area, and between 30 and 80% (53.8 ± 17.1%) of the 16S rRNA fingerprints area. There were some large differences between the area of a 16S rDNA ribotype and its area on the
cor-Group Accession number
Alphaproteobacteria Roseobacter RCA (DC11-80-2) DQ436523 / DQ436544 / DQ436535 Roseobacter (CHAB-I-5) DQ436538 / DQ436524 / DQ436527 DQ436520 / DQ436533 Roseobacter (PLY-P3-48) DQ436526 / DQ436532 SAR11 S1 (MB11F01) DQ436518 / DQ436540 / DQ436545 DQ436531 SAR11 S3 (Z0410) DQ436522 / DQ436530 SAR116 (ZD0209) DQ436519 / DQ436528 LA1-B32N DQ436537 / DQ436529 Other Alphaproteobacteria DQ436536 / DQ436539 / DQ436541 DQ436542 / DQ436543 / DQ436521 DQ436534 / DQ436545 Bacteroidetes Agg58 DQ436719 / DQ436723 / DQ436725 DQ436726 PLY-P3-79 DQ436733 / DQ436727
Unidentified Bacteroidetes cluster DQ436731 / DQ436718 / DQ436721 Other Bacteroidetes DQ436720 / DQ436722 / DQ436724 DQ436728 / DQ436729 / DQ436730 DQ436732 Gammaproteobacteria Alteromonas DQ436640 / DQ436643 DQ436645 / DQ436651 OM60 (HTCC2080) DQ436653 / DQ436644 / DQ436638 KTc1119 DQ436639 / DQ436660 HTCC2149 DQ436650 SAR86-II (EBAC31A08) DQ436641 / DQ436646 Other Gammaproteobacteria DQ436642 / DQ436654 / DQ436655 DQ436656 / DQ436659 / DQ436662 DQ436663 / DQ436647 / DQ436648 DQ436649 Other groups Betaproteobacteria DQ436658 / DQ436661 / DQ436652 Epsilonproteobacteria DQ436657 Synechococcus IV (MB11E09) DQ436775 / DQ436776 / DQ436777 DQ436778 / DQ436775
Table 2. Clustering of sequences done with Clusterer at 99% similarity after a ClustalW alignment. Alignment was trimmed to 500 bp before cluster
responding 16S rRNA fingerprints, including the 4 dominant ribotypes. The ratio of 16S rDNA to 16S rRNA area for these major CE-SSCP peaks ranged from 0 to 3 (1.2 ± 0.9) (Roseobacter), 0 to 7 (1.8 ± 1.5)
(Syne-chococcus), 0 to 2 (1.0 ± 0.3) (SAR11)
and 0 to 4 (1.0 ± 0.9) (SAR116) (Figs. 3 & 4). For these 4 dominant ribotypes, some differences were detected be-tween 16S rDNA and 16S rRNA sig-nals during the year-long sampling. For example, in autumn 2003,
Syne-chococcus was detected on 16S rRNA
profiles, but had a relatively low area on 16S rDNA fingerprints. The same phenomenon occurred, but in lower proportions, for Roseobacter and SAR11 in spring and autumn 2003 (Figs. 3 & 4).
Analysis of 16S rDNA data set
Variation partitioning indicated that environmental variables explained 49% of the total variation observed in the 16S rDNA data set (Fig. 5). Sea-sonal groups were well defined by CCA on the basis of calendar dates (Fig. 6). The forward selection of environmental data indicated that 6 of the 9 variables (Table 1) were significantly related to the variation of 16S rDNA ribotypes important in the bacterioplankton community (p < 0.05, vectors in Fig. 6). Bac-terial abundances, inorganic phos-phate and silicate, did not signifi-cantly influence the 16S rDNA signal. The signal was highly correlated to the selected environmental variables (Fig. 5). These variables were divided into 2 groups on axis 1 of the CCA (Fig. 6): temperature and salinity versus NH4+, NO3–, chl a and NO2–, reflecting a strong seasonal signal. In our data set, 36% of the observed
0 0.2 0.4 0.6 0.8 1 Retention time Gamma-proteobacteria (22) Alphaproteobacteria (28) Bacteroidetes(16) OM60 (3) B C A Relative fluor escence 400 600 800 1000 1200 1400 1600 1800 200 Roseobacter (10) Agg58 (4) Synechococcus (5) SAR116 (2) SAR11 (6)
Fig. 1. Assignment of an environmental capillary electrophoresis–single strand conformation polymorphism (CE-SSCP) fingerprint obtained from the April 1, 2003 sample with a clone library created in parallel. The superimposition of the clones on the environmental fingerprint is represented by vertical bars. Clones in-clude A (= Epsilonproteobacteria clone) and B,C (= 2 Betaproteobacteria clones). The number of clones from each bacterial group is indicated in parentheses.
Retention time is in arbitary units
RNA DNA DNA + RNA 0 20 40 60 80 100 04/ 15/ 03 05/ 13/ 03 06/ 1 1 /0 3 07/ 08/ 03 08/ 05/ 03 09/ 09/ 03 10/ 07/ 03 10/ 21/ 03 1 1 /18/ 03 01/ 06/ 04 02/ 17/ 04 03/ 23/ 04 04/ 29/ 03 05/ 27/ 03 06/ 24/ 03 07/ 22/ 03 08/ 19/ 03 09/ 23/ 03 10/ 14/ 03 1 1 /03/ 03 12/ 09/ 03 01/ 27/ 04 03/ 09/ 04 04/ 06/ 04 36 31 33 34 32 31 34 42 39 32 45 42 44 46 44 46 42 42 37 39 40 37 38 36 Per centage of total r ib o ty p e s
Spring Summer Autumn Winter Spring
Fig. 2. Percentage of total ribotypes unique to the 16S rDNA (DNA) or the 16S rRNA (RNA) fingerprints, or common to both (DNA+RNA). Total number of ribotypes indicated at the top of each bar (mean
variance remain unexplained. When time was coded as a variable it explained 27% of the total variance (pure time 15%) (Fig. 5).
Analysis of 16S rRNA data set
Variation partitioning indicated that environmental variables explained 45.7% of total variance present in the 16S rRNA data set (Fig. 5). Patterns similar to those observed for the 16S rDNA dataset were found (Fig. 6). The CANOCO forward-selection process selected the same significant variables (p < 0.05, vectors on Fig. 6) as in the 16S rDNA data set, and the CCA also showed the same separation of environmental variables on the canonical axis 1 (Fig. 6), with temperature and salinity versus NH4+, NO3–, chl a and NO2– reflecting a sea-sonal control of the bacterial activity. The 16S rRNA signal was also highly correlated to the environmental variables (Fig. 5). Variation partitioning indicated that 40% of the observed variance in the 16S rRNA data set remained unexplained. Interestingly, time explained 24% of this variance (pure time 14%) (Fig. 5).
Projection of particular OTUs
CCA allows the projection of sampling dates but also of bacterial ribotypes in the constructed 2-dimensional 0 10 20 30 40 50 60 70 80 90100 Apr May Jun Jul Aug Sep Oct Nov Dec Jan Feb Mar 0 10 20 30 40 50 60 70 80 90 100 DNA RNA
Percentage of total fingerprint area
Roseobacter
SAR116 Synechococcus
SAR11 Other ribotypes 2003
2004
Fig. 3. Dynamics of the 4 dominant CE-SSCP ribotypes
(Rose-obacter, Synechococcus, SAR11 and SAR 116) during the
year-long sampling of 16S rDNA and 16S rRNA fingerprints
0 1 2 3 4 5 6 7 0 1 2 3 4 5 6 7 0 1 2 3 4 5 6 7 0 1 2 3 4 5 6 7
Apr May Jun Jul Aug Sep Oct Nov Dec Jan Feb Mar Apr May Jun Jul Aug Sep Oct Nov Dec Jan Feb Mar Apr May Jun Jul Aug Sep Oct Nov Dec Jan Feb Mar Apr May Jun Jul Aug Sep Oct Nov Dec Jan Feb Mar
Roseobacter Synechococcus SAR11 16S rRNA/16S rDNA ar ea ratio SAR116
Fig. 4. Variation of the 16S rRNA/16S rDNA area ratio for the 4 dominant ribotypes observed in the fingerprints (see Fig. 3)
50 100
0
Variation partitioning - RNA data set
Environmental variance (45.7%)
Temporal structure (24.1%)
Unexplained variance (40%)
Species–environment relationship: 86.3% Total number of canonical axes: 7
Variation partitioning - DNA data set
0 50 100
Environmental variance (48.7%)
Temporal structure (27.4%)
Unexplained variance (36%)
Species–environment relationship: 82.5% Total number of canonical axes: 8
Explained variance: 64%
Explained variance: 60%
Fig. 5. Variation partitioning analysis of 16S rDNA and 16S rRNA data sets. Significant variables, determined following a forward-selection procedure, were temperature, salinity, chl a, ammonium, nitrate and nitrite. For each data set, p < 0.01
04/06/04 03/23/04 03/09/04 02/17/04 01/27/04 01/06/04 12/09/03 11/18/03 11/03/03 09/23/03 08/19/2003 08/05/03 07/22/03 06/24/03 06/11/03 05/27/03 13/05/03 04/29/03 04/15/03 AUTUMN SUMMER SPRING WINTER NO2– NO3– NH4+ Chl a Salinity Temperature F1 (26.4%) F2 (21.2%) 07/08/03 Roseo. Syn. SAR11 SAR116 Agg58 OM60 1.2 1.2 –1.2 1.8 0.6 –1.2 04/06/04 03/23/04 03/09/04 02/17/04 01/27/04 01/06/04 12/09/03 11/18/0310/21/03 10/07/03 09/23/03 08/19/03 08/05/03 07/22/03 06/24/03 06/11/03 05/27/03 13/05/03 04/29/03 04/15/03 SPRING -Chl a Salinity Temperature WINTER SUMMER 09/09/03 11/03/03 07/08/03 1.2 –1.2 F1 (22.8%) Roseo. Syn. SAR116 Agg58 OM60 10/14/03 AUTUMN SAR11 10/14/03 10/21/03 10/07/03 09/09/03
A: 16S rDNA data set
B: 16S rRNA data set F2 (21.1%)
NH4+
NO3–
NO2–
–1.2
Fig. 6. Canonical correspondence analysis on (A) 16S rDNA fingerprints and (B) 16S rRNA fingerprints. Fingerprints are clustered according to the calendar dates of the seasons. (NN) Position of the dominant and of noteworthy ribotypes in the 2-dimensional
space. Roseobacter presence (16S rDNA) and activity (16S rRNA) were linked to spring, and were indepen-dent of temperature (Fig. 6). Synechococcus presence and activity were linked to temperature. The dominant ribotypes, including mainly SAR11 and SAR116 popu-lations, were associated with autumn, in terms of both presence and activity. When considering the other assigned ribotypes, we noticed that the Agg58 and OM60 clades were linked with winter and chl a.
DISCUSSION
In this work, the dynamics of marine bacterial popu-lations and their activity were examined during a year-long study in NW Mediterranean coastal waters. For each sampling date, a 16S rDNA CE-SSCP fingerprint (reflecting the bacterial community structure) was compared to the corresponding 16S rRNA fingerprint (reflecting the active component of the community) and a set of environmental factors. A complementary clone library allowed the identification of some of the members of the studied community.
Each 16S rDNA and 16S rRNA date-ribotype area matrix constitutes a multidimensional data set. Multi-variate analyses were used to represent these data by projecting the fingerprints in a 2-dimensional space using CCA, which calculates axes by maximizing the variance between each fingerprint (Legendre & Legendre 1983). In CCA, the ordination of samples in the 2-dimensional space is constrained by the selected environmental variables (ter Braak 1987). This analysis revealed seasonal patterns in both 16S rDNA and 16S rRNA signals, suggesting a seasonal dynamic of bacte-rial populations and their activities. Similar trends were previously observed with 16S rDNA signals (i.e. Ghiglione et al. 2005, Mary et al. 2006) but no previous studies examined a year-long variation of the 16S rRNA signal. This similar seasonal trend on a 16S rRNA-based level was not surprising because most of the ribotypes (mean 67%) were common to both 16S rRNA and 16S rDNA fingerprints.
The use of variation partitioning analysis in micro-bial ecology to link bacterial community changes with environmental factors is rare (Ramette 2007). Both biotic (chl a) and abiotic (temperature, nutrients) variables had a marked influence on the bacterial community composition (bottom-up effects), consistent with other studies (Schauer et al. 2003, Brown et al. 2005, Fuhrman et al. 2006). Our data indicate that the same set of environmental variables similarly influ-enced bacterial populations and their activities. Never-theless, 40% of the variance in the 16S rDNA and in the 16S rRNA data sets remains unexplained. Some unrecorded environmental variables like dissolved
organic matter (bottom-up effects) (Schauer et al. 2003, Mary et al. 2006), grazer community composition (top-down effects) or viral activity may have affected the bacterial populations and their activities. Interestingly, our partitioning analysis indicated that time also explained a noticeable fraction (pure time, 15%) of the total variance. This result suggests that time alone may partially explain part of the bacterial community structure.
In this study, 4 dominant ribotypes were detected on 16S rDNA fingerprints when considering the average area of each ribotype over the year. The same domi-nant ribotypes were also observed in 16S rRNA finger-prints, which implies that the dominant bacterial popu-lations were also the most active. It is well established that marine bacterial populations are dominated by a few taxa (Giovannoni et al. 1990, Giovannoni & Rappé 2000). However, recent studies have indicated that some of the most abundant and ubiquitous taxa of bac-terioplankton are also very micro-diverse (Acinas et al. 2004, Brown & Fuhrman 2005). Thus, the dominant ribotypes we detected are likely to be a result of the complex signal created by a variety of micro-diverse populations, which could also be physiologically distinct between seasons.
We identified the bacterial populations detected by the CE-SSCP peaks by constructing a clone library that was used to assign peaks to the profiles. Two of the dominant ribotypes detected on our fingerprints were putatively assigned to Synechococcus and
Roseobac-ter. The 2 other dominant ribotypes were composed of Alphaproteobacteria populations, mostly SAR11 and
SAR116. Gammaproteobacteria and Bacteroidetes also represented a large proportion of the bacterial commu-nity, but were distributed within a high number of ribo-types in the fingerprints, suggesting that these bacter-ial populations were diverse and present in low abundences. We are also aware that primers used in the CE-SSCP study can introduce biases (as is the case for any PCR-based methods). It is well established that the available Bacteria primers are not truly universal, as there are some mismatches for certain phylogenetic groups (Baker et al. 2003). Indeed, there are some mis-matches between the w34 primer used in our CE-SSCP protocols and some Bacteroidetes sequences (data not shown). Nevertheless, relative abundances of
Syne-chococcus deduced from the fingerprints were highly
correlated to those determined by flow cytometry (p < 0.05, n = 24), giving strong support to the assignation of the corresponding CE-SSCP peak (data not shown). Such observations also support our assignment proce-dures and reinforce the quantitative analysis of CE-SSCP peaks conducted in this study.
According to the CCA analysis, the Synechococcus ribotype (presence and activity) was correlated to
temperature, as previously reported (Agawin et al. 1998). The Roseobacter ribotype (presence and activ-ity) was detected mostly during spring, as observed by Brown et al. (2005) using an automated ribosomal intergenic spacer analysis-based approach in Californ-ian coastal waters. Interestingly, the presence and activity of the OM60 clade, known to harbor represen-tatives of photoheterotrophic species (Fuchs et al. 2007), was closely correlated with chl a.
Common seasonal trends in the 16S rDNA and 16S rRNA data were found in our observations. However, some discrepancies between 16S rDNA and 16S rRNA signals were also detected. On the one hand, bacterial populations were sometimes present but not active. That is, a ribotype detected in 16S rDNA fingerprints was absent or had a small area for the corresponding ribotype on the 16S rRNA profile, suggesting low abundances of ribosomes per bacterial cell. Some authors who made similar observations have linked these patterns with periods of starvation (Davis et al. 1986, Moyer & Mortita 1989, Fegatella et al. 1998). On the other hand, bacterial populations were sometimes absent or present in low abundances, while their activ-ity clearly appeared in the 16S rRNA fingerprint. That is, a specific ribotype was absent or had a small area on 16S rDNA fingerprints, but appeared on 16S rRNA fingerprints. Such patterns have been previously described in the marine environment, and are identi-fied by the presence of a few abundant cells with a high metabolic potential (Moeseneder et al. 2001, Moeseneder et al. 2005).
Cottrell & Kirchman (2004) observed in Delaware River estuary waters that only 50% of the contribution of bacterial taxa to biomass production could be explained by their relative abundance. Thus, the activ-ities of bacterial populations might be higher or lower than the abundance would predict. Such a result is congruent with the fact that the relationship between 16S rRNA content and growth rate is not linear. During spring 2003, a period of high bacterial production (I. Obernosterer pers. comm.), the ribotype assigned as
Roseobacter was relatively constant and had high 16S
rRNA/16S rDNA ratios. Thus, in spring 2003, the contribution of Roseobacter and SAR11 to the total bacterial production was higher than what could be predicted from their respective abundances. We also observed a similar situation for the functional group of the oxygenic photosynthetic Synechococcus, which is the most abundant cyanobacteria in our coastal sys-tem, and which had a high 16S rRNA/16S rDNA ratio in October 2003, suggesting high activity of this popu-lation at this time of the year. Interestingly, this peak of activity did not correlate with the period when the 16S rDNA and 16S rRNA ribotypes had the largest relative area, which was in summer.
Collectively, these data point out the interest in both 16S rDNA and 16S rRNA fingerprints for moni-toring bacterial dynamics in marine environments. The 16S rDNA fingerprints describe reasonably well the dynamics of a bacterial community structure, while 16S rRNA fingerprints lead to the detection of the largest variations in bacterial activity, in response to environmental changes. Such results also reinforce the use of CE-SSCP as a tool to describe bacterial community structure and activity in long-term moni-toring approaches in the marine environment, which is being done more and more at microbial observato-ries. However, the taxonomic resolution of finger-prints does not allow a fine identification of bacterial taxa which are responsible for the variations, even if a few ribotypes could be putatively assigned to wide-spread bacterial players (Synechococcus,
Roseobac-ter). Nevertheless, the detection of significant
varia-tions in 16S rRNA relative to 16S rDNA fingerprints suggests that all the members of the bacterial com-munity do not participate equally in the flow of car-bon in coastal environments. These results highlight the need to re-evaluate the assumptions in biogeo-chemical cycles models, which implicitly hypothesize that all members of the prokaryotic community con-tribute equally to the flux of matter and energy (Alonso-Saez & Gasol 2007) whatever the season of the year.
Acknowledgements. We thank the captain and the crew of
the RV ‘Nereis II’ for the sample collection. This work was supported by the European program BASICS (Bacterial Single Cell Analysis in the Sea, EVK3-CT-2002-00078). The project was also carried out in the context of the MarBEF Network of Excellence (Marine Biodiversity and Ecosystem Functioning), which is funded by the European Community’s Sixth Framework Programme (contract no. GOCECT-2003-505446). R.L.’s research was supported by a doctoral fellow-ship from the French Research and Education Ministry and the post-doctoral fellowship Lavoisier from the French foreign office. We thank P. Catala and N. Batailler for technical help. We are also grateful to D. L. Kirchman for helpful comments on an earlier version of this manuscript.
LITERATURE CITED
Acinas SG, Klepac-Ceraj V, Hunt DE, Pharino C, Ceraj I, Distel DL, Polz MF (2004) Fine-scale phylogenetic arch-itecture of a complex bacterial community. Nature 430: 551–554
Agawin NSR, Duarte CM, Agustí S (1998) Growth and abun-dance of Synechococcus sp. in a Mediterranean Bay: sea-sonality and relationship with temperature. Mar Ecol Prog Ser 170:45–53
Alonso-Saez L, Gasol JM (2007) Seasonal variations in the contributions of different bacterial groups to the uptake of low-molecular-weight compounds in Northwestern Mediterranean coastal waters. Appl Environ Microbiol 73:3528–3535
➤
➤
➤
➤
➤
Azam F, Fenchel T, Field JG, Gray JS, Meyer-Reil LA, Thingstad F (1983) The ecological role of water-column microbes in the sea. Mar Ecol Prog Ser 10:257–263 Baker GC, Smith JJ, Cowan DA (2003) Review and
re-analy-sis of domain-specific 16S primers. J Microbiol Methods 55:541–555
Borcard D, Legendre P, Drapeau P (1992) Partialling out the spatial component of ecological variation. Ecology 73: 1045–1055
Brosius J, Dull TJ, Sleeter DD, Noller HF (1981) Gene organi-zation and primary structure of a ribosomal RNA operon from Escherichia coli. J Mol Biol 148:107–127
Brown MV, Fuhrman JA (2005) Marine bacterial microdiver-sity as revealed by internal transcribed spacer analysis. Aquat Microb Ecol 41:15–23
Brown MV, Schwalbach MS, Hewson I, Fuhrman JA (2005) Coupling 16S-ITS rDNA clone libraries and automated ribosomal intergenic spacer analysis to show marine microbial diversity: development and application to a time series. Environ Microbiol 7:1466–1479
Chao A (1987) Estimating the population size for capture-recapture data with unequal catchability. Biometrics 43: 783–791
Cole JR, Chai B, Farris RJ, Wang Q and others (2005) The Ribosomal Database Project (RDP-II): sequences and tools for high-throughput rRNA analysis. Nucleic Acids Res 33: D294–D296
Cottrell MT, Kirchman DL (2004) Single-cell analysis of bac-terial growth, cell size, and community structure in the Delaware estuary. Aquat Microb Ecol 34:139–149 Davis BD, Luger SM, Tai PC (1986) Role of ribosome
degra-dation in the death of starved Escherichia coli cells. J Bacteriol 166:439–445
Delbès C, Godon JJ, Moletta R (1998) 16S rDNA sequence diversity of a culture-accessible part of an anaerobic digestor bacterial community. Anaerobe 4:267–275 DeLong EF, Wickham GS, Pace NR (1989) Phylogenetic
stains: ribosomal RNA-based probes for the identification of single cells. Science 243:1360–1363
Fandino LB, Riemann L, Steward GF, Azam F (2005) Popula-tion dynamics of Cytophaga-Flavobacteria during marine phytoplankton blooms analyzed by real-time quantitative PCR. Aquat Microb Ecol 40:251–257
Fegatella F, Lim J, Kjelleberg S, Cavicchioli R (1998) Implica-tions of rRNA operon copy number and ribosome content in the marine oligotrophic ultramicrobacterium
Sphingo-monas sp. strain RB2256. Appl Environ Microbiol 64:
4433–4438
Ferrera I, Massana R, Casamayor EO, Balagué V, Sánchez O, Pedrós-Alió C, Mas J (2004) High-diversity biofilm for the oxidation of sulfide-containing effluents. Appl Microbiol Biotechnol 64:726–734
Fuchs BM, Spring S, Teeling H, Quast C and others (2007) Characterization of a marine Gammaproteobacterium capable of aerobic anoxygenic photosynthesis. Proc Natl Acad Sci USA 104:2891–2896
Fuhrman JA, Hewson I, Schwalbach MS, Steele JA, Brown MV, Naheem S (2006) Annually reoccurring bacterial communities are predictable from ocean conditions. Proc Natl Acad Sci USA 103:13104–13109
Gentile G, Giuliano L, D’Auria G, Smedile F, Azzaro M, De Domenico M, Yakimov MM (2006) Study of bacterial com-munities in Antarctic coastal waters by a combination of 16S rRNA and 16S rDNA sequencing. Environ Microbiol 8:2150–2161
Ghiglione JF, Larcher M, Lebaron P (2005) Spatial and tempo-ral scales of variation in bacterioplankton community
structure in the NW Mediterranean Sea. Aquat Microb Ecol 40:229–240
Giovannoni SJ, Rappé M (2000) Evolution, diversity and molecular ecology of marine prokaryotes. In: Kirchman DL (ed) Microbial ecology of the oceans, Wiley Liss, New York, p 47–48
Giovannoni SJ, Britschgi TB, Moyer CL, Field KG (1990) Genetic diversity in Sargasso Sea bacterioplankton. Nature 345:60–63
Joux F, Agogué H, Obernosterer I, Dupuy C, Reinthaler T, Herndl GJ, Lebaron P (2006) Microbial community struc-ture in the sea surface microlayer at two contrasting coastal sites in the northwestern Mediterranean Sea. Aquat Microb Ecol 42:91–104
Kemp PF, Lee S, LaRoche J (1993) Estimating the growth rate of slowly growing marine bacteria from RNA content. Appl Environ Microbiol 59:2594–2601
Kerkhof L, Ward BB (1993) Comparison of nucleic acid hybridization and fluorometry for measurement of the relationship between RNA/DNA ratio and growth rate in a marine bacterium. Appl Environ Microbiol 59:1303–1309 Klepac-Ceraj V, Ceraj I, Polz MF (2006). Clusterer: extend-able java application for sequence grouping and cluster analyses. Online J Bioinform 7:15-21
Lebaron P, Parthuisot N, Catala P (1998) Comparison of blue nucleic acid dyes for flow cytometric enumeration of bacteria in aquatic systems. Appl Environ Microbiol 64:1725–1730 Lee S, Kemp PF (1994) Single-cell RNA content of natural marine planktonic bacteria measured by hybridization with multiple 16S rRNA-targeted fluorescent probes. Limnol Oceanogr 39:869–879
Lee DH, Zo YG, Kim SJ (1996) Nonradioactive method to study genetic profiles of natural bacterial communities by PCR-single-strand-conformation polymorphism. Appl Environ Microbiol 62:3112–3120
Legendre L, Legendre P (1983) Numerical ecology. Elsevier Scientific Publishing, Amsterdam
Lemée R, Rochelle-Newall E, Van Wambeke F, Pizay MD, Rinaldi P, Gattuso JP (2002) Seasonal variation of bacterial production, respiration and growth efficiency in the open NW Mediterranean Sea. Aquat Microb Ecol 29:227–237 Mary I, Cummings DG, Biegala IC, Burkill PH, Archer SD,
Zubkov MV (2006) Seasonal dynamics of bacterioplank-ton community structure at a coastal station in the western English channel. Aquat Microb Ecol 42:119–126
Moeseneder MM, Winter C, Herndl GJ (2001) Horizontal and vertical complexity of attached and free-living bacteria of the eastern Mediterranean Sea, determined by 16S rDNA and 16S rRNA fingerprints. Limnol Oceanogr 46:95–107 Moeseneder MM, Arrieta JM, Herndl GJ (2005) A
compari-son of DNA- and RNA-based clone libraries from the same marine bacterioplankton community. FEMS Microbiol Ecol 51:341–352
Moyer CL, Mortita RY (1989) Effect of growth rate and starva-tion-survival on cellular DNA, RNA, and protein of a psychrophilic marine bacterium. Appl Environ Microbiol 55:2710–2716
Murray AE, Preston CM, Massana R, Taylor LT, Blakis A, Wu K, DeLong EF (1998) Seasonal and spatial variability of bacterial and archaeal assemblages in coastal waters near Anvers Island, Antartica. Appl Environ Microbiol 64:2585–2595
Muyzer G, de Waal EC, Uitterlinden AG (1993) Profiling of complex microbial populations by denaturing gradient gel electrophoresis analysis of polymerase chain reaction-amplified genes encoding for 16S rRNA. Appl Environ Microbiol 59:695–700
➤
➤
➤
➤
➤
➤
➤
➤
➤
➤ ➤➤
➤
➤
➤
➤
➤
➤
➤
➤
➤
➤
➤
➤
➤
➤
➤
➤ ➤➤
➤
➤
➤
➤
➤
➤
➤
➤
➤
➤
➤
➤
➤
➤
Pinhassi J, Simó R, González JM, Vila M and others (2005) Dimethylsulfoniopropionate turnover is linked to the com-position and dynamics of the bacterioplankton assem-blage during a microcosm phytoplankton bloom. Appl Environ Microbiol 71:7650–7660
Ramette A (2007) Multivariate analyses in microbial ecology. FEMS Microbiol Ecol 62:142–160
Reinthaler T, Herndl GJ (2005) Seasonal dynamics of bacter-ial growth efficiencies in relation to phytoplankton in the southern North Sea. Aquat Microb Ecol 39:7–16
Schauer M, Balagué V, Pedrós-Alió C, Massana R (2003) Sea-sonal changes in the taxonomic composition of bacterio-plankton in a coastal oligotrophic system. Aquat Microb Ecol 31:163–174
ter Braak CJF (1987) CANOCO: a FORTRAN program for canonical community ordination by [partial] [detrended] [canonical] correspondence analysis, principal compo-nents analysis and redundancy analysis. Agricultural Mathematics Group, Wageningen
Troussellier M, Schäfer H, Batailler N, Bernard L and others (2002) Bacterial activity and genetic richness along an estuarine gradient (Rhone River plume, France). Aquat Microb Ecol 28:13–24
West NJ, Obernosterer I, Zemb O, Lebaron P (2008) Major differences of bacterial diversity and activity inside and outside of a natural iron-fertilized phyto-plankton bloom in the Southern Ocean. Environ Microbiol 10:738 – 756
Zubkov MV, Fuchs BM, Archer SD, Kiene RP, Amann R, Burkill PH (2001) Linking the composition of bacterio-plankton to rapid turnover of dissolved dimethylsulpho-niopropionate in an algal bloom in the North Sea. Environ Microbiol 3:304–311
Zumstein E, Moletta R, Godon JJ (2000) Examination of two years of community dynamics in an anaerobic bio-reactor using fluorescence polymerase chain reaction (PCR) single-strand conformation polymorphism analysis. Environ Microbiol 2:69–78
Editorial responsibility: Jed Fuhrman, Los Angeles, California, USA
Submitted: May 6, 2008; Accepted: October 23, 2008 Proofs received from author(s): February 9, 2009