HAL Id: hal-01323208
https://hal-agroparistech.archives-ouvertes.fr/hal-01323208
Submitted on 30 May 2016
HAL is a multi-disciplinary open access archive for the deposit and dissemination of sci-entific research documents, whether they are
pub-L’archive ouverte pluridisciplinaire HAL, est destinée au dépôt et à la diffusion de documents scientifiques de niveau recherche, publiés ou non,
Heterogeneous efforts in voluntary programmes on food
safety
Elodie Rouviere, Raphael Soubeyran, Céline Bignebat
To cite this version:
Elodie Rouviere, Raphael Soubeyran, Céline Bignebat. Heterogeneous efforts in voluntary programmes on food safety. European Review of Agricultural Economics, Oxford University Press (OUP), 2010, 37 (4), pp.479-499. �10.1093/erae/jbq037�. �hal-01323208�
Heterogeneous Efforts in Voluntary Programmes
on Food Safety.
Elodie Rouviere; Raphael Soubeyran
†and Céline Bignebat
‡Abstract
In this article we discuss the efforts made by importers of fresh produce within a voluntary programme on food safety. We show theoretically that the larger the rms the lower their efforts directed at food safety. We test this proposition using original primary data from a voluntary programme implemented by French im-porters of fresh produce. Our results contrast with evidence from environmental economics that large rms are more likely to be proactive with respect to environ-mental safeguards.
Keywords: Food Safety, Safety Effort, Voluntary Programme. JEL: Q18; L5; D81
Corresponding author: Agrosup Dijon-CESAER, 26 bd Dr Petitjean 21 079 Dijon, France. E-mail: [email protected].
†INRA-LAMETA, Montpellier, France. ‡INRA-MOISA, Montpellier, France.
1 Introduction
Past food scares have prompted the development of voluntary programmes on food safety being promoted by public authorities and voluntarily implemented by food opera-tors. Food operators (producers, handlers, retailers) have voluntarily adopted individual or collective quality management systems to guarantee food quality and/or safety and promote public health. For example, 10 years ago the British Egg Industry Council introduced the Lion Quality Scheme which sets high standards of food safety and ani-mal welfare and currently accounts for 85% of egg production in the United Kingdom.1
More recently, in 2007, the California Department of Food and Agriculture approved the California Leafy Green Products Handler Marketing Agreement which gathers to-gether 71 handlers who represent more than 99 % of all California leafy green produc-tion. Once in the agreement handlers commit to handling California products only from growers who can show that they follow good agricultural practices and use a traceability system (Calvin, 2007). In France, voluntary programmes have been developed in the import industry of fresh produce. In 2001, in Perpignan2 (south of France) importers negotiated with public authorities to introduce a voluntary safety programme to bet-ter check the safety (the amounts of pesticide residues) of fresh produce that enbet-ter the French market and thus the European Union.
In this article we investigate why rms adopt differentiated behaviour in voluntary programmes on food safety by developing an analytical framework and making a theo-retical prediction. We consider a risk averse importer who is uncertain about the safety of fresh produce he markets and therefore decides to monitor some boxes to be sold. To do so, he conducts laboratory analyses to check if there are pesticide residues on produce. Indeed, food safety in the French fresh fruit and vegetables industry relies on Maximum Residue Limits (MRLs) for pesticides. The importer's safety effort increases the probability that each box will pass successfully through all the steps in the supply chain (wholesaler, retailer) to the consumer, without any safety failure. We show the-oretically that the larger the rm the lower the safety effort. We test this theoretical prediction using primary data collected in 2006 for importers of fresh produce who
par-1Source: http://www.britisheggindustrycouncil.com. Accessed 20 September 2010.
2In 2004, France imported 2.7 tons of fresh produce through 3 imports market. The Perpignan market
accounts for 50.8% of this volume, followed by the market Rungis (34.4%) and the market in Marseille (14.8%). Source: www.saintcharlesinternational.fr. Accessed 20 September 2010.
ticipate in the voluntary programme of the Perpignan import market. We thus estimate the determinants of their safety effort according to several rm characteristics (size, supplier, customer, etc.). Our empirical setting validates the negative link between rm size and the level of safety effort.
As far as we know, the theoretical literature on quality management in supply chains has not yet analysed the link between rm size and the level of monitoring. Indeed, scholars mostly focused on the design of contracts and inspection policies of a single product in the presence of moral hazard (see Reyniers and Tapiero, 1995a and 1995b and Starbird, 2005). By contrast both theoretical and empirical studies in environmental economics have established that rm size in uences rm environmental efforts. Most of these studies analyse whether rm size (total sales or number of employees) explains the rm's participation in a voluntary programme. They show that the larger rms are more likely to participate in environmental voluntary programmes. However, interpretations of this size effect vary across studies. Arora and Cason (1995) evaluate why polluting rms participate in one of the most important voluntary programmes implemented in the US by the Environmental Protection Agency (EPAs 33/50 program). They underline that larger rms have the ability to in uence the design of standards and thus to preempt regulatory threats. Scheffman (1992) suggests that this strategy allows rms to increase the costs for smaller rivals to achieve competitive advantage in the market. Grolleau et al. (2007) in a study of the agro-food industry looked at the incentives for French food operators to improve their environmental efforts through a certi cation process. They show that the larger the food operator the more likely he will make environmental ef-forts to improve his on-site management. Some research argues that greater visibility to consumers might explain voluntary environmental efforts. Videras and Alberini (2000) analyse the types of rms that participate in three voluntary environmental programmes (EPAs 33/50 program, Waste Wise Program, Green Lights Program). Regardless of the programme, the authors show that larger rms are more likely to participate in these schemes because they are more visible to consumers than small rms. King and Lenox (2000) have obtained a similar result in their analysis of the participation of chemical rms in the chemical industry's Responsible Care Program. Some research argues that the presence of economies of scale in environmental effort explains the size effect (Das-gupta et al. (2000), King and Lenox (2000)). DeCanio and Watkins (1998) establish that the implementation of environmental efforts may imply xed costs that could explain
the size effect.
The originality of our article is twofold. First, to our knowledge, our contribution is one of the rst econometric analyses on the determinants of safety efforts from food operators in a voluntary programme. Food safety is a sensitive topic, such that nding adequate data is often very dif cult. Our dataset is the only one to combine both data on French importers characteristics (size, suppliers, customers) and on the number of pesticide residue analyses. Second, this novelty in data and topic leads us to contrast with the ndings of a positive in uence of size. Indeed, the case made in previous studies is absent in our context. Importers don't have any reputation on the end market. Also, they don't bene t from economies of scale in monitoring the level of pesticides residues on produce. Moreover, since we focus on a safety hazard which does not induce cross-contamination, small rms are in a riskier situation than large rms and therefore make greater safety effort.
The article is organised as follows: Section 2 presents the model, the benchmark sit-uation (risk neutral importers) and sets out our main theoretical proposition (risk averse importers). Section 3 describes the empirical context, the data and the econometric analysis. Section 4 provides conclusions.
2 Analytical framework
We consider an importer who can sell n boxes of imported produce because of its ca-pacity constraint (size of his warehouse).3 The boxes are packed by foreign suppliers
who send fresh produce to importers. A box contains one kind of fresh produce, for in-stance citrus fruit, tomatoes, strawberries, etc. The safety of the produce is determined by the activities of the grower (who may spray too much pesticides) and importers do not have any information on the grower's production practices. Thus, a percentage of the boxes the importer receives may contain levels of pesticide residues above the maxi-mum levels de ned by the law (unsafe boxes). The remaining boxes do not (safe boxes). Therefore, for the importer the percentage of safe boxes (and then the percentage of un-safe boxes) is exogenous. There isn't any cross-contamination between boxes, as the type of food safety hazard we consider is pesticide residues (compared with
microbi-3We assume this constraint is binding. Empirically, this assumption is realistic because importers
ological contamination e.g. Salmonella). Therefore, the occurrence of a safety failure (a given box of produce found to be unsafe) is independent4across boxes. In order to
check the safety of the produce, the importer runs pesticide residue laboratory analyses on a random sample of boxes. If the importer detects a box as unsafe, he will be able to replace it at insigni cant costs. Indeed, any importer can easily nd any quantity of produce they need. There are always more boxes of produce available on the market than the number needed by importers because some boxes of produce reach the market without any addressee.
The importer, as a broker, receives a commission for each box he sells. However the importer can sell unsafe boxes (he has not checked them or has not detected them as unsafe). In such a case, there is a probability that a public authority, one of the downstream operators or a consumer (thereafter a 'third party') detects a product defect. In the fresh produce industry, full traceability is mandatory:5 when a third party detects
a box as unsafe the importer will receive no commission.
2.1 The model
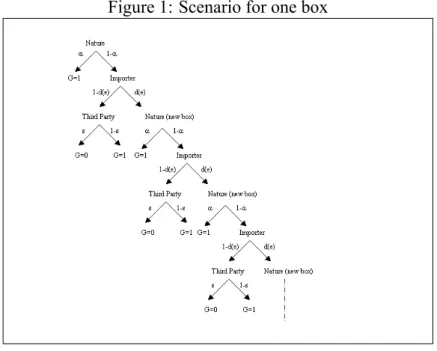
For each of the boxes the importer receives, the scenario is the following (see Figure 1): (1) the importer receives a box of produce. For this box, there is some exogenous probability, 0 < α < 1, that it is safe. (2) The importer makes some effort, e 0, to discover if the box is safe. The probability that an unsafe box is detected as unsafe by the importer is d (e) and depends positively on the effort e with d0(e) > 0. In other words
the greater the effort the higher the chance to detect unsafe boxes. The technology is such that it never incorrectly reports a safe box to be unsafe. However, an unsafe box can be reported as safe.6 If the importer detects an unsafe box, either he returns the box
4A box corresponds to a given producer, a given plot of land (that is homogeneous soil and climate)
and a given day of harvest.
5Mandatory full traceability suggests that there might be some notion of reputation for importers
through the records of their failures by retailers. However, according to our qualitative survey among importers and retailers, importers do not have any reputation with retailers and retailers do not record importers' safety failures (which are not numerous). Further research would be necessary to understand why there isn't any notion of safety reputation.
6The detection technology (at any step) is imperfect and even when checks reveal no default this does
to the foreign sender or he destroys it.7 In this situation, the foreign sender supports
all the costs induced. That is the costs of handling the box, the costs of analyses and the costs of return to sender or destruction. In such a case, the importer substitutes the default box by a replacement (new) box.8 The scenario for this new box starts at point
(1). The box is safe with probability α and so on and so forth. The importer sells the boxes he does not report as unsafe. (3) Those boxes being sold can be inspected by a third party. We de ne s ε (0;1) as the probability that an unsafe box is detected as unsafe by a third party. The importer will receive a commission (G in Figure 1) for each box sold without any detected safety failure. He will receive zero for each box sold and detected as unsafe by a third party.9
Figure 1: Scenario for one box
7At this stage, our results will not be affected if we consider that the importer can choose whether to
send back or to destroy the box.
8At this stage, our results will not be affected if we assume that the importer can choose whether to
replace the box or not.
9Here we assume that once the importer has sold a box he is unable to say if the box has been analysed
or not: the recording system (of analysed products) is imperfect. It might be more costly for the importer (search, organisational and transactions costs) to recoup the testing costs (300 EUR) once he has sold the box than to assume them. If we had assumed that the recording system worked perfectly, once a third party had detected an unsafe box, the importer would have been able to recoup the testing costs. Leaving out the latter assumption doesn't change our result. Proofs are available from the authors upon request.
This scenario allows us to de ne p the probability (for each box) that the importer receives a commission normalised to 1. This probability is given by
p = (α + (1 α)(1 d (e))(1 s))
+∞
∑
j=0[(1 α ) d (e)]j (1)
In order to explain equation (1), let us build it step by step. We consider an importer who has a capacity of one box. We calculate the probability for this importer to get a commission G = 1 when he is not able to replace an unsafe box by a new one, when he has the ability to replace the box once and when he has the ability to replace it twice. First, we examine the case of an importer who has not the ability to replace the box if he detects the box as unsafe. The importer will receive a commission only if the produce is safe or if the produce is unsafe but not detected as unsafe by himself or by a third party in the supply chain. In this situation the probability to get a commission is given by p0= α + (1 α ) (1 d (e))(1 s). Second, consider an importer who has the ability to replace once a box he detects as unsafe. The probability to get 1 becomes p1 =
p0+ (1 α ) d (e) p0, where (p0) refers to the probability that the box is sold without
any reported detection, while the term (1 α)d (e) p0 refers to the probability that the
box is detected as unsafe by the importer and has been replaced by a new box, that is then sold without any reported detection. Third, imagine that the importer can replace the box at most twice: he detects the rst box as unsafe and he replaces it by a new one. The importer also reports this second box as unsafe and he changes it for a third one. The third one is sold and has not been detected as unsafe by a third party. Therefore, the probability becomes: p2 = p0+ (1 α ) d (e) p0+ ((1 α ) d (e))2p0. To get the
probability p in equation (1), we keep on this reasoning up to the situation where the importer will replace a box each time he detects it as unsafe.
The probability p is also the probability that a box sold by the importer passes through all the steps of the supply chain. It can be rewritten as
p = α + (1 α ) (1 d (e))(1 s)
and this probability p increases with respect to e: ∂ p ∂ e = α s (1 α ) d0(e) (1 (1 α ) d (e))2 >0: (3)
The greater the safety effort the importer makes, the higher the chance for a box to reach the consumer without any safety defect. As suggested in equation (2), p de-pends on α which is in uenced by production practices from upstream suppliers and on s which is in uenced by downstream operators. We assume that p also depends on additional parameters which we will specify in the empirical part (the adoption of a quality management system, etc.). We then de ne X as a vector which includes α, s and these additional parameters. We assume that those parameters do not affect the marginal effect of effort and then ∂ p
∂ e >0 still holds. Formally,
p p(e;X) (4)
In our empirical analysis, the cost per laboratory analysis is constant, therefore in our setting the cost of running n e pesticide residue analyses is linear, with marginal cost being c > 0. In addition, the cost of handling n boxes is C (n). As we have already mentioned, the importer only assumes the costs for the boxes he is going to sell.
We can now de ne the expected utility of an importer who has a capacity of n boxes. Let k be a random variable for the number of boxes the importer has sold and which pass through all the steps in the supply chain without any detected safety failure, i.e. k represents the total commission. In other words, k is the number of successes in a random experiment (repeated n times) with a binomial probability of success p. The probability that k boxes among n pass successfully through all the steps in the supply chain without any detected default is given by nk (p (e; X ))k(1 p (e;X))n k where
n
k = k!(n k)!n! .
Let u denote the importer's utility function (as a function of his total commission), with u (0) = 0, u0>0 and u00 0. The importer's objective is to maximise his expected
max e Eu (n;e;X) = n
∑
k=0 n k (p (e; X )) k (1 p (e;X))n ku (k) (5) cne C (n):To illustrate equation (5), let us calculate the utility of an importer who has a ca-pacity of 2 boxes. With a probability (1 p (e;X))2; the two boxes are detected by the third party as unsafe and the importer obtains a utility of u (0) = 0. With proba-bility 2p (e;X)(1 p (e;X)), the third party reports either the rst box as unsafe and the second box as safe, or he reports the rst box as safe and the second one as un-safe. In this situation, the importer obtains a utility u(1) for the box which passes through the supply chain. With probability (p (e;X))2 none of the two boxes are re-ported as unsafe by the third party and the importer obtains u(2). Therefore, the ex-pected utility of the importer who has sold 2 boxes can be written: Eu (2;e;X) = 2p (e;X)(1 p (e;X))u (1) + (p (e;X))2u (2) 2ce C (2). Equation (5) is the gen-eralisation of this formula for an importer who has a capacity of n boxes.
2.2 Importers and safety efforts
First we develop the case of a risk neutral importer in order to provide a benchmark to sustain the risk averse case. Let the importer's utility function u, be linear, u (k) = γ k + µ , with γ > 0. e (n; X ) denotes the optimal effort of the importer, n and X being given. Therefore, the following result holds:
Proposition 1 When the importer is risk neutral, the optimal effort e does not depend on the number of boxes he sells, e (n + 1;X) = e (n;X).
(The proof is reported in Appendix 1.) For a risk neutral importer the bene ts and costs increase proportionally relative to the number of boxes he sells, n.
Next, we analyse the situation when the importer is risk averse focusing on Constant Absolute Risk Aversion (CARA) utility functions, i.e. u is such that,
where δ > 0 and a = uu000 >0 is the Arrow-Pratt measure of absolute risk aversion of the importer. In this situation, we assume that for all n there exists an interior optimal effort e (n;X). Therefore, the following result holds:
Proposition 2 When the importer is risk averse (a > 0), e (n + 1;X) < e (n;X). Namely, the higher the number of boxes, the lower the safety effort.
(The proof is reported in Appendix 1.) Proposition 2 suggests that an increase in the number of boxes increases diversi cation of the risk. In other words, an importer who sells a small number of boxes is in a more risky situation than an importer who sells a higher number of boxes. If the importer is risk averse, then, the higher the level of risk diversi cation, the lower the safety effort.
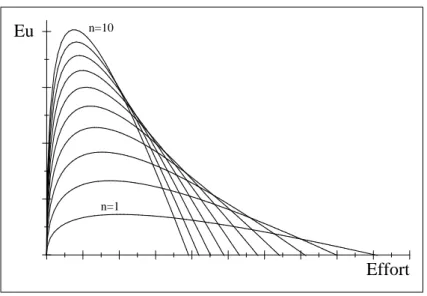
Let us illustrate this insurance effect with a simple example that involves two im-porters. Importer A has a capacity of one box. He faces the following situation: either his box passes all the steps in the supply chain with a probability p and he receives a commission of 1, or, with a probability (1 p) the box is detected by a third party as being unsafe and no commission is forthcoming. Importer B has a capacity of two boxes of produce. He faces three potential situations: i) the two boxes pass all the steps in the supply chain and he receives a commission of 2; ii) the two boxes are detected as being unsafe and there is no commission; iii) only one of the two boxes is safe, which means he will receive a commission of 1. It is the potential for the third situation to occur that provides an insurance effect. Figure 2 illustrates Proposition 2. It represents the expected utility as a function of the importer's effort when the number of boxes varies between 1 and 10.
Figure 2: Expected utility, effort and size.
Effort
Eu n=10
n=1
Speci cation: p (e;X) =0:5+pepe , α = 0:5, β = 5, a = 0:5, c = 0:5, and C (n) = 0
Complementary comparative statics: Let X = (xi)i=1;:::;t. The effect of a marginal
change in the characteristics xion the optimal effort e (n;X) is,
∂ e ∂ xi = ∂2Eu ∂ e∂ xi ∂2Eu ∂ e2 : (7)
Therefore, for CARA utility functions with a > 0, we obtain: ∂ e ∂ xi ∝ ∂2p ∂ e∂ xi (n 1)(1 exp ( a)) 1 (1 exp ( a)) p ∂ p ∂ e ∂ p ∂ xi: (8)
We illustrate this with an example that we develope in the empirical section. Con-sider the importer's propensity to work with supermarkets ((SupM), in the empirical part). Supermarkets are most of the time assumed to have strict safety standards and thus are more likely to detect unsafe products (Fulponi, 2006). According to this fact, we can assume that the propensity to work with supermarkets increases s. According to
equation (8), the effect of an increase in s on the optimal effort is ∂ e ∂ s ∝ α (1 α ) d0(e ) (1 (1 α ) d (e ))2 (9) +(n 1)(1 exp ( a)) 1 (1 exp ( a)) p α s (1 α )2d0(e ) (1 d (e )) (1 (1 α ) d (e ))3 ; Therefore, ∂ e
∂ s >0. To protect himself against the risk that supermarkets detect unsafe
boxes, the importer would provide a greater level of safety effort. In other words, the importer's propensity to work with supermarkets increases his level of safety effort.
We have just dealt with the behaviour of a risk averse importer who monitors boxes of produce in an industry where cross-contaminations are highly unlikely and monitor-ing costs are linear. In the empirical section, we test our second theoretical prediction with primary data on the monitoring behaviour of French importers of fresh produce because this context ts with the previously mentioned assumptions. Indeed, it was im-possible to nd a good proxy for risk aversion and we were then not able to segment the sample into risk-neutral and risk-averse importers and then to compare the results predicted by the two propositions within a sample consisting of both kinds of importers. An implicit assumption behind our empirical model is that all importers are risk averse.
3 Evidence from the French fresh produce imports
in-dustry
3.1 Context
3.1.1 French safety regulation related to pesticide residues
The de nition of food safety for fresh fruit and vegetables in France relies on the MRLs set by the European authorities (Regulation (EC) No 396/2005) or French law (Decree 04/08/1992, as amended). Residues found in or on produce are judged, according to these laws, as being above, at or below the limit. Safety of fresh fruit and vegetables in France and in Europe is one-dimensional, as opposed to the United States where regulation on the safety of those produce also refers to the presence of microbiological hazards such as Salmonella, etc.
All French food operator (producers and importers) must comply with a 'perfor-mance standard', as de ned in Henson and Caswell (1999): the food product they mar-ket should reach the prescribed product quality standards and/or safety levels. How they do reach the standard is left to the discretion of the food operators. In French law, im-porters are considered as producers, because they are the very rst to introduce foreign produce into the national market.10 Importers of fresh produce are thus liable under criminal law if produce do not comply with the regulations in force.
The DGCCRF (General Service for Consumption, Competition and the Repression of Fraud), the public agency in charge of enforcing law and monitoring food safety, mostly conducts regular on-site and product-oriented inspections. In the case of fresh produce, samples are collected and laboratory analyses are carried out to check that residue levels are within the legal limits. In an of cial inspection, inspectors randomly select a box of fruit or vegetables, take one or two pieces of the produce as a sample of the box and send them to the of cial laboratory which conducts multi-residue analyses. If excess levels are found, importers are found guilty of an offence. Sanctions range from a warning letter to prosecution and nes. Warning letter and nes are the most common sanctions used by the public agency while prosecutions are quite rare. In the same time, the whole box of the incriminated produce is taken off the market.
3.1.2 Laboratory analyses
The producer is the only person in control of pesticide use during the production and post-harvest periods and, thus, the only person who is able to reduce the risk of excess pesticide residues in or on produce. The remaining downstream operators can adopt two courses of action: i) they can impose codes of good agricultural practices, like Global GAP systems, on producers; ii) they can conduct laboratory analyses to check the safety of produce they enter on the market.
In 2001, European Regulation (EC) No 178/2002 was issued, and imposed greater responsibility on food operators for monitoring and provision of food safety. In response to this requirement which came into force in 2007, French importers of fresh produce started to order laboratory analyses to check the safety of their produce (Codron et al., 2007). However, the French regulation remains in force and importers continue to have
to abide by the performance standard whatever other efforts they have introduced to monitor safety.
3.1.3 The voluntary safety programme of Perpignan
Our empirical analysis focuses on the voluntary programme that French importers de-veloped and initiated in 2001 in order to better comply with the new European food safety regulation. Before 2001, few French importers ordered laboratory analyses to detect levels of pesticide residues.11
The most important motivation of the negotiation was to achieve a speci cation rather than a performance standard. For the importers participating in the programme, there is a gap between the letter of the law and its enforcement. In the event of a safety failure an importer that subscribes to the programme will be considered by public authorities as having acted in good faith, and a negligence based rule will apply. This is the main commitment of the public authorities in recognising the programme: the programme allows participants to be found liable (under a strict liability rule) if and only if they have failed to take due care (no analysis). Membership in the programme provides rms with other advantages. The frequency of public controls is reduced.12
Also, customs clearance at the border is quicker (for produce from Morocco), since inspection by French customs is waived.
There are 98 rms operating on the Perpignan imports market, 66 of whom were members of the programme in 2006; 61.5% of the 66 members joined the programme the rst year.
The goal of this voluntary programme is to achieve better levels of safety of fresh produce entering the French market. As a condition of joining the voluntary programme, importers must carry out individual laboratory analyses and must assign an employee to manage quality control. The voluntary safety procedure is based on the principles of the Hazard Analysis Critical Control Point method (HACCP). Importers must set out a sampling plan for fresh produce at the beginning of every year, based on the volumes and types of produce being imported. In terms of the type of produce, importers must identify fruit and vegetables that are more likely to show excess pesticide residues (e.g.,
11According to the qualitative survey conducted in 2004 by one of the authors prior to data collection. 12According to the same qualitative survey with public authorities conducted in summer 2004.
strawberries). The risk of pesticide residue levels being exceeded varies widely accord-ing to the produce and country of origin - in our case, mostly Spain and Morocco. In terms of produce, importers do not usually specialise in the sale of only one or two prod-ucts: for more than eight out of ten rms less than half of their total sales is represented by one product type and they target all their produce for analyses.
The programme requires one analysis for 1 million EUR of sales. In other words, the 'theoretical' effort in the programme should be identical for all importers whatever their size and would equal 1. We will see below this is not the case for some surveyed rms. The importers board gathers information on the number of analyses conducted by the rms participating in the programme. However, this is not made publicly available and remains a sensitive topic. Thus, retailers, wholesalers, public authorities and consumers have no information on (one importer) individual safety effort.
There are costs involved in joining the programme: rms have to pay an annual sub-scription fee of 1,000 EUR and they also have to allocate human and nancial resources to monitoring. Pesticide residues analyses are costly: 300 EUR for one multiresidue analysis of pesticides. The marginal cost of the analysis is thus constant and importers carry out at most one analysis per box of produce.
In the event of a safety defect, importers will have to report the results to the public authorities, and the whole box of the incriminated produce will be removed from the market. Only results that exceed the legal MRLs need to be reported.
3.2 Survey & Data
We conducted our survey during the summer 2006 covering the whole sample of rms (66 members) participating in the Perpignan voluntary safety programme. We also col-lected data from 12 rms that did not subscribe to the programme, none of which con-duct any laboratory analysis. These rms represent 40% of the rms that are not part of the programme, and 12% of the whole sample of rms operating in the Perpignan market. The remaining 20 rms declined to answer our questionnaire. Firms that do not belong to the voluntary programme cannot reduce their risk of being ned even if they do conduct laboratory analyses. Only participants in the voluntary scheme bene t from the due care clause.
rm situation in 2005, and particularly about characteristics such as total amount of sales, main produce, specialisation, resources allocated to safety controls, and also about their operating environment (procurement and suppliers, customers).13 Our
question-naire also included some questions about the rm's perception of the pressure exerted by public authorities and their main customer with respect to safety issues.
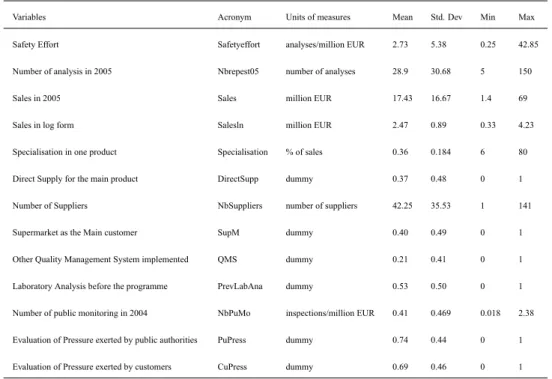
For our empirical framework, we are interested in what determines differentiated behaviour within the voluntary programme. Therefore our underlying population is the exhaustive sample of rms that participate in the safety programme (see table 1 for descriptive statistics).14
Table 1: Descriptive statistics (62 observations)
Variables Acronym Units of measures Mean Std. Dev Min Max Safety Effort Safetyeffort analyses/million EUR 2.73 5.38 0.25 42.85 Number of analysis in 2005 Nbrepest05 number of analyses 28.9 30.68 5 150 Sales in 2005 Sales million EUR 17.43 16.67 1.4 69 Sales in log form Salesln million EUR 2.47 0.89 0.33 4.23 Specialisation in one product Specialisation % of sales 0.36 0.184 6 80 Direct Supply for the main product DirectSupp dummy 0.37 0.48 0 1 Number of Suppliers NbSuppliers number of suppliers 42.25 35.53 1 141 Supermarket as the Main customer SupM dummy 0.40 0.49 0 1 Other Quality Management System implemented QMS dummy 0.21 0.41 0 1 Laboratory Analysis before the programme PrevLabAna dummy 0.53 0.50 0 1 Number of public monitoring in 2004 NbPuMo inspections/million EUR 0.41 0.469 0.018 2.38 Evaluation of Pressure exerted by public authorities PuPress dummy 0.74 0.44 0 1 Evaluation of Pressure exerted by customers CuPress dummy 0.69 0.46 0 1
We approximate the number of boxes by the total amount of sales (in million EUR) in 2005 – variable (Sales). Firm sales (size) range from 1.4 million EUR up to 69 million EUR with a mean at 17.43 million EUR and a standard deviation of about 100% of the average. The bottom of the distribution includes a high number of small rms and the median is less than 10 million EUR.
13The survey is available upon request.
14Descriptive statistics are for the observations in the estimation (62/66 rms) because of missing
The absolute number of laboratory analyses carried out by importers in 2005 (Nbrepest05) is 28.9 on average, ranging from 5 to 150. Firms are concentrated at the lower end of the distribution with 75% of rms reporting less than 30 analyses. There is also wide diver-sity in importers' behaviour (in doing analyses): the standard deviation of this variable is 106.1%. The importer's safety effort (Sa f etye f f ort) relative to rm size, namely the ratio (Nbrepest05=Sales) varies widely, from 0.25 to 42.85 (number of analyses per million EUR). We observe that 15 out of 66 members don't comply with the rule of one analysis per 1 million EUR of sales. Nonetheless, we know that those rms are still in the programme today. This observation might reveal that the rule is not strictly enforced. However, we would need more data to conclude that this behavior persists over time. The effort made by importers widely differs from one to each other: the average behaviour is 2.73 analyses per million EUR, the median being 2 and 90% of rms reporting less than 3.8 analyses per million EUR. Because of this fact, we decide to establish the real nature of the link between rm effort and size and to highlight the determinants of this safety effort.
3.3 Econometric Analysis
In this section, we study the determinants of the rms' safety effort for importers who participate in the voluntary programme.15 We test the following model:
ln (Sa f etye f f orti) = θ0+Wi0θ1+ εi (10)
As endogenous variable, we consider the logarithm of the safety effort (ln (Sa f etye f f ort)) because we suspect the relation between rm safety effort and rm size might not be linear.
As exogenous determinants, we select a set of variables, W0
i, to describe rm
het-erogeneity. Firm size is approximated by the logarithm of 2005 rm total amount of sales expressed in million euro (Sales(ln)). Specialisation represents the proportion of
15Our analysis might suffer from a selection bias since we only use data for participating rms. We test
for selection bias using the Heckman two-step procedure (Heckman, 1979). We add an explicit selection equation to the primary equation of interest with the whole vector Wiand one variable: SalesCustFce,
which is the level of dependence of the rm, approximated by the proportion of sales the rm realised in 2005 with its main customer. Since the Inverse Mills Ratio is not signi cant, the use of OLS is not invalidated.
sales realised by importers from sales of their main product, i.e. the produce that rep-resents the highest proportion in the rm's total sales. We characterise the importer's upstream relationships with: i) DirectSupp that stands for the type of the main supplier. DirectSupp is 1 when fresh produce comes directly from producers rather than through an intermediary between producer and importer (cooperatives, exporters and other types of suppliers). ii) NbSuppliers is the number of upstream suppliers (direct or indirect) the importer normally deals with: the larger this number, the more dif cult to monitor safety because of supplier dispersion. NbSuppliers is the only quantitative variable which is not on a 'per sales' basis. We think that the absolute number of suppliers provides a more accurate picture with respect to diversity of the importers' suppliers. We charac-terise downstream relationships by the main type of French customer. SupM is 0 if the customer is a wholesaler, and 1 if it is a supermarket. Finally, we approximate for how the rm has implemented the procedures to ensure delivery of safe fruit and vegetables. QMS is a dummy variable that takes the value of 1 if the rm has adopted an additional Quality Management System to the voluntary programme, i.e. ISO 9001/9002 certi ca-tion, or HACCP certi caca-tion, etc. If the voluntary safety programme is the only QMS in place, then QMS is 0. PrevLabAna is 1 if the rm conducted laboratory analyses on fresh produce before the implementation of the voluntary programme, otherwise it is 0. We also consider the number of public inspections per unit of sales imposed on the rm in 2005 (NbPuMo). As regards the rm's perception of public pressure, interviewees were asked: 'As regards safety, would you consider that the pressure exerted on your business by public authorities is very high, high, low or very low?'. We aggregated the categories because the answers were concentrated in the two values in the middle (high and low) making the two extremes (very high and very low) not workable due to the very small number of observations. The aggregate dummy variable (PuPress) is 1 if the importer felt that the pressure was important (very high or high), and 0 if the im-porter felt that it was not important (low or very low). Similarly, we created a dummy variable (CuPress) to measure the rm's perception of the pressure exerted by the main customer. (PuPress) and (CuPress) are both subjective variables.16
16Note that these variables have low correlation with the others. To keep the richest model we ran a
likelihood ratio test between the models with and without the subjective variables : LR(χ2(2)) = 8:42,
3.4 Results
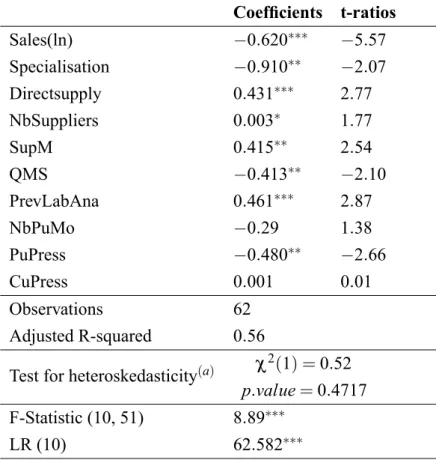
Table 2 presents the results of the Ordinary Least Squares regression and the results of diagnostic tests.
Table 2: OLS estimates (Dependent variable: Safetyeffort) Coef cients t-ratios Sales(ln) 0:620 5:57 Specialisation 0:910 2:07 Directsupply 0:431 2:77 NbSuppliers 0:003 1:77 SupM 0:415 2:54 QMS 0:413 2:10 PrevLabAna 0:461 2:87 NbPuMo 0:29 1:38 PuPress 0:480 2:66 CuPress 0:001 0:01 Observations 62 Adjusted R-squared 0:56
Test for heteroskedasticity(a) χ2(1) = 0:52
p:value = 0:4717 F-Statistic (10, 51) 8:89
LR (10) 62:582
Note: *; **, *** denote 10, 5 and 1 % signi cance respectively. (a): Breusch-Pagan/Cook-Weisberg test.
Some of the variables for rm characteristics are signi cant. As our second theo-retical proposition predicts, rm size (i.e. Sales(ln)) has a negative effect on the safety effort exerted by the rm. Firm's size reduces safety effort, which differs from previous
ndings in the literature and conventional wisdom.
Specialisation tends to reduce safety efforts. The few highly specialised rms op-erate in very speci c sectors (baby carrots, frozen broccoli). They secure their market share (niche market) by ensuring quality. For these products, the value of the whole sup-ply chain depends on quality management. In those supsup-ply chains, all suppliers must
make efforts to ensure food safety (at all stages in the chain). The importer is the one of nal links and his effort in terms of monitoring is marginal relative to the ones of producers.
We nd that reliance on a direct procurement system (DirectSupp) has a signi cant and positive in uence on the number of pesticide analyses. However, we expected that this should decrease the need for downstream safety controls. The way we built the variable implies that the rm has a direct or indirect commitment in the production process. By investing upstream, the importer devotes resources to the produce he is selling in the French market. Even if the supplier is well-known to the rm, the importer may also make greater levels of effort in order to protect his investment. The quantitative variable NbSuppliers has a positive effect17 on the level of safety effort. This result
suggests that importers will be more likely to make a greater level of effort if their procurement is atomised.
In terms of downstream operators, the type of the main customer (SupM) is sig-ni cant. The propensity for rms to work with supermarkets indirectly increases their safety efforts. In our speci c case, working with supermarkets and safety efforts are complementary in marketing safe produce, although some studies show that French su-permarkets are not explicitly asking for safety (Fulponi, 2006; Garcia Martinez and Poole, 2004).
The fact that rms have implemented another Quality Management System (QMS) has a negative effect on safety effort. Other quality management systems implemented by rms tend to be more stringent than the requirements of the voluntary safety pro-gramme. Laboratory analyses would appear to be a marginal tool within a broader ini-tiative designed to ensure quality and safety. Therefore, quality management systems, which are long-term investments, may act as substitutes for regular checking for pesti-cide residues, which is a short-term investment. The fact that rms ordered laboratory analyses (PrevLabAna) before implementation of the voluntary programme gives some idea of their awareness of safety issues in their industry. The programme allows them to maintain their level of awareness and even to increase it relatively to importers that previously did not implement any laboratory analyses. Finally, the number of public inspections of the rm per unit of sales (NbPuMo) has no in uence on the safety effort exerted by importers in 2005.
We suspected the endogeneity of (PuPress): we expect that the fear of being in-spected and, if detected, sanctioned by public authorities, approximated by (PuPress), is endogenous to the decision about the level of effort made by the rm. The greater the level of safety effort that the rm makes, the less likely it will perceive pressure from the public authorities. We use the instrumental variables (IV) method (two stage least squares) to deal with the endogenous explanatory variables. There are no restrictions on the distribution of the exogenous and endogenous variables. One or both can be binary variables (Wooldridge, 2002: 85). We ran the two stage least squares and the Durbin-Wu-Hausman test. Since the Durbin-Durbin-Wu-Hausman test does not reject the null, IV are not warranted, while differences between the IV and OLS estimates are random.
The pressure exerted by public authorities regarding food safety (PuPress) has a rather surprising negative impact on safety effort. This result is counter-intuitive: al-though rms claim that pressure from the public authorities is high, their behaviour concerning safety does not re ect this. However, the perceived pressure from customers (CuPress) does not in uence the rm's safety effort, although the type of main customer (SupM) does.
4 Conclusions
The recent evolution of European food safety regulations is characterised by the in-creased involvement and responsibility of food operators in food safety controls. The 2001 European Regulation (EC) No 178/2002 that came into in force in 2007 had this objective. At that time, in the French import industry of fresh produce this evolution led importers to implement and participate in a voluntary programme to check the safety of imported produce. The main feature of the programme is that it translates performance standards into speci cation standards. In the event of a safety failure being detected, participants are held liable if and only if they have failed to implement safety efforts (laboratory analyses). In other words, the programme relieves importers of their liabil-ity in the event of a safety failure.
Our analysis focused on the reasons why French importers adopt differentiated be-haviour in terms of food safety efforts within this voluntary programme. We have showed theoretically that the larger the rm, the lower the number of analyses rela-tively to its size. We validate this prediction using original primary data (referring to
the year 2005) drawn from the exhaustive sample of importers who participate in the voluntary programme on food safety implemented on the Perpignan market. We also have established that the propensity for a rm to work with supermarkets and the safety effort are positively correlated.
Our empirical results suggest that public authorities could work to ensure food safety through two means. First, public authorities could directly affect rms' behaviour by taking account of their intrinsic characteristics. Second, they could indirectly in uence rms' safety efforts. They could exert pressure on downstream operators who would transfer this pressure to their suppliers. Hovewer, more research is needed to know whether our results can be generalised to other food industries.
Acknowledgements
The authors are very grateful to Paolo Sckokai as an editor and three anonymous ref-erees for their valuable comments and very helpful suggestions that greatly improved the article. The authors wish to thank M. Aubert, JS. Ay, Z. Bouamra-Mechemache, E. Brousseau, J.A. Caswell, G. Grolleau, Y. Perez, A. Plantinga, A. Soubeyran, J. Subervie, A. Thomas and M. Tidball. The authors would also like to thank participants at the 8th congress IDEI-INRA (2010), the congress of EAERE (2007), the XIIth SMYE (2007),
the Annual conference of ISNIE (2006) and seminars participants at Queen's University of Belfast (Ireland), at Wageningen University (The Netherlands), at INRA-Economie Publique (France), at INRA-CESAER (France) and at INRA-AGIR (France). This re-search was supported by the working package 2 of the French project ADD 'Eco-Serre'.
References
Arora, S. and Cason, T. N. (1995). An experiment in voluntary environmental regula-tion: participation in EPA's 33/50 program. Journal of Environmental Economics and Management 28: 271–286.
Calvin, L. (2007). Outbreak linked to spinach forces reassessment of food safety prac-tices. Amber Waves 5: 24–31.
Codron, J-M., Fares, M. and Rouvière, E. (2007). From public to private safety regu-lation? The case of negotiated agreements in the French fresh produce import industry. International Journal of Agricultural Resources, Governance and Ecology 6: 415–427. Dasgupta, S., Hettige, H. and Wheeler, D. (2000). What improves environmental com-pliance? Evidence from Mexican industry. Journal of Environmental Economics and Management 39: 39–66.
DeCanio, S. J. and Watkins, W. E. (1998). Investment in energy ef ciency: do the characteristics of rms matter? Review of Economics and Statistics 80: 95–107.
Fulponi, L. (2006). Private voluntary standards in the food system: the perspective of major food retailers in OECD countries. Food Policy 30: 115–128.
Garcia Martinez, M. and Poole, N. (2004). The development of private fresh produce safety standards: implications for developing mediterranean exporting countries. Food Policy 29: 229–255.
Grolleau, G., Mzoughi, N. and Thomas, A. (2007). What drives agrifood rms to reg-ister for an environmental management system? European Review of Agricultural Eco-nomics 34: 233–255.
Heckman, J. J. (1979). Sample selection bias as a speci cation error. Econometrica 47: 153–161.
Henson, S. J. and Caswell, J. A. (1999). Food safety regulation: an overview of con-temporary issues. Food Policy 24: 589–603.
Henson, S. J. and Caswell, J. A. (1999). Food safety regulation: an overview of con-temporary issues. Food Policy 24: 589–603.
King, A. A. and Lenox, M. (2000). Industry self-regulation without sanctions: the chemical industry's Responsible Care program. Academy of Management Journal 43: 698–716.
Reyniers, D. J. and Tapiero, C. S. (1995a). The delivery and control of quality in supplier-producer contracts. Management Science 41(10): 1581–1589.
Reyniers, D. J. and Tapiero, C. S. (1995b). Contract design and the control of quality in a con ictual environment. European Journal of Operational Research 82: 373–382.
Scheffman, D. T. (1992). The application of raising rivals' costs to antitrust. The An-titrust Bulletin 37: 187–206.
Starbird, S. A. (2005). Moral hazard, inspection policy, and food safety. American Journal of Agricultural Economics 87: 15–27.
Videras, J. and Alberini, A. (2000). The appeal of voluntary environmental programs: which rms participate and why? Contemporary Economic Policy 18: 449–461.
Wooldridge, J. M. (2002). Econometric analysis of cross section and panel data. 1st edition. MIT Press, USA: Cambridge, MA.
Appendix 1: Proofs
Proof of Proposition 1
The expected utility of an importer who sells n boxes can be written as: Eu (n;e;X) = γ
∑
n k=0 n k (p (e; X )) k(1 p (e;X))n kk +µ n∑
k=0 n k (p (e; X )) k(1 p (e;X))n k (A.1) cne C (n) = n (γ p (e; X) ce) + µ C (n): Hence, the expected utility of an importer who sells n + 1 boxes is,Eu (n + 1;e;X) = n + 1
n [Eu (n; e; X ) µ + C (n)] + µ C (n + 1): (A.2) Thus, the expected utility of an importer who sells n + 1 boxes is an increasing linear function of the expected utility of an importer who sells n boxes. We conclude that the optimal probability p is the same for n or n + 1 boxes.
Proof of Proposition 2
The expected utility of an importer who sells n boxes can be rewritten as:
Eu (n;e;X) = δ n
∑
k=0 n k (exp ( a) p (e; X )) k (1 p (e;X))n k ! + β n∑
k=0 n k (p (e; X )) k (1 p (e;X))n k ! cne C (n); Or,For an interior maximum, e (n;X), we must have,
δ (1 exp ( a))(1 (1 exp ( a)) p (e (n;X);X))n 1∂ p
∂ e(e (n; X ) ; X ) = c (A.4) Moreover, the derivative of Eu (n + 1;e;X) with respect to e is,
∂ Eu
∂ e (n + 1; e; X ) =
(n + 1) δ (1 exp ( a))(1 (1 exp ( a)) p (e;X))n∂ p
∂ e(e; X ) c : (A.5) Hence, at the point e (n;X), this derivative is,
∂ Eu
∂ e (n + 1; e (n; X ) ; X ) = (n + 1) (1 exp ( a)) p (e (n;X);X)c < 0: (A.6) When the second order condition holds, the expected utility will be concave in e, and we can conclude that e (n + 1;X) < e (n;X).