HAL Id: inria-00071389
https://hal.inria.fr/inria-00071389
Submitted on 23 May 2006
HAL is a multi-disciplinary open access
archive for the deposit and dissemination of sci-entific research documents, whether they are pub-lished or not. The documents may come from teaching and research institutions in France or abroad, or from public or private research centers.
L’archive ouverte pluridisciplinaire HAL, est destinée au dépôt et à la diffusion de documents scientifiques de niveau recherche, publiés ou non, émanant des établissements d’enseignement et de recherche français ou étrangers, des laboratoires publics ou privés.
A Monitoring and Visualization Tool and Its
Application for a Network Enabled Server Platform
Raphaël Bolze, Eddy Caron, Frédéric Desprez, Georg Hoesch, Cyril Pontvieux
To cite this version:
Raphaël Bolze, Eddy Caron, Frédéric Desprez, Georg Hoesch, Cyril Pontvieux. A Monitoring and Visualization Tool and Its Application for a Network Enabled Server Platform. [Research Report] RR-5879, LIP RR-2006-14, INRIA, LIP. 2006, 2+11p. �inria-00071389�
ISRN INRIA/RR--5879--FR+ENG
a p p o r t
d e r e c h e r c h e
Th `eme NUM
A Monitoring and Visualization Tool and Its
Application for a Network Enabled Server Platform
Rapha¨el Bolze — Eddy Caron — Fr´ed´eric Desprez — Georg Hoesch — Cyril Pontvieux
N° 5879
Application for a Network Enabled Server Platform
Rapha¨el Bolze , Eddy Caron , Fr´ed´eric Desprez , Georg Hoesch , Cyril Pontvieux
Th`eme NUM — Syst`emes num´eriques Projet GRAAL
Rapport de recherche n 5879 — April 2006 —16 pages
Abstract: Monitoring grid platforms has recently gained a wide interest. This kind of platform highly distributed across different domains leads to several design and implementation problems. We have designed a new monitoring platform and visualization tool adapted for Network Enabled Server systems. This environment, highly tunable for different middleware platforms has been successfully validated on the DIET platform. In this paper, we present its architecture and main features as well as details of the validation on the DIET environment and experimental results on a large scale grid platform.
Key-words: Grid Computing, Monitoring, Visualization.
This text is also available as a research report of the Laboratoire de l’Informatique du Par-all´elisme http://www.ens-lyon.fr/LIP.
Un outil de surveillance et de visualisation et son
application `
a une plateforme de type client/serveurs sur
la grille
R´esum´e : La surveillance des plates-formes de grilles a r´ecemment connu un int´erˆet important. Ce type de plate-forme distribu´ee entre des domaines diff´erents donne plusieurs probl`emes de conception et d’impl´ementation. Nous avons con¸cus une nou-velle plate-forme de surveillance et de visualisation adapt´ee `a des syst`emes de type client/serveurs sur la grille. Cet environment, largement adaptable pour d’autres infrastructures logicielles a ´et´e valid´e avec succ`es sur la plate-forme DIET. Dans ce rapport, nous pr´esentons son architecture et ses fonctionnalit´es principales ainsi que des d´etails `a propos de sa validation sur la plate-forme DIET ainsi que des r´esultats exp´erimentaux sur une plate-forme de grille `a grande ´echelle.
1
Introduction
Understanding the behavior of distributed applications is indeed a difficult task. Grid computing adds another level of difficulty with heterogeneous sets of comput-ers distributed over the network in different administrative domains. However, grid computing middleware developers face this problem daily to optimize the perfor-mance of their applications.
We have designed a complete monitoring system based on an hierarchical object-oriented approach. This model and its implementation are generic and have been validated it on our DIET environment. The first target environment to be mon-itored belongs to the Network Enabled Servers [8] class. These environments like NetSolve [2], Ninf [9], or DIET [3] are built upon sets of servers that solve com-putational requests on behalf of clients. These clients first send their requests to a agent (meta-scheduler) that has to find a server using performance metrics. Agents can be distributed to improve the scalability of the system. This kind of highly dis-tributed platform needs a scalable and efficient monitoring software to understand its behavior.
A lot of work has been produced recently around grid platform monitoring [10] and a attempt of standardization has started within the Global Grid Forum. Most of the existing platform are highly tuned for specific grid environments. Around monitoring of Network Enabled Server systems, few work has been produced. The closest environment is visPerf [5] developed around NetSolve at the University of Tennessee.
In the rest of the paper, we first introduce the overall architecture and concepts around our tool (Section 2). In the third section, we present an application to a Network Enabled Server system developed in our team called DIET (Section 3). And finally, before a conclusion and future work, we describe the cost model of our monitoring environment and some experimental results that show its small overhead.
2
Visualization of a Distributed Platform: VizTool
In this section, we discuss the basic functionality of a monitoring system. We first define the model provide for tools that needs to be monitored in distributed environ-ments. Then we present the associate service that enable us to be aware of events that happened in a distributed environment.
4 R. Bolze , E. Caron , F. Desprez , G. Hoesch , C. Pontvieux
2.1 Simple Model for a Distributed Environment: vizTool Model
To be general and to provide for developer the freedom of defining his/her own plat-form, the basic properties and methods needed to monitor a distributed environment are defined. The main goal of a monitoring tool is to gather all events happened in this environment. An event is the first atomic object. It characterizes a simple message sent by a component to notify an action or a modification. LogEvent is defined as this atomic event that happened in a distributed platform. This object has three main attributes: componentName gives the name of the component which is responsible of this event; time gives the time when this event happened, and message describes the event.
Then we define an object which represents a concatenation of two linked events in the platform. In distributed environments, an event is often followed by another event which is the response. In Network Enabled Server (NES) environments, these two linked events are called a Request: one event informs of the start of an action, and another event informs of its end. To be able to know if these two events are linked, we need to identify them by an unique number called the request id. A Request has four main attributes: request id identifies a request, beginTime, endTime, status gives the state of the Request. Four basic states have been defined: created no information of begin or end time are available; processing the request has been created and the begin time is known; done: begin and end time of the request are known; ambiguous: the request has been created and only the end time is known. As components are distributed, there are some cases where a request has finished before being informed that it has began.
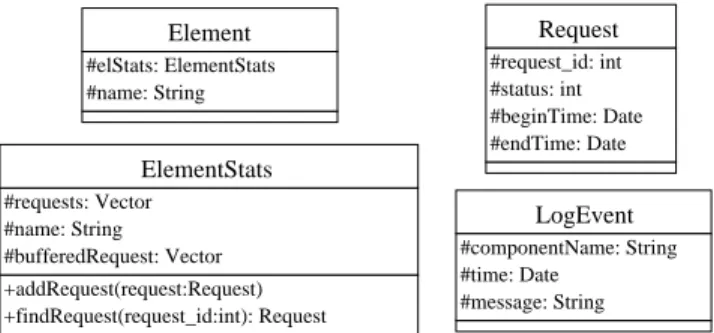
After modeling the activity of the platform, we need an object that manages all requests coming from different components of the platform: ElementStats. El-ementStats stores all done requests in a vector. This class provides two basic functions. The addRequest method stores a requests in the vector if request has donestatus else the request is stored in a buffer. The findRequest method finds a request with its request id. This ElementStats object is a member of a more general object called Element which models a component of the distributed envi-ronment. The Element object can have several properties, but we do not define any other property to this object except his name. For example, an element can model a processor, but it can also model a server, or a cluster depends on the different levels of abstraction. This approach gives the developer the opportunity to model and monitor with the granularity needed. Finally the vizTool model of the distributed environment is very simple and consists of four main classes (Fig.1): Element with two basic attributes: elStats and name. ElementStats models the activities of an
element. It contains methods to obtain statistical information based on a requests object. Request object takes into account events that happened to the element, Requests objects are stored in elStats objects. LogEvent is the basic event in the distributed platform. It represents all atomic messages sent by all components and two linked LogEvent defines Request.
Element #elStats: ElementStats #name: String ElementStats #requests: Vector #name: String #bufferedRequest: Vector +addRequest(request:Request) +findRequest(request_id:int): Request Request #request_id: int #status: int #beginTime: Date #endTime: Date LogEvent #componentName: String #time: Date #message: String
Figure 1: Model of a monitoring tool.
Indeed this model is very general, and it needs to be tuned to the specific envi-ronment we want to monitor. However it gives a framework and a common base to monitor the distributed environment. We will discuss in next section how to re-use and adapt the vizTool model for one specific distributed environment.
2.2 Event monitoring: LogService
An event monitoring system called LogService [6] has been designed. This mo-nitoring service offers the capability to be aware of information that need to be gathered from a distributed platform. The communication layer of LogService is based on Corba technology. LogComponent attaches to a component and relays in-formation and messages to logCentral. LogCentral collects messages received from LogComponents, then it stores or sends these messages to LogTools. LogTools con-nect themselves to logCentral and wait for messages. The main interest in LogService is that information are collected by a central point logCentral that receives logEvents from LogComponents that are attached to the component that you want to mon-itor. The logCentral offers the possibility to re-send this information to several tools (LogTools) which are responsible for analyzing these messages and offering a comprehensive information to the user.
6 R. Bolze , E. Caron , F. Desprez , G. Hoesch , C. Pontvieux
Filtering mechanisms are used to reduce the number of messages sent. In order to decide which messages are required by a tool. The tools have to declare their filter to the monitor (logCentral ).
Event ordering is another important feature of a monitoring system. LogSer-vice handles this problem by the introduction of a global time line. When created, each message receives a time-stamp. The problem that can occur is that the system time can be different on each host. LogService measures this difference internally and corrects the time-stamps of incoming messages accordingly. The time difference is corrected using the time stamp of the last ping that logCentral sent to LogCom-ponent. However, incoming messages are still unsorted. Thus, the messages are buffered for a short period of time in order to deliver a sorted stream of messages to the tools. Messages that arrive out of order within this time are sorted in the buffer and can be properly delivered. Although this induces a delivery-delay for messages, this mechanism guarantees the proper ordering of messages. As tools usually do not rely on true real-time delivery of messages this short delay is acceptable.
Dynamic system state: Components may connect and disconnect at runtime. A problem that arises in distributed environments is the state of the application. This state may for example contain information on connected servers, their rela-tionships, the active tasks, and many other pieces of information that depend on the application. The system state can be constructed from all events that occurred in the application. Some tools rely on this state to work properly. The problem appears if those specific tools do not receive all messages. This might occur as tools can connect to the monitor after the application has been started. In fact, this is quite probable as the lifetime of the distributed application can be much longer than the lifetime of a tool. As a consequence, the system state must be maintained and stored. In order to maintain a system state in a general way, LogService does not store the system state itself, but all messages which are required to construct it. These messages are identified by their tag and stored in a special list. This list is forwarded to each tool connected. This process is transparent for the tool since it simply receives a number of messages that represent the state of the application. In order to further refine this concept, the list of important messages is also cleaned up by LogService. After a disconnection of a component the respective informa-tion is no longer relevant for the system state. Therefore, all messages sent by this component is removed from the list.
MA
LA LA
LA
SeD SeD
SeD
SeD SeD SeD SeD C
Figure 2: DIET hierarchical organization.
3
VizTool for DIET: vizDIET
3.1 DIET Architecture
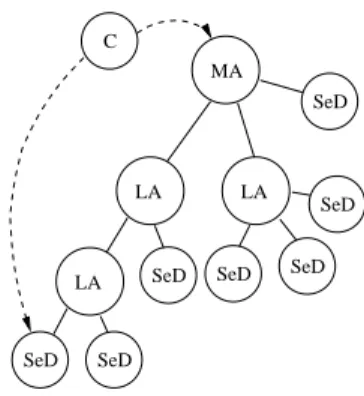
DIET (Distributed Interactive Engineering Toolbox) [4, 3] is a set of hierarchical components to design Network Enabled Server systems over the grid. These sys-tems are built upon servers managed through distributed scheduling agents. Clients ask these scheduling components to find available servers (using some performance metrics and information about the location of data already on the network). The DIET architecture has been designed following a hierarchical approach. Thus it pro-vides good scalability and can take into account physical network constraints. DIET is based on several components. First a Client is an application that uses DIET to solve problems in a RPC mode. The scheduler is scattered across a hierarchy of Agents. This hierarchy is made of one Master Agent (MA) and several Local Agents (LA). Fig. 2 shows a hierarchy built upon several DIET components. A Master Agent is the entry point of our environment and thus receives computation requests from clients attached to it. These requests refer to some DIET problems that can be solved by registered servers. A client can be connected to a MA by a specific name server or a web page which stores the various MA locations. The client asks the MA to find the most appropriate server to solve a specific request (find step). Then the MA collects computation abilities from the servers (by propagating the client request through its subtrees down to the servers) and chooses the best one according to some scheduling heuristics. A reference to the chosen server is sent back to the client. Computations (solve steps ) are done by servers (both sequential and
8 R. Bolze , E. Caron , F. Desprez , G. Hoesch , C. Pontvieux
parallel) in front of which there are Server Daemons (SeD). For instance, a SeD can be located on the entry point of a parallel supercomputer. The information stored on a SeD is a list of data available on its server, the list of problems that can be solved on it, and all information concerning its load (memory and/or number of resources available, . . . ).
3.2 VizDIET model of DIET components and requests
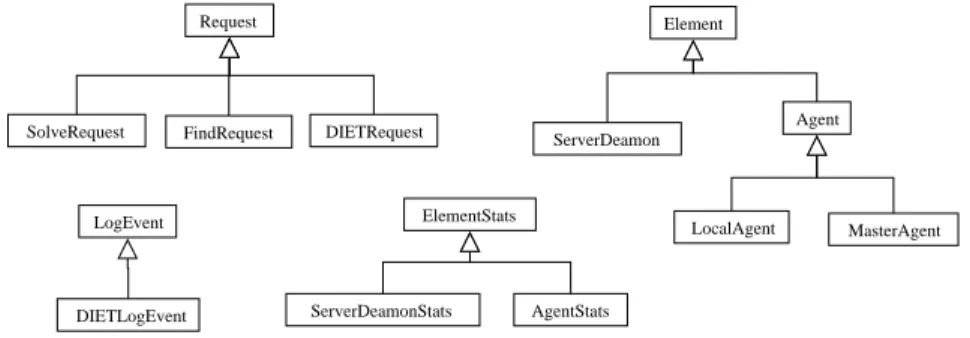
DIET is a classic example of a distributed platform. There is a set of components which interact with each other. The goal for a monitoring tool for DIET is to know the state of the system, the activity of each component, and the status of user requests. We have integrated in all DIET components a LogComponent and they are able to relay information such as state and activity by using the LogService mechanism. The model used for vizDIET is based on the basic model of vizTool, but vizDIET ’s model has been specialized for DIET components. We consider each component of DIET (agents and server daemons) as an object which inherits from the element object. As there is a hierarchical architecture in DIET, the model will fit this property. Fig. 3 shows the simplified UML schema of the model used to describe a DIET platform.
ElementStats AgentStats ServerDeamonStats Request DIETRequest FindRequest SolveRequest Element ServerDeamon Agent MasterAgent LocalAgent DIETLogEvent LogEvent
Figure 3: DIET model of vizDIET.
There are two main types of elements: ServerDaemons and Agents which inherit from Elements. Agents are then split into two classes: MasterAgents and LocalA-gents which inherit from Agents. As described in the basic model each Element has a ElementStats object that stores and calculates information about the com-ponent that it monitors. MAs and LAs have nearly the same role in the DIET hierarchy, so their ElementStats share the same class: AgentStats which inherit for
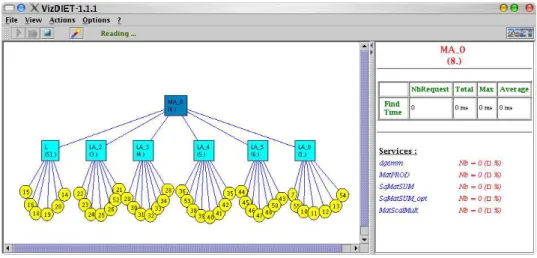
Figure 4: vizDIET snapshot.
ElementStats. ServerDaemons’ ElementStats is defined in its own specific object: ServerDaemonStats carries special methods and properties that differ from MAs or LAs.
As described in Section3.1there are two main steps; one step to find and schedule a service, and one step to solve this service. Two main activities are represented by: schedule and compute information. When an agent takes a scheduling decision for a task, it is useful to know how the agent made its decision. This information is represented by the FindRequest object. When a SeD is computing a job we need to be aware of its state and to know when the computation begins and ends. This information is represented by SolveRequest object. FindRequest are attached to agents and SolveRequest are attached to SeDs but they both inherit from Request. The vizDIET model includes one more type of request: DIETRequest which is the aggregation of one FindRequest and one SolveRequest. DIETResquest object can be seen as a job execution in a DIET platform as seen by an end-user. This object carries one other information: latency which is the time between the end of a FindRequest and the start of a SolveRequest (see bottom right diagram in Fig. 3).
Finally as proposed in the basic vizTool model, vizDIET uses a DIETLogEvent object inherited from LogEvent to define and characterize an atomic Event/Log message in the DIET environment. In DIETLogEvent there are two more properties: logType and logCanal. these two properties are used to separate log messages and manage priority of log (see bottom left diagram in Fig.3).
10 R. Bolze , E. Caron , F. Desprez , G. Hoesch , C. Pontvieux
DIETLogEvent messages can be separated in two different types of messages: state and configuration messages (in: a new element arrives in the platform, out: an element leaves the platform or fails, add service: SeD declare a new service into platform) and activity and informative messages (ask for sed: an agent looks for a SeD to execute a service, sed chosen: an agent has se-lected a list of SeD to execute a service, sed chosen: an agent has sese-lected a list of SeD to execute a service, begin solve: a SeD begins computation for a service request, end solve: a SeD has finished computation for a service request,
data stored: a SeD has stored a dataset, data released: a SeD has deleted
a dataset, data transfer begin: a SeD begins to send data to another SeD, data transfer end: a SeD ends data transfer). The first DIETLogEvent types define a DIET platform and indicate its state. Activity and informative messages are atomic events which are used to define objects such as FindRequest and SolveRequest. A pair of DIETlogEvents which are linked by the request id define the corresponding type of request, for example one begin solve and one end solve DIETLogEvent from the same SeD and with the same request id define a SolveRequest.
3.3 Monitoring view of DIET with vizDIET
The first goal of vizDIET is to graphically represent the DIET hierarchy and to monitor its behavior. The vizDIET view is based on the basic view of VizTool, giving the possibility to show a lot of information extracted from event information received from logCentral (see Fig.4).
All objects and information defined in Section 3.2about the DIET components are used to compute some properties of the system.
Average : represent the mean of elapsed time for each request. So by considering each request we can calculate the average time for one type of request (i.e. findTime, SolveTime, and latency).
Max/min time : max/min time of all requests elapsed time.
Load : the number of requests computed at the same time. It is the number of requests that have a common intersection in the interval time represented by begin and end solve time.
Number of requests : this information is very useful. For example, one may be interested in the number of requests for a specific service on a specific SeD.
Latency : for each DIETRequest we can extract the latency between the end of a FindRequest and the beginning of a SolveRequest. This value represents the DIET’s latency that includes the time to transmit data from client to server, network latency, and any other time introduced by scheduling policy (ex: request queueing . . . ).
Scheduling information : DIET’s agent return the sorted list of SeD that can compute the service asked by the client. This list is returned in sed chosen logEvent with all values that help agent to make his scheduling decision. data information : with the aggregation of data information represented by
lo-gEvent such as data stored and data released, we are able to know the amount of data presents in DIET, but also the time needed to transfer data and historic of transfer for this data (data transfer begin, data transfer end). Interaction with other systems : As LogService can relay whatever events, we
can monitor the interactions of DIET components with JuxMem1
[1] and know the amount of data read and write from JuxMem.
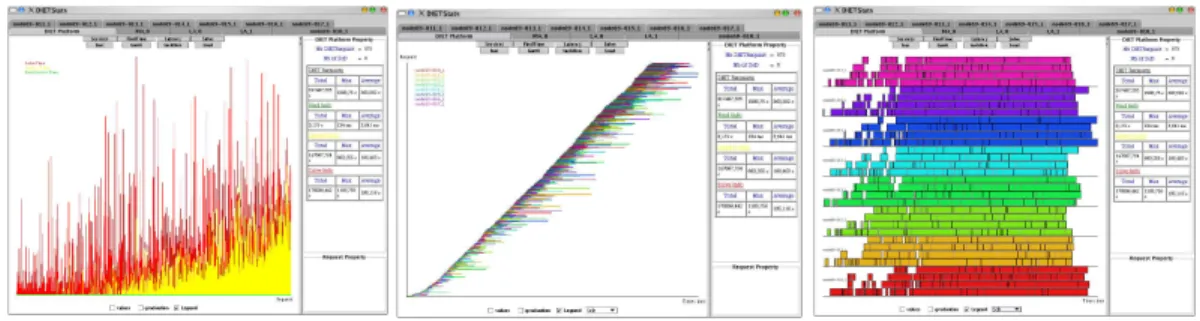
VizDIET can display a variety of information about the activity of a DIET platform. Fig. 5 show some example of vizDIET statistic output. In the Load graphic, the load of Element is calculated as the number of requests executed on the element at the same time. This information is represented in a graphic (left of Fig. 5) that draws the load of a SeD or the load of DIET platform. With this graphic one knows immediately when requests are computed in parallel, and when there is overload or underload. In the Taskflow graphic, the flow of requests is visualized. As requests are defined by a begin and end time, they can be represented in a taskflow chart to visualize scheduling information for each request. This view (middle of Fig. 5) is very useful for observing the behavior of the scheduler and has been proven very useful for scheduler developers. Requests can be separated by using one color for requests executed on a SeD, or you can differentiate requests by using one color for each request involving a particular service. When requests are represented in a classic Gantt chart, the tasks repartition is known in the DIET platform, and also the number of tasks executed by a particular SeD. The Gantt chart (right of Fig.5 only uses the information of the SolveRequest).
All of these methods can be applied to calculate values for one element such as a SeD, an Agent, or it can be applied to the entire DIET platform. It can also be applied to a specific set of requests restricted to one type of request.
1
12 R. Bolze , E. Caron , F. Desprez , G. Hoesch , C. Pontvieux
Figure 5: Bar, taskflow, and Gantt graph in vizDIET stats.
4
Platform Model and Experimental Results
According to the activity description given in Section 3.1 in DIET and vizDIET model, we can easily write a formula that gives the number of logEvents (and so the amount of data) that are generated by LogService in DIET. Let N blog(reqserv)
be the number of logs for one request of service serv. N bact is the number of logs
corresponding to activity on platform. N bdesc is the number of logs to describe the
DIET platform. N bagent is the number of agents. N bSeD is the number of SeDs.
N bSeD(serv) is the number of SeDs that can compute service serv, N bact(serv) is
the number of activity logs for the service serv. N bagent(serv) is the number of
agents that have a SeD in their sub-tree that can compute service serv. reqserv is
the number of requests for service serv.
N blog(reqserv) = N bdesc+ reqserv.N bact
N bdesc = N bAgent+ N bSeD+
X serv (N bSeD(serv)) N bact = X serv (N bact(serv))
N bact(serv) = 2.(N bagent(serv) + 1)
This formula can be simplified if we considerate a platform with only one service per SeD:
N blog(req) = N bdesc+ req.N bact
N bdesc = N bAgent+ 2.N bSeD
N bact = 2.(N bAgent+ 1)
Nb of nodes N bact Min time/log Mean time/log Max time/log Standard deviation
16 1800 3e-06 s 5.33e-06 s 1.8e-05 s 1.29e-06 s
32 3400 3e-06 s 6.60e-06 s 3.1e-05 s 2.30e-06 s
64 6600 3e-06 s 8.81e-06 s 1.94e-04 s 4.75e-06 s
128 13000 4e-06 s 1.53e-05 s 5.33e-04 s 1.42e-05 s
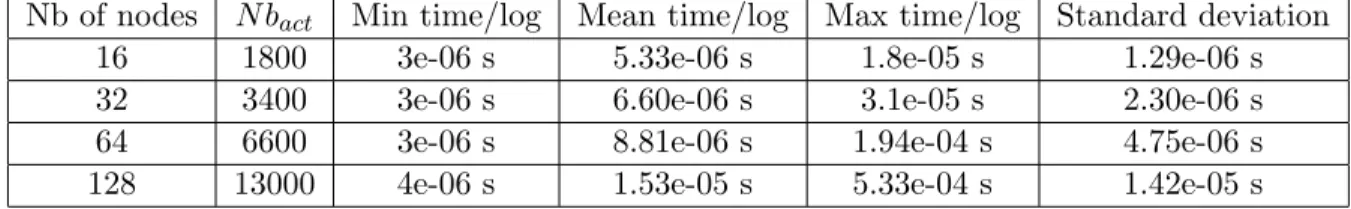
Table 1: LogCentral behavior: 100 client requests with different numbers of DIET nodes.
Now let’s take care of the size of messages sent to logCentral in the case of one service per SeD. Let Slog(req) be the size of logs depending of the number of requests. Sdesc
is the size of the message sent to logCentral to describe the platform (Snode
desc is the size
of a message to describe one node). The message is the same for an agent, a SeD, and a service. Sactis the size of message that notify activity in the DIET platform:
Sask is the size of the message that notifies the event ask for sed. Sf is a fixed
size for the message sed chosen. Ssi is the size of message containing schedule
information of SeD. It is multiplied byPagent(N bSeD(agent)) which represents the
sum of SeDs that are under the sub-trees for each agent. And finally, Ssolve is the
size of message which notifies the SeD solves service. Slog(req) = Sdesc+ req.Sact
Sdesc = Sdescnode.(N bAgent+ 2.N bSeD)
Sact = N bagent.Sask+ N bagent.Sf +
X
agent
(N bSeD(agent).Ssi) + Ssolve
We made some experiments to evaluate the scalability of logCentral to manage a DIET platform. These experiments are made with the worst DIET platform topology (i.e.: that maximize the number and the size of messages that are sent to the logCentral ). This topology is a rake tree2
where there are the same number of SeDs and Agents3
. There are 10 LogTools connected to the logCentral to received messages, and for each experiment, there are 100 client’s requests on the DIET platform. The results of experiments are presented in Table 1. These experiments show that logCentral is scalable. Even for a large platform, the maximum time to forward one log to 10 LogTools is about 0.5 ms.
2
A rake tree is a chain where all leaves are attached on the last node.
3
14 R. Bolze , E. Caron , F. Desprez , G. Hoesch , C. Pontvieux
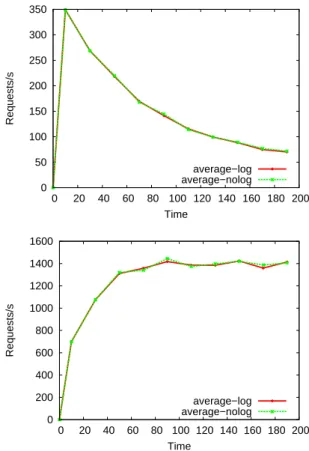
VizDIET and LogService are optional services that can be used with DIET. But as with any other monitoring and information service for distributed systems as [7], LogService introduces overheads with the transfer of data and information production. In this part we evaluate and quantify these overheads with a case study. We choose a DIET hierarchy with 1 MA and 10 SeDs. Each SeD executes a DGEMM service. We study the performance of the DIET hierarchy in terms of number of requests per second the platform can compute. Each 20s there are two more clients that ask for the DGEMM service. All clients call DGEMM service on two small matrices (10x10), wait for the result, and then call the service again until the end of the experiment. Fig. 6shows the average on 4 experiments for the DIET platform with and without LogService.
0 50 100 150 200 250 300 350 0 20 40 60 80 100 120 140 160 180 200 Requests/s Time average−log average−nolog 0 200 400 600 800 1000 1200 1400 1600 0 20 40 60 80 100 120 140 160 180 200 Requests/s Time average−log average−nolog
Figure 6: Comparison of request processing rate with and without LogService.
The goal of the case study is not to know the DIET performance limits, but to compare the performance of DIET when LogService is turned on or off and also the behavior near the performance limits of the DIET platform. Fig. 6 shows that the LogService does not significantly affect the overall performance of the platform, and the behavior of the platform is the same with or without LogService. The number of requests that was performed during the entire experiment is 256838 (mean on the 4 experiments).
Now thanks to formulae given in Section4. There were 21 informative logEvents and 1030804 activity logEvents. In total, the experience described above has gener-ated 1030825 logEvents.
5
Conclusion and Future Work
VizTool is a basic framework that allows the specification of different models on distributed platforms. The VizTool model is very simple and generic to be used for various types of distributed environments. This model has been tested and validated in VizDIET for the monitoring of the DIET platform.
There are many others possibilities of improvement of VizDIET. More informa-tion can be added on the scheduling side (statistics, other measures like throughput, fairness, slowdown, . . . ). The main improvement that remains to be done concerns the scalability of the visualization (which is a common issue for every large scale monitoring framework). Features like zooming on the architecture or more specif-ically for the DIET platform expand/un-expand a branch of the hierarchy will be developed.
Acknowledgements
This work was supported in part by the ACI GRID, the RNTL, and the GRID5000 projects of the french department of research.
References
[1] G. Antoniu, L. Boug´e, and M. Jan. Juxmem: An adaptive supportive platform for data sharing on the grid. Scalable Computing: Practice and Experience, 6(3):45–55, November 2005.
16 R. Bolze , E. Caron , F. Desprez , G. Hoesch , C. Pontvieux
[2] D. Arnold, S. Agrawal, S. Blackford, J. Dongarra, M. Miller, K. Sagi, Z. Shi, and S. Vadhiyar. Users’ Guide to NetSolve V1.4. Computer Science Dept. Technical Report CS-01-467, University of Tennessee, Knoxville, TN, July 2001.
http://www.cs.utk.edu/netsolve/.
[3] E. Caron and F. Desprez. DIET: A Scalable Toolbox to Build Network Enabled Servers on the Grid. International Journal of High Performance Computing Applications, 2006. To appear.
[4] DIET. http://www.graal.ens-lyon.fr/DIET.
[5] D.W. Lee, J. Dongarra, and R.S. Ramakrishna. visPerf : Monitoring Tool for Grid Computing. In P.M.A Sloot et al., editor, ICCS’03, volume 2659 of Lecture Notes in Computer Science, pages 233–243, 2003.
[6] LogService. http://graal.ens-lyon.fr/DIET/logservice.html.
[7] M.L. Massie, B.N. Chun, and D.E. Culler. The Ganglia Distributed Monitoring System: Design, Implementation, and Experience. Parallel Computing, 2003. (submitted).
[8] S. Matsuoka and H. Casanova. Network-Enabled Server Systems and the Com-putational Grid, July 2000. Grid Forum, Advanced Programming Models Work-ing Group whitepaper (draft).
[9] H. Nakada, M. Sato, and S. Sekiguchi. Design and Implementations
of Ninf: towards a Global Computing Infrastructure. Future
Gener-ation Computing Systems, Metacomputing Issue, 15(5-6):649–658, 1999.
http://ninf.apgrid.org/papers/papers.shtml.
[10] S. Zanikolas and R. Sakellariou. A Taxonomy of Grid Monitoring Systems. Future Generation Computer Systems, 21:163–188, 2005.
Unit´e de recherche INRIA Futurs : Parc Club Orsay Universit´e - ZAC des Vignes 4, rue Jacques Monod - 91893 ORSAY Cedex (France)
Unit´e de recherche INRIA Lorraine : LORIA, Technop ˆole de Nancy-Brabois - Campus scientifique 615, rue du Jardin Botanique - BP 101 - 54602 Villers-l`es-Nancy Cedex (France)
Unit´e de recherche INRIA Rennes : IRISA, Campus universitaire de Beaulieu - 35042 Rennes Cedex (France) Unit´e de recherche INRIA Rocquencourt : Domaine de Voluceau - Rocquencourt - BP 105 - 78153 Le Chesnay Cedex (France)