HAL Id: hal-00297879
https://hal.archives-ouvertes.fr/hal-00297879
Submitted on 23 Mar 2007HAL is a multi-disciplinary open access
archive for the deposit and dissemination of sci-entific research documents, whether they are pub-lished or not. The documents may come from teaching and research institutions in France or abroad, or from public or private research centers.
L’archive ouverte pluridisciplinaire HAL, est destinée au dépôt et à la diffusion de documents scientifiques de niveau recherche, publiés ou non, émanant des établissements d’enseignement et de recherche français ou étrangers, des laboratoires publics ou privés.
Mobility of black carbon in drained peatland soils
J. Leifeld, S. Fenner, M. Müller
To cite this version:
J. Leifeld, S. Fenner, M. Müller. Mobility of black carbon in drained peatland soils. Biogeosciences Discussions, European Geosciences Union, 2007, 4 (2), pp.871-891. �hal-00297879�
BGD
4, 871–891, 2007 Mobility of black carbon J. Leifeld et al. Title Page Abstract Introduction Conclusions References Tables Figures ◭ ◮ ◭ ◮ Back CloseFull Screen / Esc
Printer-friendly Version Interactive Discussion
EGU Biogeosciences Discuss., 4, 871–891, 2007
www.biogeosciences-discuss.net/4/871/2007/ © Author(s) 2007. This work is licensed under a Creative Commons License.
Biogeosciences Discussions
Biogeosciences Discussions is the access reviewed discussion forum of Biogeosciences
Mobility of black carbon in drained
peatland soils
J. Leifeld1, S. Fenner1, and M. M ¨uller2
1
Air Pollution/Climate Group, Agroscope Reckenholz-T ¨anikon Research Station ART, Zurich, Switzerland
2
Bern University of Applied Sciences, Swiss Collage of Agriculture, Zollikofen, Switzerland Received: 8 March 2007 – Accepted: 22 March 2007 – Published: 23 March 2007
BGD
4, 871–891, 2007 Mobility of black carbon J. Leifeld et al. Title Page Abstract Introduction Conclusions References Tables Figures ◭ ◮ ◭ ◮ Back CloseFull Screen / Esc
Printer-friendly Version Interactive Discussion
EGU
Abstract
Amount, stability, and distribution of black carbon BC were studied at four sites of a large peatland (“Witzwil”) formerly used as a disposal for combustion residues from households to derive BC displacement rates in the profile. Possible artefacts from thermal oxidation with Differential Scanning Calorimetry (DSC) on BC quantification of
5
C-rich deposits were inferred by choosing three sites from a second peatland with no historical record of waste disposal as a reference (“Seebodenalp”). All sites were under grassland at time of sampling, but were partially cropped in the past at Witzwil. Mean BC contents in topsoils of Witzwil ranged from 10.7 to 91.5 (0–30 cm) and from 0.44 to 51.3 (30–140 cm) mg BC g−1soil, corresponding to BC/OC ratios of 0.04 to 0.3 (topsoil)
10
and 0.02 to 0.18 (deeper soil). At three sites of Seebodenalp, BC was below the detec-tion limit of 0.4 mg g−1organic soil, indicating negligible formation of BC during thermal oxidation of peat.13C NMR spectra corroborated the high BC contents at Witzwil. The data refer to a considerable vertical transport of BC given that soils were ploughed not deeper than 30 cm since abandonment of waste application about 50 years ago. The
15
total amount of BC in the Witzwil profiles ranged from 3.2 to 7.5 kg BC m−2, with 21 to 69 percent of it stemming from below the former ploughing depth. Under the premise of negligible rates of BC consumption since abandonment of waste application, mini-mum BC transport rates in these peats are 0.6 to 1.2 cm a−1. The high mobility of BC might be explained by high macro-pore volumes in combination with occasional water
20
saturation. By means of DSC peak temperatures, different types of BC could be distin-guished, with deeper horizons containing BC of higher thermal stability. Application of combustion residues likely involved a mixture of various BC types, of which thermally more stable ones, most likely soots, were preferentially transported downwards.
BGD
4, 871–891, 2007 Mobility of black carbon J. Leifeld et al. Title Page Abstract Introduction Conclusions References Tables Figures ◭ ◮ ◭ ◮ Back CloseFull Screen / Esc
Printer-friendly Version Interactive Discussion
EGU
1 Introduction
Black or pyrogenic carbon (BC) is considered an important part of the global carbon cycle (Kuhlbusch, 1998). In ecosystems, it is mainly produced from incomplete com-bustion of plants both as chars and as soots with regionally varying contributions from residues of fossil fuel burning (e.g. Gustafsson et al., 2001). It has been stated that
5
BC is part of the biochemically and chemically stable aromatic fraction of soil organic matter though it is not inert. Recent studies indicated that BC is both chemically and microbially oxidized in soil (Cheng et al., 2006; Hockaday et al., 2006) though at a smaller rate than more active compounds of SOM. With the increasing evidence of the decomposability of BC, its mobility in soil becomes an important issue, because
differ-10
ent allocations in the soils’ profile provide different environments for microbial activity, oxygen supply and thus BC oxidation.
Carcaillet (2001) estimated for sites in the French Alps, that most small charcoal particles above a diameter of 400 µm needed less than 2000 years to move downward by 25–30 cm in mineral soils, and that that only after 2500 to 6000 years, the major part
15
of the charcoal mass was buried at a depth of 40 to 70 cm. Dai et al. (2005) reported on translocation of BC in a temperate mixed-grass savanna to a depth of 10 to 20 cm with in a few years. Skjemstad et al. (1999) concluded that charcoal is redistributed in soil profiles under sugarcane down to a depth of 50 to 60 cm and hypothesised, that the migration may be favoured in coarse-textured soil, but could not give a transport rate
20
because of the unknown pre-experimental BC contents in the deeper soil horizons. For a slash and burn system in Laos, Rumpel et al. (2006) showed BC to occur in the soil down to 60 cm with a declining ratio of BC to OC with depth. All these studies suggest that BC is mobile in mineral soils, but data on the rate of transportation is lacking. Moreover, none of these studies has addressed the fate of BC in organic soils.
25
Determination of BC transport rates in soil is complicated by the often uncertain history of BC input and land-use. Here, we quantified BC transport rates by making use of the historical practice of depositing substantial amounts of pyrogenic carbon onto a
BGD
4, 871–891, 2007 Mobility of black carbon J. Leifeld et al. Title Page Abstract Introduction Conclusions References Tables Figures ◭ ◮ ◭ ◮ Back CloseFull Screen / Esc
Printer-friendly Version Interactive Discussion
EGU large, agriculturally used peatland area in Switzerland. The period and technique of
application is known with high confidence, providing an opportunity to infer the mobility of BC in organic soils.
2 Sites and methods
2.1 Sites
5
The Witzwil peatland (47◦59′33′′N, 7◦03′51′′E) is the largest fen area in Switzerland covering 986 ha, located at around 430 m above sea level. The site is a relatively flat, peat-covered alluvial deposit located between Lake Neuch ˆatel, Lake Murten, and Lake Biel having a MAT of 9.1◦C and a MAP of 994 mm. Since 1868, the area has been drained and hydrological engineering measures were taken to stop the regular
flood-10
ing of large parts of the agricultural land and accompanying forests. Since that time, subsidence rates of more than two meters were recorded along many transects in Witzwil, indicating a pronounced loss of peat due to biological oxidation in combination with compaction and shrinkage. From the beginning of the 20iest century, since 1914, many soils in Witzwil were used as a deposit for waste and combustion residues from
15
households and from the waste management plant of the city of Bern (aimed at improv-ing the soils fertility) until around 1954 (Gutknecht-M ¨ader, 1998). The two main fuels at that time were wood and coal. Still today, some residues of that practice, such as metal, charred coal, or cinders from coal gasification can be found in the topsoil. Deep-ploughing is a common measure to mix the organic horizons with the mineral material
20
below the peat in order to improve the hydrological properties of the peat and to reduce oxidation rates. At Witzwil, soils were deep-ploughed occasionally in the past, but not everywhere. Based on historical records and evaluation of the soil profiles in the field, none of our sampling sites were affected by this practice.
Four sites at Witzwil (hereafter referred to as W1, W2, W3, W4) were sampled in
25
BGD
4, 871–891, 2007 Mobility of black carbon J. Leifeld et al. Title Page Abstract Introduction Conclusions References Tables Figures ◭ ◮ ◭ ◮ Back CloseFull Screen / Esc
Printer-friendly Version Interactive Discussion
EGU were under grassland at time of sampling, but have been used as cropland in earlier
times, as indicated by a distinct former ploughing horizon (Hp). At each site, a three meter wide profile was opened with a dipper, and four vertical replicates were sampled horizon-wise at a distance of 0.5 m each (total N = 100). In addition, five to six soil cores (100 ml, N = 151) were taken from each horizon for determination of bulk density and
5
pore volume. Profiles were sampled down to the deepest peat horizon, i.e. between 30 cm (W4) and 140 cm (W1). The current depth of the peat is a result of subsidence and pristine peat thickness and varies considerable within the area.
Seebodenalp (47◦05′38′′N, 8◦45′35′′E) is a peatland at an elevation of around 1025 m above sea level and has been drained around 120 years ago. It is
histori-10
cally used as permanent grassland with a mixture of haying and grazing. Thirty-nine samples were cored in 2004 at four different sites (hereafter referred to as S1–S3) from the upper 30 cm. S1 is a bog, and S2 and S3 are fens similar to those at Witzwil. Sites S1 to S3 are at around 0.5 to 1 km distance to each other.
2.2 Methods
15
Samples for chemical analysis were dried at 105◦C, weighed, milled, and organic C and total N was determined by dry combustion in an elemental analyzer (Hekatech, Germany). Samples were free of carbonate apart from deeper horizons of W2, which were treated with 1M HCl before carbon quantification. Black carbon was measured as thermally stable organic matter burning at temperatures of 520◦C or above in a
Dif-20
ferential Scanning Calorimeter (DSC, TA Instruments) as described in Leifeld (2007). The amount of BC in the sample is linearly related to the peak height in the ther-mogram, and thermally more labile BC species (e.g. charcoal) can be distinguished from stable forms (e.g. soot) by means of the BC peak temperature. The detection limit of this method is 0.1 mW or 0.0012 mg BC for organic samples, corresponding to
25
0.4 mg BC g−1soil for a C-rich sample with a sample weight of 3 mg. 13
C CPMAS NMR spectra were recorded at the NMR facility of the Technical Univer-sity, Munich (Bruker DSX 200 NMR spectrometer, Bruker, Karlsruhe, Germany;
res-BGD
4, 871–891, 2007 Mobility of black carbon J. Leifeld et al. Title Page Abstract Introduction Conclusions References Tables Figures ◭ ◮ ◭ ◮ Back CloseFull Screen / Esc
Printer-friendly Version Interactive Discussion
EGU onance frequency 50.32 MHz, contact time 1.0 ms, pulse delay 150 ms, magic angle
spinning speed 6.8 kHz). For each sample, between 5000 and 20 000 scans were accumulated. The 13C chemical shifts were calibrated relative to tetramethylsilane (0 ppm).
Correlation between soil physical attributes and SOC content are described using
5
Spearman’s rank correlation coefficient.
3 Results
3.1 Thermograms and NMR spectra of Witzwil and Seebodenalp
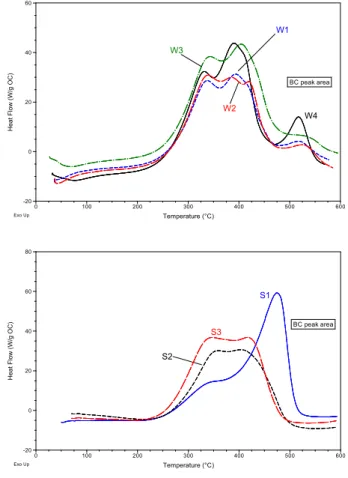
Typical burning patterns of topsoils 0–25 cm from S1–S3 and W1–W4 are given in Fig. 1. Witzwil soils are characterized by various non-BC peaks at temperatures below
10
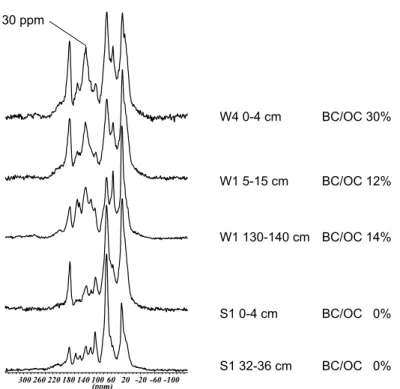
500◦C and peaks of different magnitude at temperatures of 520◦C and higher which can be assigned to BC or coal. A single piece of charred bituminous coal found in the up-per horizon of W2 peaked at 573◦C. In contrast, Seebodenalp soils almost exclusively consist of peaks in the non-BC region up to 500◦C. NMR spectra of three samples from Witzwil were characterized by a broad peak at 130 ppm while spectra from
See-15
bodenalp hat only a weak signal in that spectral region (Fig. 2). From the thirty-nine samples from Seebodenalp, only one contained BC at a concentration of 5.2 mg BC g−1 soil while the others were below the detection limit. The following quantitative analysis is therefore limited to the Witzwil sites.
3.2 Soil physics and organic carbon
20
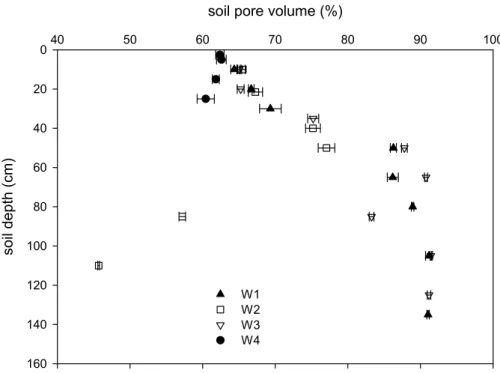
Soil pore volume increased from approximately 60% in the topsoil to around 90% in the deeper peat horizons for almost all sites and replicates (Fig. 3). An exception of this was W2, where soil pore volumes sharply declined below 45 cm depth. Soil pore volume was highly significantly and linearly correlated to the soils bulk density (r=–
BGD
4, 871–891, 2007 Mobility of black carbon J. Leifeld et al. Title Page Abstract Introduction Conclusions References Tables Figures ◭ ◮ ◭ ◮ Back CloseFull Screen / Esc
Printer-friendly Version Interactive Discussion
EGU 0.97), and both pore volume and bulk density were correlated with the SOC content
(r=0.81 and –0.88, respectively).
Organic carbon contents at W1 to W4 ranged between 200 and 500 mg g−1 soil for most horizons apart from two mineral interlayers at W2 with OC contents of below 100 mg g−1, referring to the fen origin of these histosols (Fig. 4). Smaller OC
con-5
tents in the interlayer at 90 cm coincided with the smaller pore volume shown in Fig. 3. OC contents between 400 and 500 mg g−1 soil indicate largely intact or only slightly decomposed peat, which was also visible in the field as identifiable plant tissue (fib-ric structure) in the deeper horizons stemming from both, wood and sedges. In the ploughing horizon, OC contents ranged from 200 to 300 mg g−1 soil only, likely
reflect-10
ing the ongoing decomposition of the peat, because this material was also medium to fine-textured. However, as for W2, mineral interlayers may also have contributed to the smaller OC contents.
3.3 Black carbon
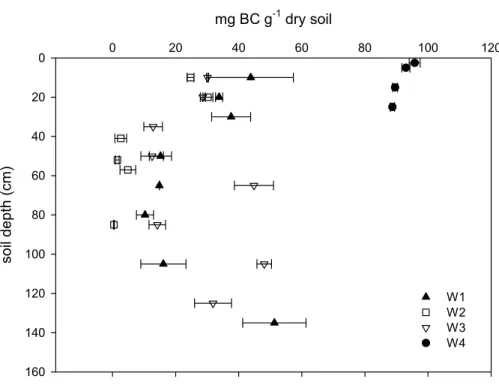
Black carbon concentrations in Witzwil profiles ranged from 10 to 51, <1 to 30, 12 to 48,
15
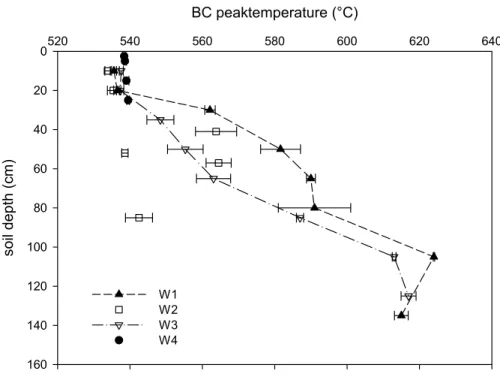
and 89 to 93 mg BC g−1soil for W1–W4, respectively, corresponding to BC/OC ratios of 0.02 to 0.18 (W1 to W3) and around 0.3 (W4) (Figs. 5 and 6). A significant decline in BC/OC-ratios with depth was observed for all profiles, and BC contents decreased at W2 and W4 (Table 1). Black carbon concentrations and BC/OC ratios were statistically not significantly related to OC contents. Peak temperature increased significantly with
20
soil depth for W1 and W3 (Table 1, Fig. 7), and were smaller in the topsoil than in deeper horizons also for W2.
The maximum depth where BC could be detected was 130–140 cm at W1, 80–90 cm at W2, 120–130 cm at W3, and 30 cm at W4. At the latter, apparently humus-free sand followed the bottom line of the peat layer at around 30 cm depth and was not
sam-25
pled. In profiles W1 and W3, where organic horizons of several decimetres thickness followed the upper body of the peat, BC could be detected in almost all depths. At W2, BC passed a superior mineral horizon at 50 cm. In this material, BC was detected
BGD
4, 871–891, 2007 Mobility of black carbon J. Leifeld et al. Title Page Abstract Introduction Conclusions References Tables Figures ◭ ◮ ◭ ◮ Back CloseFull Screen / Esc
Printer-friendly Version Interactive Discussion
EGU at concentrations of 1.6 mg BC g−1soil while the underlying organic horizon contained
4.9 mg BC g−1 soil, followed by a second mineral horizon containing 0.44 (0 to 0.62) mg BC g−1soil.
The mean amount of BC was 2.2, 2.5, 2.3, and 7.5 kg BC m−2 (0–30 cm) for W1 to W4, and 4.7, 0.7, and 4.5 kg BC m−2 >30 cm for W1, W2, and W3, respectively. In
5
other words, between 21 (W2) and 69 (W1) percent of the total BC has been trans-ported below the former Hp-horizon, assuming that no direct injection of BC occurred during time of application. Under the assumption that the applied pyrogenic carbon was admixed with the peat by tillage in the Hp horizon (0-30 cm) and considering the maximum time passed (95 years), minimum transport rates for BC of 1.16 (W1), 0.63
10
(W2), and 1.05 (W3) cm a−1 can be calculated. Taking into account measured subsi-dence rates of 67 to 114 cm since beginning of waste disposal, calculated BC transport would even become higher.
4 Discussion
The comparison of the virtually uncontaminated peatland at Seebodenalp with Witzwil,
15
where historical records of pyrogenic carbon application exist clearly showed that the DSC method does not produce significant amounts of BC artefacts during measure-ment of organic-rich samples. This is an important requiremeasure-ment for the interpreta-tion of DSC-based BC quantificainterpreta-tion and has not been tested for peat in the original method (Leifeld 2007). In that study, peak temperatures of BC have been assigned to
20
the continuum of products formed by the varying combustion conditions with charred residues peaking at much lower temperatures than charcoal (≥520◦C), soot (>600◦C), or graphite (>800◦C). It was found, that bituminous coal was the only non-BC material having a thermal stability similar to that of charcoal or soot, characterized by a peak temperature of 546◦C. At Witzwil, the single piece of presumably charred bituminous
25
coal found at W2 was characterized by one broad peak at 573◦C. The charred nature of this material was further corroborated by small ratios of H/C (0.51) and O/C (0.04)
BGD
4, 871–891, 2007 Mobility of black carbon J. Leifeld et al. Title Page Abstract Introduction Conclusions References Tables Figures ◭ ◮ ◭ ◮ Back CloseFull Screen / Esc
Printer-friendly Version Interactive Discussion
EGU indicating some contribution of inertinite (Killops and Killops 2005). Together, the DSC
measurements imply that charcoal, charred bituminous coal and soot comprise the pyrogenic carbon found in the peatland profiles.
The NMR data (Fig. 2) supported the BC quantification because Witzwil samples showed a pronounced peak at 130 ppm both at the top and the bottom of the
pro-5
files whereas this peak was much smaller for soils from Seebodenalp. Resonances at around 130 ppm have been ascribed to condensed aromatic BC structures, but contain also signals from plant-derived compounds such as lignin (Skjemstad et al. 1999). Be-cause our peat samples were not pre-treated to remove non-BC prior to NMR analysis (see e.g. Simpson and Hatcher 2004), it is likely that the aromatic region in the NMR
10
spectra also contains other aromatic compounds, which are visible in the spectra from Seebodenalp.
BC quantification is strongly method-dependent and both site history and sampling methodology affects its amount, leading to considerable variation of reported BC con-tents across soils (Preston and Schmidt 2006). This makes a direct comparison of the
15
quantities obtained here with those at other sites difficult. Amounts of BC at Witzwil, cumulated over the whole profiles, ranged from 3.2 to 7.5 kg m−2(32 to 75 t ha−1), cor-responding to BC/OC ratios of 0.02 to 0.3. These quantities exceed those typically pro-duced during single natural vegetation fire events. The amount of BC measured in six studies in boreal and temperate regions as visual char after single forest fires ranged
20
from 0.24 to 7.1 t ha−1 (Preston and Schmidt 2007). Similarly, Alexis et al. (2007) re-ported char production rates of 1.4 t BC ha−1in a Florida scrub-oak ecosystem. Hence, the BC input rate in these studies is one to two orders of magnitude below that what we found though it must be considered that in the cited studies soils were typically not sampled deeper than a few decimetres and that fine char fragments and dissolved BC
25
were not always captured. In addition, measured BC contents at Witzwil are the result of multiple applications over several decades rather than from a single event.
Anyhow, numerous fire events are needed to produce quantities of BC as measured at Witzwil. Peatland fires can substantially contribute to global C fluxes. For example,
BGD
4, 871–891, 2007 Mobility of black carbon J. Leifeld et al. Title Page Abstract Introduction Conclusions References Tables Figures ◭ ◮ ◭ ◮ Back CloseFull Screen / Esc
Printer-friendly Version Interactive Discussion
EGU large and severe peatland fires have been reported for Indonesia, where more than
2.5 Mha burnt in 1997 and released 0.19 to 0.23 Gt CO2-C (Page et al. 2002). Even if the rate of BC formation during these fires is smaller than what we measured, our data allow some conclusions regarding the fate of pyrogenic carbon in organic soils.
The deep organic profiles W1–W3 showed BC transportation rates (0.6 to
5
1.2 cm a−1) exceeding those reported for mineral soils at least by a factor of 20 (Car-caillet 2001). Drained fens are typically characterized by pore volumes of up to 80% even in the topsoil (Zeitz and Velty, 2002). Pore volumes of around 60 to 70% in top-soil samples from Witzwil thus indicate a pronounced physical degradation of the peat but are still greater than in most mineral soils. Our organic soils may have been more
10
porous in earlier years when the peat was less degraded and thus closer to values found today in the deep soil. We suggest that the large pore volume of up to 93 % together with the often saturated conditions in the deeper horizons, and occasionally also in the topsoil, likely favoured rapid movement of BC in soluble or particulate form downwards the profile. The effect of pore volume on the mobility of BC is further
col-15
laborated by results from W2 where mineral interlayers interrupted the peat deposit. BC contents dropped sharply above the first mineral interlayer where pore volumes declined from >75 to 57 % though some of the BC moved deeper. It is likely, that the reduced porosity decreased the rate of water flow through the profile. Together, these results indicate that the vertical transport of BC is favoured by a high soil pore volume
20
and by the availability of free water. Soil water has been held responsible also for the distribution of BC in mineral soils. Rodionov et al. (2006) detected BC down to 90 cm in some steppe soils from Russia. The authors showed that the distribution of BC with depth depended on climate with cold, moist sites having a more intensive transport downwards the profile than warm and dry ones and attributed this pattern to difference
25
in soil water flows.
Because of the poor conditions for microbial activity in permanently water-saturated and thus anaerobic peat horizons, the rapid movement of BC into this zone may lead to an accumulation of BC in the longer term, as probably already occurring in profile
BGD
4, 871–891, 2007 Mobility of black carbon J. Leifeld et al. Title Page Abstract Introduction Conclusions References Tables Figures ◭ ◮ ◭ ◮ Back CloseFull Screen / Esc
Printer-friendly Version Interactive Discussion
EGU W1, where BC concentration at 130 cm depth exceeds that in the topsoil. The high
transportation rates as compared to the literature imply that physical stabilisation of BC in organic horizons is negligible or weak. However, the applied methods give no conception on whether BC is dislocated in soluble or particulate form, or both. For a site under Podzol, Hockaday et al. (2006) concluded that fragmentation and dissolution
5
of charcoal BC occurs on a centennial timescale through oxidation of the condensed aromatic ring structures, favouring soluble transport.
We observed a systematic and pronounced increase in BC peak temperatures with depth for two of our profiles. The composition and origin of BC cannot be derived di-rectly from its thermal stability, but previous results indicated that well-ordered BC of
10
higher crystallinity is thermally also more stable (Leifeld, 2007). Two possible mech-anisms, alone or in combination may explain this shift in thermal stability of BC with depth. Firstly, it may reflect the preferential transport of distinct BC species through the soils pore volume downwards, either because the interaction of BC with the soils matrix is related to chemical BC characteristics or because density and particle size
15
differ between thermally labile and stable BC. Secondly, the shift in peak temperature may be the result of a stronger oxidation of BC in the soils upper horizon where both microbial activity and oxygen supply is higher. This mechanism would be causative if biological or chemical BC oxidation reduces the thermal stability of BC.
5 Conclusions
20
Pyrogenic carbon is highly mobile in peatland soils and covers distances of up to one meter within a few decades. During translocation, BC is separated into different species and soot-like BC accumulates more rapidly in the deeper horizons of the soil. Because of the unfavourable conditions for oxidative decay, injection of BC in deep peat deposits likely contributes to its long-term exclusion from active carbon cycling.
25
BGD
4, 871–891, 2007 Mobility of black carbon J. Leifeld et al. Title Page Abstract Introduction Conclusions References Tables Figures ◭ ◮ ◭ ◮ Back CloseFull Screen / Esc
Printer-friendly Version Interactive Discussion
EGU
on land-use history, R. Giger and R. Schaffl ¨utzel for help in the lab and H. Knicker for NMR-analysis. This study was partially funded by the Swiss Federal Office for Environment.
References
Alexis, M. A., Rasse, D. P., Rumpel, C., Bardoux, G., P ´echot, N., Schmalzer, P., Drake, B., and Mariotti, A.: Fire impact on C and N losses and charcoal production in a scrub oak
5
ecosystem, Biogeochem., 82, 101–116, 2007.
Carcaillet, C.: Are Holocene wood-charcoal fragments stratified in alpine and subalpine soils? Evidence from the alps based on AMS C-14 dates, Holocene, 11, 231–242, 2001.
Cheng, C. H., Lehmann, J., Thies, J. E., Burton, S. D., and Engelhard, M. H.: Oxidation of black carbon by biotic and abiotic processes, Organic Geochem., 37, 1477–1488, 2006.
10
Dai, X., Boutton, T. W., Glaser, B., Ansley, R. J., and Zech, W.:. Black carbon in a temperate mixed-grass savanna, Soil Biol. Biochem., 37, 1879–1881, 2005.
Gustafsson, O., Bucheli, T. D., Kukulska, Z., Andersson, M., Largeau, C., Rouzaud, J. N., Reddy, C. M. and Eglinton, T. I.: Evaluation of a protocol for the quantification of black carbon in sediments, Global Biogeochem. Cycles, 15, 881–890, 2001.
15
Gutknecht-M ¨ader, U.: Berner “Gh ¨uder” im Grossen Moos, in: Seebutz, Heimatbuch des See-landes und Murtenbiets. W. Gassmann AG, Biel, Switzerland, 57–61, 1998.
Hockaday, W. C., Grannas, A. M., Kim, S., and Hatcher, P. G.:. Direct molecular evidence for the degradation and mobility of black carbon in soils from ultrahigh-resolution mass spectral analysis of dissolved organic matter from a fire-impacted forest soil, Organic Geochem., 37,
20
501–510, 2006.
Killops, S. and Killops, V.: Introduction to organic geochemistry. Blackwell Publishing, Malden, USA, pp. 393, 2005.
Kuhlbusch, T. A. J.: Black carbon and the carbon cycle, Science, 280, 1903–1904, 1998. Leifeld, J.: Thermal stability of black carbon characterized by oxidative differential scanning
25
calorimetry, Organic Geochem., 38, 112–12, 2007.
Page, S. E., Siegert, F., Rieley, J. O., Boehm, H. D. V., Jaya, A., and Limin, S.: The amount of carbon released from peat and forest fires in Indonesia during 1997, Nature, 420, 61–65, 2002.
Preston, C. M. and Schmidt, M. W. I.: Black (pyrogenic) carbon: a synthesis of current
BGD
4, 871–891, 2007 Mobility of black carbon J. Leifeld et al. Title Page Abstract Introduction Conclusions References Tables Figures ◭ ◮ ◭ ◮ Back CloseFull Screen / Esc
Printer-friendly Version Interactive Discussion
EGU
edge and uncertainties with special consideration of boreal regions. Biogeosci., 3, 397–420, 2006.
Rodionov, A., Amelung, W., Haumaier, L., Urusevskaja, I., and Zech, W.: Black carbon in the zonal steppe soils of Russia, J. Plant Nutr. Soil Sci., 169, 363–369, 2006.
Rumpel, C., Alexis, M., Chabbi, A., Chaplot, V., Rasse, D. P., Valentin, C. and Mariotti, A.:
5
Black carbon contribution to soil organic matter composition in tropical sloping land under slash and bum agriculture, Geoderma, 130, 35–46, 2006.
Simpson, M. J. and Hatcher, P. G.: Overestimates of black carbon in soils and sediments, Naturwissenschaften, 91, 436–440, 2004
Skjemstad, J. O., Taylor, J. A., Janik, L. J., and Marvanek, S. P.: Soil organic carbon dynamics
10
under long-term sugarcane monoculture, Aust. J. Soil Res., 37, 151–164, 1999.
Zeitz, J. and Velty, S.: Soil properties of drained and rewetted fen soils, J. Plant Nutr. Soil Sci., 165, 618–626, 2002.
BGD
4, 871–891, 2007 Mobility of black carbon J. Leifeld et al. Title Page Abstract Introduction Conclusions References Tables Figures ◭ ◮ ◭ ◮ Back CloseFull Screen / Esc
Printer-friendly Version Interactive Discussion
EGU
Table 1. Correlation coefficients between soil depth and BC content, BC/OC ratios, and BC
peak temperatures for sites W1 to W4. Asterisks indicate level of significance. BC content BC/OC BC peak temperature W1 –0.03 –0.42* 0.90**
W2 –0.82** –0.74** 0.41 W3 –0.32 –0.39* 0.97** W4 –0.66** –0.59* 0.45
BGD
4, 871–891, 2007 Mobility of black carbon J. Leifeld et al. Title Page Abstract Introduction Conclusions References Tables Figures ◭ ◮ ◭ ◮ Back CloseFull Screen / Esc
Printer-friendly Version Interactive Discussion EGU BC peak area -20 0 20 40 60 H e a t F lo w (W /g O C ) 0 100 200 300 400 500 600 Temperature (°C) Exo Up W2 W1 W3 W4 S1 S3 S2 BC peak area -20 0 20 40 60 80 H e a t F lo w (W /g O C ) 0 100 200 300 400 500 600 Temperature (°C) Exo Up
Fig. 1. Thermograms of peat from the top 25 cm from Witzwil (upper panel, W1 short-dash, W2
long-dash, W3 dash-dot, W4 solid) and Seebodenalp (lower panel, S1 solid, S2 short-dash, S3 long-dash). OC contents of these samples range from 24 to 31 percent at Witzwil and from 31 to 41% at Seebodenalp. Heat flows are normalized to OC contents.
BGD
4, 871–891, 2007 Mobility of black carbon J. Leifeld et al. Title Page Abstract Introduction Conclusions References Tables Figures ◭ ◮ ◭ ◮ Back CloseFull Screen / Esc
Printer-friendly Version Interactive Discussion EGU W4 0-4 cm BC/OC 30% W1 5-15 cm BC/OC 12% S1 0-4 cm BC/OC 0% (ppm)6020-20-60-100 100 140 180 220 260 300 S1 32-36 cm BC/OC 0% 130 ppm W1 130-140 cm BC/OC 14%
Fig. 2. 13C NMR spectra from two BC-containing samples at Witzwil (upper spectra) and two BC-free samples from Seebodenalp (bottom). Sample name and BC/OC ratios (%) are given in the plot.
BGD
4, 871–891, 2007 Mobility of black carbon J. Leifeld et al. Title Page Abstract Introduction Conclusions References Tables Figures ◭ ◮ ◭ ◮ Back CloseFull Screen / Esc
Printer-friendly Version Interactive Discussion
EGU
soil pore volume (%)
40 50 60 70 80 90 100 so il d e p th ( c m) 0 20 40 60 80 100 120 140 160 W1 W2 W3 W4
BGD
4, 871–891, 2007 Mobility of black carbon J. Leifeld et al. Title Page Abstract Introduction Conclusions References Tables Figures ◭ ◮ ◭ ◮ Back CloseFull Screen / Esc
Printer-friendly Version Interactive Discussion EGU mg OC g-1 dry soil 0 100 200 300 400 500 600 so il d e p th ( c m) 0 20 40 60 80 100 120 140 160 W1 W2 W3 W4
BGD
4, 871–891, 2007 Mobility of black carbon J. Leifeld et al. Title Page Abstract Introduction Conclusions References Tables Figures ◭ ◮ ◭ ◮ Back CloseFull Screen / Esc
Printer-friendly Version Interactive Discussion EGU mg BC g-1 dry soil 0 20 40 60 80 100 120 so il d e p th ( c m) 0 20 40 60 80 100 120 140 160 W1 W2 W3 W4
BGD
4, 871–891, 2007 Mobility of black carbon J. Leifeld et al. Title Page Abstract Introduction Conclusions References Tables Figures ◭ ◮ ◭ ◮ Back CloseFull Screen / Esc
Printer-friendly Version Interactive Discussion EGU BC/OC 0.00 0.05 0.10 0.15 0.20 0.25 0.30 0.35 so il d e p th ( c m) 0 20 40 60 80 100 120 140 160 W1 W2 W3 W4
BGD
4, 871–891, 2007 Mobility of black carbon J. Leifeld et al. Title Page Abstract Introduction Conclusions References Tables Figures ◭ ◮ ◭ ◮ Back CloseFull Screen / Esc
Printer-friendly Version Interactive Discussion EGU BC peaktemperature (°C) 520 540 560 580 600 620 640 so il d e p th ( c m) 0 20 40 60 80 100 120 140 160 W1 W2 W3 W4
Fig. 7. BC peak temperatures plotted against soil depth for W1 to W4. Bars indicate one SE.