HAL Id: hal-01740947
https://hal.inria.fr/hal-01740947
Submitted on 22 Mar 2018
HAL is a multi-disciplinary open access
archive for the deposit and dissemination of
sci-entific research documents, whether they are
pub-lished or not. The documents may come from
teaching and research institutions in France or
abroad, or from public or private research centers.
L’archive ouverte pluridisciplinaire HAL, est
destinée au dépôt et à la diffusion de documents
scientifiques de niveau recherche, publiés ou non,
émanant des établissements d’enseignement et de
recherche français ou étrangers, des laboratoires
publics ou privés.
Cost-effective Reconfiguration for Multi-cloud
Applications
Nikos Parlavantzas, Linh Manh Pham, Arnab Sinha, Christine Morin
To cite this version:
Nikos Parlavantzas, Linh Manh Pham, Arnab Sinha, Christine Morin. Cost-effective Reconfiguration
for Multi-cloud Applications. PDP 2018 - The 26th Euromicro International Conference on Parallel,
Distributed and Network-Based Processing, Mar 2018, Cambridge, United Kingdom. pp.521-528.
�hal-01740947�
HAL Id: hal-01740888
https://hal.inria.fr/hal-01740888
Submitted on 22 Mar 2018
HAL is a multi-disciplinary open access
archive for the deposit and dissemination of
sci-entific research documents, whether they are
pub-lished or not. The documents may come from
teaching and research institutions in France or
abroad, or from public or private research centers.
L’archive ouverte pluridisciplinaire HAL, est
destinée au dépôt et à la diffusion de documents
scientifiques de niveau recherche, publiés ou non,
émanant des établissements d’enseignement et de
recherche français ou étrangers, des laboratoires
publics ou privés.
Cost-effective Reconfiguration for Multi-cloud
Applications
Nikos Parlavantzas, Linh Pham, Arnab Sinha, Christine Morin
To cite this version:
Nikos Parlavantzas, Linh Pham, Arnab Sinha, Christine Morin. Cost-effective Reconfiguration for
Multi-cloud Applications. The 26th Euromicro International Conference on Parallel, Distributed and
Network-Based Processing, Mar 2018, Cambridge, United Kingdom. <hal-01740888>
Cost-effective Reconfiguration for Multi-cloud
Applications
Nikos Parlavantzas
∗, Linh Manh Pham
∗, Arnab Sinha
†‡, Christine Morin
∗∗Univ Rennes, Inria, CNRS, IRISA
†CEA Saclay
Abstract—Applications are increasingly being deployed on resources delivered by Infrastructure-as-a-Service (IaaS) cloud providers. A major challenge for application owners is continually managing the application deployment in order to satisfy the performance requirements of ap-plication users while reducing the charges paid to IaaS providers. This paper proposes an approach for adaptive application deployment that explicitly considers adaptation costs and benefits in making deployment decisions. The approach builds on the PaaSage open-source platform, thus enabling automatic deployment and execution over multiple clouds. The paper describes experiments in a real cloud testbed that demonstrate that the approach enables multi-cloud adaptation while increasing the total value of the application for its owner.
I. INTRODUCTION
Applications are increasingly being deployed on re-sources delivered by Infrastructure-as-a-Service (IaaS) cloud providers. A major challenge for application own-ers is continually managing the application deployment to satisfy the performance requirements of application users while reducing the charges paid to IaaS providers. This management includes producing an initial deploy-ment for the application, potentially across multiple clouds, as well as dynamically adapting the deployment to react to environment changes. Dynamic adaptation may involve horizontally or vertically scaling application components, adding, replacing or removing components or migrating them across clouds.
Supporting adaptive application deployment in multi-cloud environments poses two main challenges. First, it requires an automated solution that recognizes that the current deployment is unsatisfactory, decides on a new deployment, and executes the necessary reconfiguration actions on the running system. Second, the solution must continually optimize both the performance and cost of the application in the context of varying workload, resource availability and resource prices. In this paper, we assume that a running application generates revenue for the application owner depending on the performance obtained by users (e.g., response time). Thus, the so-lution must continually optimize the application owner profit, defined as the difference between this revenue and ‡He participated in the PaaSage project as postdoc at Inria, Rennes
resource charges paid to IaaS providers. Importantly, this optimization must take into account the predicted costs of adaptation (e.g., delays for provisioning new virtual machines) and predicted benefits (e.g., improved per-formance). For example, when the workload is rapidly changing, the solution should refrain from performing complex, multi-cloud adaptation actions since the costs are unlikely to be recovered if the reconfigured applica-tion deployment does not remain stable.
There is a plethora of commercial and research so-lutions supporting dynamic application adaptation in clouds using diverse decision-making techniques, such as threshold-based policies, control theory and machine learning [1]. Apart from a few recent efforts [2], [3], [4], [5], [6], most solutions focus on vertical and horizontal scaling within a single cloud, without considering cross-cloud application restructuring. Moreover, most solutions do not take into account the potential costs of adapta-tion over time, thus failing to optimize the total profit obtained by application owners. A limited number of research efforts explicitly consider adaptation costs in making adaptation decisions [7], [8], [9], [10], but none of these targets multi-cloud application management.
This paper proposes an approach for dynamically managing the deployment of applications over multiple clouds in order to increase profit for application owners. The main novelty of the approach is that it explicitly considers the adaptation cost in deciding when and how to adapt the deployment. This relies on predicting the duration of reconfiguration actions as well as workload changes. The approach builds on the PaaSage open-source platform, a holistic solution for supporting the automatic deployment and execution of cloud applica-tions [11]. Specifically, the paper makes two main contri-butions. First, it presents our cost-effective approach for adaptive application deployment and describes how the approach was implemented and integrated in PaaSage. Second, the paper evaluates the approach using various experiments in a real cloud testbed.
The rest of the paper is structured as follows. Sec-tion II discusses related work. SecSec-tion III provides details on our approach for adaptive deployment of multi-cloud applications based on PaaSage. An extensive set
of experiments is reported in Section IV and, finally, Section V concludes the paper.
II. RELATEDWORK
Much research has focused on application adaptation through cloud elasticity [1]. Elasticity solutions are ei-ther customer-centric, operated by individual application owners (e.g., our work), or provider-centric, operated by PaaS [12] or infrastructure providers (e.g., [13], [7], [9]). In the following, we consider solutions that fall into two categories: first, customer-centric solutions that support adaptive deployment of applications across multiple cloud providers, and secondly, customer- and provider-centric solutions that explicitly consider the cost of adaptation.
In the first category, the MODAClouds [2] European project proposed an approach for continuously adapting the deployment of multi-cloud applications. The ap-proach relies on the CloudML language [14], which is also integrated in CAMEL, the cloud modelling language used in PaaSage [11]. Similarly, the SeaClouds [3] project proposed a solution for multi-cloud application management, based on the TOSCA language.
[4] presents a dynamic adaptation approach for multi-cloud applications. Adaptation relies on a branch-and-bound algorithm that selects the application configura-tion that better suits user requirements. [6] presents an environment that deploys workers across multiple clouds and dynamically rebalances the deployment. Rebalanc-ing is guided by policies that must be selected and con-figured by users. This work targets specifically master-worker architectures. Finally, [5] proposes a method to design adaptive web applications deployed in multi-cloud environments. Adaptation relies on a search-based algorithm that selects adaptation operations based on their impact on adaptation goals. None of the previous systems consider the cost of performing adaptation ac-tions on the cloud application.
In the second category, [7] proposes an approach for adaptive cloud deployment that uses persistence strategies to constrain deployment changes based on reconfiguration costs. This approach targets global op-timization of multiple applications deployed on a single cloud. [8] proposes a cloud provisioning approach that can optimize the transition cost, that is, the latency for moving from the current application configuration to a new configuration. The approach formulates and solves the provisioning problem as an integer linear program. This work optimizes either infrastructure costs or transition latency, without combining these objectives. The work most related to ours is probably [9] that proposes an adaptation engine that estimates the cost and benefit of each adaptation action in terms of changes in utility, which is a function of response time. [10] extends
this work to take into account power consumption as well as performance. Unlike our work, these two systems are provider-centric solutions, managing the deployment of multiple applications on a virtualized data center.
III. APPROACH
This section first outlines the PaaSage architecture, which underpins our approach. The section then con-centrates on the core of our approach, the continu-ous deployment optimization process, which maximizes profit for application owners while taking into account adaptation costs. Finally, the section describes how this process was practically implemented in PaaSage. A. PaaSage architecture
The PaaSage platform consists of five main compo-nents:
• Profiler: receives a cloud provider-independent
ap-plication description (e.g., apap-plication components and requirements on virtual hardware) and a set of cloud provider descriptions (e.g., VM types and prices for Amazon EC2), all written in the CAMEL language, and formalizes the optimization problem of deploying the application on available cloud resources as a constraint problem, which includes variables (e.g., the number of component instances), constraints (e.g., two components must be hosted in the same VM) and objective functions (e.g., a cost function).
• Resolver: solves the optimization problem using an
extensible set of algorithms (solvers) and generates a cloud provider-specific deployment model (e.g., application deployment on EC2).
• Adapter: receives a proposed deployment model,
validates that it is acceptable, and adapts the currently-running application deployment to recon-cile it with the proposed model. The adapter is also responsible for monitoring and dynamically adapting the application deployment, e.g., when performance deteriorates, or cloud provider prices change.
• Executionware: enacts the deployment of
applica-tion components on selected cloud providers and sets up monitoring of required metrics.
• Metadata database: stores models and execution
data.
B. Continuous deployment optimization process In our approach, the application owner receives rev-enue from application users, depending on meeting their service-level objectives (SLOs). In turn, the owner pays cloud providers for the resources used by the application. The goal is then to maximize the profit, which is the difference between revenue and resource cost. A profit
function gives the instantaneous profit based on current performance characteristics (e.g., response time) and the cost rate of used resources.
Our continuous deployment optimization process in-volves two main tasks: (1) generating a proposed de-ployment that optimizes profit under the current run-time conditions, ignoring any reconfiguration costs, and (2) deciding when and how to reconfigure the running system based on the proposed deployment, taking into account reconfiguration costs and benefits. In PaaSage, these tasks are the responsibility of the reasoner and adapter respectively. The main focus of this paper is the second task.
Regarding the first task, the reasoner receives as input the profit function and the current application workload and provides to the adapter a proposed deployment model and its predicted, instantaneous profit. Internally, the reasoner maintains a performance model and a cost model, enabling it to estimate the performance and cost for a given application deployment and workload. The reasoner then searches for the deployment that maxi-mizes the profit for the current workload.
The adapter produces a reconfiguration plan consisting of the tasks (e.g., creation, update, and deletion of VMs) necessary for transforming the current deployment to the proposed one. Given the proposed reconfiguration plan, the adapter validates that executing this plan is actually beneficial. This validation decision relies on weighing the potential reconfiguration benefits against reconfiguration costs. Benefits depend on the proposed deployment and on the time that the system remains in this deployment. Costs depend on the transient system state during reconfiguration and the time that this recon-figuration lasts.
Concretely, validation is based on the following infor-mation: (1) the estimated reconfiguration duration (Trc),
(2) the estimated time until a new reconfiguration is initiated (called stability interval or W), (3) the current profit (P1), (4) the predicted profit during reconfiguration
(P2) and the predicted profit for the proposed
configu-ration (P3). The adapter performs reconfiguration if the
associated profit is higher than the profit of doing nothing over the stability interval W, i.e.,
Trc∗ P2+ (W − Trc) ∗ P3> W ∗ P1 (1)
The reconfiguration duration (Trc) can be estimated
using historical information from previous executions of reconfiguration tasks. The stability interval (W) can be approximated as the time during which the appli-cation workload remains relatively stable, which can be predicted using historical information on workload evolution.
C. Process implementation
We have implemented our continuous deployment optimization process by modifying and extending the PaaSage reasoner and adapter components (see Fig. 1).
The profit function that we currently use is:
P rof it = w1 ∗ reward − w2 ∗ cost if response time < target −w2 ∗ cost
if response time ≥ target
(2)
Cost is the cost rate of used resources; reward
de-termines the revenue when the SLO is satisfied (i.e., the response time is under the given target). The weights w1 and w2 are both set to 0.5 in the experiments.
We have extended the PaaSage reasoner with a solver that relies on manual, off-line profiling of the application to find the best deployment. Specifically, we gather performance samples from multiple executions of the application with representative deployments and work-loads and use those samples to predict the performance for similar deployments and workloads. A large amount of research has focused on predicting application per-formance using methods such as analytic models and machine learning [15]. Such methods could be applied to improve this solver, but this work is orthogonal to the adapter and out of scope of this paper. The cost of a deployment is estimated in a straightforward way using the pricing information of cloud providers.
The adapter includes a reconfiguration validator im-plementing the approach presented earlier, and predictors for the reconfiguration duration and stability interval. The reconfiguration duration is predicted using historical information on past reconfiguration tasks. The stabil-ity interval is predicted by applying an autoregressive moving averages filter on past measured values of this interval.
After the initial deployment, the adapter continuously monitors the application workload. If a significant work-load change is detected, namely, if the workwork-load varies beyond a specific workload band (similarly to [9]), the adapter asks the reasoner to provide a new proposed deployment and generates, validates, and applies a new reconfiguration plan. The adapter also triggers the rea-soner when SLO requirements are violated or cloud prices are changed.
IV. EVALUATION
This section presents a set of experiments to evaluate our approach for adaptive application deployment in multi-cloud environments. The target cloud application
Reasoner Validator PaaSage Cloud Application Performance/Cost metrics IaaS Clouds Reconfiguration actions Adapter Stability interval predictor Reconf. duration predictor
Fig. 1. Architecture for Continuous Deployment Optimization
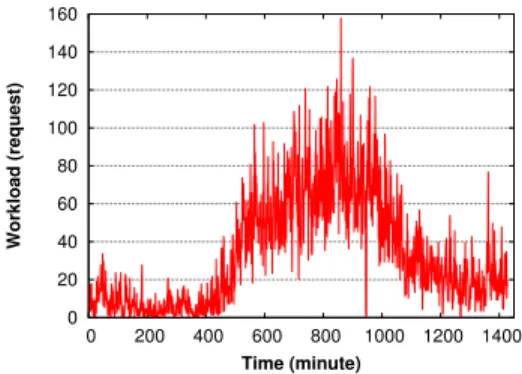
0 20 40 60 80 100 120 140 160 0 200 400 600 800 1000 1200 1400 Workload (request) Time (minute)
Fig. 2. EPA Workload
in all experiments is the three-tier RUBiS web appli-cation [16], an auction website modelled after eBay. In its Java servlet version, RUBiS comprises the web tier (Apache servers with mod_jk serving as the load balancer), the application tier (Apache Tomcat servers) and the database tier (MySQL servers). We transformed RUBiS into a cloud-ready application by writing an application description in CAMEL.
A. The Testbed
The workload for the RUBiS application is based on the EPA-http trace [17]. This trace includes a day’s
Workload Response Time Apache Apache Apache Apache H T T P L B Tomcat/Webapp Tomcat/Webapp MySQL Group Replication MySQL MySQL MySQL
Apache Tier Tomcat Tier MySQL Tier
Tsung Benchmark RUBiS Application Cost Metrics Reasoner Adapter PaaSage Reconfiguration actions IaaS Clouds Performance Metrics
Fig. 3. Testbed including Tsung tool, RUBiS application and PaaSage platform
worth of all HTTP requests served by the web server of the US Environmental Protection Agency. The shape of the trace is shown in Fig. 2. To replay this trace, we define a load progression in the Tsung distributed load testing tool [18], which regenerates the EPA workload distribution. We also replace the EPA real requests by RUBiS requests which are generated by this benchmark application itself. The simultaneous users are simulated by Tsung according to the numbers of EPA users. To make the servers saturate faster, we scale and aggregate the requests of the EPA workload from a resolution of hours to minutes, resulting in a flash-crowd workload.
We performed the experiments on two cloud environ-ments: Amazon EC2 and TryStack [19]. Details of the testbed are depicted in Figure 3 and inspired by the test topology in [20]. The workload from Tsung is injected to a virtual IP linked to a cluster of Apache servers, ensuring that the web tier does not become a bottleneck. In all experiments, the target response time in the profit function is 5 seconds. If the average response time over 10 seconds is higher than this target, the profit function provides no reward. We set the width of the workload band to 8 requests/second. To avoid oscillation effects, the reasoner is triggered only if the workload goes outside the workload band three consecutive times. B. Experiment 1
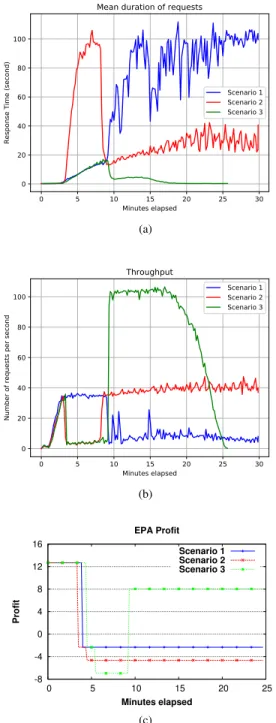
1) Setup: This simple experiment shows the practical-ity of our approach (Scenario 3) by comparing it to static, threshold-based adaptation (Scenario 2) as well as to no adaptation (Scenario 1). The type of all VMs used in this experiment is Amazon t2.small. The duration of the experiment is kept within 30 minutes, ensuring that the t2.small instances do not use up their credit and run with reduced performance. Only the increasing phase of the flash crowd is applied, resulting in scale-out actions. The performance metrics shown are end-to-end response time and throughput in requests per second. The current profit P1 is recorded every 10 seconds, and the experiment starts with only one instance of the Tomcat server.
2) Results and Discussion: Fig. 4 shows the
perfor-mance and profit results for all three scenarios.
In the non-adaptation case (Scenario 1), the response time rises over the target after the 5thminute (Fig. 4a). In
the static, threshold-based case (Scenario 2), a scale-out of two Tomcat servers is suggested by the naive reasoner, which proposes adding a static number of servers when the workload increases. Note that the reconfiguration duration for simultaneously adding two VMs hosting Tomcat servers and installing corresponding components in these VMs is about 3.5 minutes. With this workload, three servers are not enough, and the response time reaches 100 seconds in a short time.
0 5 10 15 20 25 30 Minutes elapsed 0 20 40 60 80 100 Re sp on se Ti me (se co nd )
Mean duration of requests
Scenario 1 Scenario 2 Scenario 3 (a) 0 5 10 15 20 25 30 Minutes elapsed 0 20 40 60 80 100 Nu mb er of req ue sts pe r se co nd Throughput Scenario 1 Scenario 2 Scenario 3 (b) -8 -4 0 4 8 12 16 0 5 10 15 20 25 Profit Minutes elapsed EPA Profit Scenario 1 Scenario 2 Scenario 3 (c)
Fig. 4. Effect of Workload Change on a) Response Time b) Throughput c) Profit
In Scenario 3, our reasoner exploits the knowledge gained through off-line learning and proposes adding four Tomcat servers, which brings the response time under the target specified in the SLO. The time necessary for the reasoner to understand the current workload, find the optimal deployment, and send this deployment to the adapter is around 1 minute. The time necessary for the adapter to validate the deployment using Formula 1 and to trigger corresponding scaling actions is around 15 seconds. Note that the Tomcat servers are added in parallel; thus the difference in the reconfiguration time for adding two or four Tomcat servers is only about 0.2 minutes. We also see that Scenario 3 serves all the requests and finishes its job around the 26thminute which
is earlier than the other two scenarios.
Fig. 4b shows the variation of throughput during the experiment, and Fig. 4c shows the variation in profit. At the 5th minute, the profit of all scenarios goes down as
the response time increases rapidly. In Scenario 1, the application can still serve requests in this period since there is no scaling. In Scenarios 2 and 3, the appli-cation is busy with scaling, serving a reduced number of requests for a couple of minutes. This experiment shows the soundness of our approach and its increased effectiveness compared to baseline approaches.
C. Experiment 2
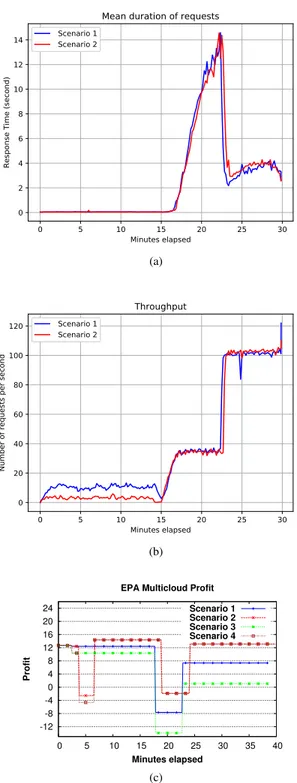
1) Setup: This experiment evaluates the ability of our approach to take into account changes in cloud pricing and to manage multi-cloud adaptation.
The experiment starts with the base configuration in which each tier of RUBiS application has one server. At the 3rdminute, we increase the price of the VM hosting the Tomcat server (Amazon t2.small) by 10% (Scenarios 1 and 2) or by 100% (Scenarios 3 and 4). Servers in other tiers are hosted in Amazon t2.medium VMs with no change in price.
In Scenarios 1 and 3, the price change is ignored and the Tomcat server continues to execute on the t2.small. In Scenarios 2 and 4, the adapter recognizes the price change and triggers an adaptation. The proposed deploy-ment includes a replacedeploy-ment of the Tomcat server in the Amazon t2.small VM by a server in a cheaper, m1.small VM in the TryStack cloud. The hardware configurations of Amazon t2.small and TryStack m1.small are similar (1 vCPU, 2GB RAM). In this experiment, the stable phase (first 15 minutes) of the EPA workload was extended to provide sufficient time for observing the transition of the Tomcat server from Amazon EC2 to the TryStack cloud. The replacement uses the technique of blue-green deployment in order to reduce downtime. Specifically, while the new VM in TryStack is being instantiated, the old VM in EC2 continues to serve the requests. When the Tomcat server in TryStack is ready, the requests are
0 5 10 15 20 25 30 Minutes elapsed 0 2 4 6 8 10 12 14 Re sp on se Ti me (se co nd )
Mean duration of requests
Scenario 1 Scenario 2 (a) 0 5 10 15 20 25 30 Minutes elapsed 0 20 40 60 80 100 120 Nu mb er of req ue sts pe r se co nd Throughput Scenario 1 Scenario 2 (b) -12 -8 -4 0 4 8 12 16 20 24 0 5 10 15 20 25 30 35 40 Profit Minutes elapsed EPA Multicloud Profit
Scenario 1 Scenario 2 Scenario 3 Scenario 4
(c)
Fig. 5. Effect of Price Changes on a) Response Time b) Throughput c) Profit
redirected to this server, and the old server is terminated. The duration of the replacement is around 2 minutes.
2) Results and Discussion: As seen in Fig. 5a and
5b, the response times of Scenarios 1 and 2 are similar in the period of the first 15 minutes, during which there is no workload change. The use of blue-green deployment ensures that the replacement in Scenario 2 has a minimum impact on performance. Note that the performance of Scenarios 1 and 3 (similarly, Scenarios 2 and 4) are identical, and thus not shown in Fig. 5a and 5b.
At the 15th minute, the workload increases and the
adapter validates and triggers the addition of 4 Tomcat servers, similarly to Experiment 1. Both scenarios show a profit decrease and then an increase (see Fig. 5c.).
After the adaptations, the response time in Scenario 2 is slightly higher than Scenario 1. The main reason for this difference is the network latency between the load balancer and the workers located in two different clouds. The results for Scenarios 3 and 4 are similar to those for Scenarios 1 and 2 with a larger difference in profit. This experiment validates that our approach can exploit price changes and multi-cloud adaptation to maximize the profit for application owners.
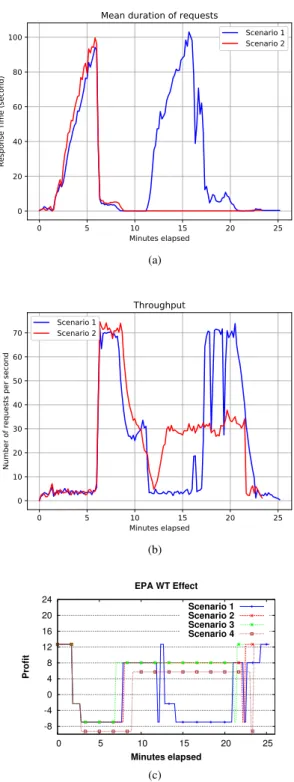
D. Experiment 3
1) Setup: This experiment evaluates the effectiveness of the reconfiguration validation integrated in the adapter. The EPA workload is played two times and the duration between two plays is set to 3.5 minutes, thus producing a stability interval (W) of similar duration. As mentioned, the reconfiguration time Trc of adding 4 Tomcat servers
is also around 3.5 minutes. All servers are hosted by Amazon t2.small VMs except for database-tier servers, which use t2.medium.
Scenario 1 is a case when the validator is switched off, whereas the validator is turned on in Scenario 2. Scenario 3 uses an alternative application server im-plementation. Specifically, Tomcat servers are replaced by JOnAS servers [21]. JOnAS is based on the OSGi component framework; JOnAS bundles can be loaded and started rapidly, resulting in faster reconfiguration times compared to Tomcat.
Scenario 4 is a case when the workload composition is changed. Specifically, whereas the workload in other scenarios contains 20% write and 80% read requests, in Scenario 4 the ratio is reversed to 80%/20%. Increasing the rate of write requests makes the database tier saturate while maintaining low pressure on the application tier. Thus, the MySQL servers need to be scaled instead of the Tomcat ones. Load balancing of the database tier relies on the MySQL group replication plugin. We configure the database servers to run in a multi-primary replication group, which allows writes to any of the group members.
0 5 10 15 20 25 Minutes elapsed 0 20 40 60 80 100 Re sp on se Ti me (se co nd )
Mean duration of requests
Scenario 1 Scenario 2 (a) 0 5 10 15 20 25 Minutes elapsed 0 10 20 30 40 50 60 70 Nu mb er of req ue sts pe r se co nd Throughput Scenario 1 Scenario 2 (b) -8 -4 0 4 8 12 16 20 24 0 5 10 15 20 25 Profit Minutes elapsed EPA WT Effect Scenario 1 Scenario 2 Scenario 3 Scenario 4 (c)
Fig. 6. Effect of Validation on a) Response Time b) Throughput c) Profit
In Scenarios 1, 2 and 3, only one MySQL server is used as the first primary node. In Scenario 4, scaling adds more nodes to the group, reducing the burden on the primary node. Adding one MySQL server takes about 5.5 minutes including 1 minute to replicate the RUBiS database from the primary server to the joining one. In both Scenarios 3 and 4, the reconfiguration validator is switched on.
2) Results and Discussion: The performance results
of Scenarios 1 and 2 are shown in Fig. 6a and 6b. The profit results for all scenarios are shown in Fig. 6c.
With the first increasing phase, both Scenarios 1 and 2 add 4 Tomcat servers, as described in Experiment 1. In the first 10 minutes, the response time and throughput of the two scenarios are almost the same. The difference
occurs at the 11thminute when the workload goes down
for the first time; a scale-in is performed in Scenario 1, and no action is triggered in Scenario 2. The turned-on validator in Scenario 2 denies a proposed reconfiguration to reduce the number of Tomcat servers from 4 to 1. As a result, the system is ready for the large upcoming increase of the workload.
As soon as the scale-in action is finished, Scenario 1 suffers a storm of new requests, which raises the response time to 100 seconds. In contrast, Scenario 2 shows a good performance with an average response time under 5 seconds. Similarly to the response time, the throughput in Scenario 1 drops to a level of 4 in comparison to 30 in Scenario 2. This only lasts 2 minutes before the reasoner in Scenario 1 recognizes the significant change and suggests adding back four Tomcat servers. The adapter in this scenario applies blindly the reconfiguration and brings the response time back to
normal at around the 20th minute. When the workload
drops for the second time, both scenarios perform a scale-in action from 4 to 1 Tomcat servers at around the 23rdminute. This time the adapter in Scenario 2 validates the scale-in as the predicted stability interval is long
enough. Between the 10th and 15th minute, the adapter
in Scenario 2 invalidated two proposed reconfigurations, a scale-in and soon after a scale-out. From the 12th to
22ndminute, Fig. 6c shows a significant gain in the profit
of Scenario 2 compared to Scenario 1. The profit curve of Scenario 3 is similar to Scenario 2 with a small difference in the reconfiguration time. With a longer Trc and higher cost, Scenario 4 brings lower profit than
Scenario 2. Nevertheless, the SLO is guaranteed, even if the composition of the workload was changed. This experiment validates the effectiveness of reconfiguration validation in optimizing the profit.
V. CONCLUSION
The paper presented an approach for adaptive ap-plication deployment over multiple clouds. The main
goal of the approach is to increase the profit of ap-plication owners by seeking to optimize both applica-tion performance and the cost of using IaaS resources. The approach cleanly separates generating proposed de-ployments and deciding when and how to reconfigure the running application based on these proposed de-ployments. Importantly, the approach explicitly weighs predicted adaptation costs against adaptation benefits based on predictions about reconfiguration duration and workload evolution. The approach was integrated in the PaaSage platform and was evaluated using a set of real experiments that demonstrate its ability to per-form multi-cloud reconfiguration actions as well as its effectiveness in optimizing the application owner profit under various circumstances. In future work, we plan to investigate intelligent reasoning approaches supporting online decision making. We also plan to perform more experiments in order to provide a larger-scale evaluation of the approach.
ACKNOWLEDGMENT
The authors would like to thankfully acknowledge the support of the PaaSage (FP7-317715) EU project.
REFERENCES
[1] A. Naskos, A. Gounaris, and S. Sioutas, Cloud
Elasticity: A Survey. Springer, 2016, vol. 9511,
pp. 151–167.
[2] E. D. Nitto, P. Matthews, D. Petcu, and A. Sol-berg, Model-Driven Development and Operation of Multi-Cloud Applications: The MODAClouds
Approach, 1st ed. Springer Publishing Company,
2017.
[3] A. Brogi, J. Carrasco, J. Cubo, F. D’Andria, E. Di Nitto, M. Guerriero, D. Pérez, E. Pimentel, and J. Soldani, SeaClouds: An Open Reference Architecture for Multi-cloud Governance. Springer International Publishing, 2016, pp. 334–338. [4] A. Almeida, F. Dantas, E. Cavalcante, and
T. Batista, “A branch-and-bound algorithm for au-tonomic adaptation of multi-cloud applications,” in 2014 14th IEEE/ACM International Symposium on Cluster, Cloud and Grid Computing, May 2014, pp. 315–323.
[5] P. Zoghi, M. Shtern, M. Litoiu, and H. Ghan-bari, “Designing adaptive applications deployed on cloud environments,” ACM Trans. Auton. Adapt. Syst., vol. 10, no. 4, pp. 25:1–25:26, Jan. 2016. [6] D. Duplyakin, P. Marshall, K. Keahey, H. Tufo, and
A. Alzabarah, “Rebalancing in a multi-cloud envi-ronment,” in Proceedings of the 4th ACM Workshop
on Scientific Cloud Computing. New York, NY,
USA: ACM, 2013, pp. 21–28.
[7] J. Li, M. Woodside, J. Chinneck, and M. Litiou, “Adaptive cloud deployment using persistence strategies and application awareness,” IEEE Trans-actions on Cloud Computing, vol. 5, no. 2, pp. 277– 290, April 2017.
[8] U. Sharma, P. Shenoy, S. Sahu, and A. Shaikh, “A cost-aware elasticity provisioning system for the cloud,” in 2011 31st International Conference on Distributed Computing Systems, June 2011, pp. 559–570.
[9] G. Jung, K. R. Joshi, M. A. Hiltunen, R. D. Schlichting, and C. Pu, “A cost-sensitive adap-tation engine for server consolidation of mul-titier applications,” in Proceedings of the 10th ACM/IFIP/USENIX International Conference on
Middleware. Springer-Verlag New York, Inc.,
2009, pp. 9:1–9:20.
[10] G. Jung, M. A. Hiltunen, K. R. Joshi, R. D. Schlichting, and C. Pu, “Mistral: Dynamically man-aging power, performance, and adaptation cost in cloud infrastructures,” in 2010 IEEE 30th Interna-tional Conference on Distributed Computing Sys-tems, June 2010, pp. 62–73.
[11] “PaaSage,” Website https://www.paasage.eu. [12] S. Costache, D. Dib, N. Parlavantzas, and C. Morin,
“Resource management in cloud platform as a ser-vice systems: Analysis and opportunities,” Journal of Systems and Software, vol. 132, pp. 98 – 118, 2017.
[13] C. Delimitrou, D. Sanchez, and C. Kozyrakis, “Tar-cil: Reconciling scheduling speed and quality in large shared clusters,” in Proceedings of the Sixth
ACM Symposium on Cloud Computing. ACM,
2015, pp. 97–110.
[14] N. Ferry, H. Song, A. Rossini, F. Chauvel, and A. Solberg, “CloudMF: Applying MDE to tame the complexity of managing multi-cloud applications,” 2014 IEEE/ACM 7th International Conference on Utility and Cloud Computing (UCC), vol. 00, pp. 269–277, 2015.
[15] M. Amiri and L. Mohammad-Khanli, “Survey on prediction models of applications for resources provisioning in cloud,” Journal of Network and Computer Applications, vol. 82, pp. 93 – 113, 2017. [16] “RUBiS,” Website http://rubis.ow2.org/.
[17] “EPA-HTTP trace,” Website http://ita.ee.lbl.gov/ html/contrib/EPA-HTTP.html.
[18] “Tsung,” Website http://tsung.erlang-projects.org/. [19] “TryStack,” Website http://trystack.org/.
[20] L. M. Pham, A. El-Rheddane, D. Donsez, and N. Depalma, “Cirus: an elastic cloud-based frame-work for ubilytics,” Annals of Telecommunications, vol. 71, no. 3, pp. 133–140, Apr 2016.