HAL Id: hal-02385937
https://hal.archives-ouvertes.fr/hal-02385937
Submitted on 29 Nov 2019
HAL is a multi-disciplinary open access
archive for the deposit and dissemination of
sci-entific research documents, whether they are
pub-lished or not. The documents may come from
teaching and research institutions in France or
abroad, or from public or private research centers.
L’archive ouverte pluridisciplinaire HAL, est
destinée au dépôt et à la diffusion de documents
scientifiques de niveau recherche, publiés ou non,
émanant des établissements d’enseignement et de
recherche français ou étrangers, des laboratoires
publics ou privés.
SPADEVizR: an R package for Visualization, Analysis
and Integration of SPADE results
Guillaume Gautreau, David Pejoski, Roger Le Grand, Antonio Cosma,
Anne-Sophie Beignon, Nicolas Tchitchek
To cite this version:
Guillaume Gautreau, David Pejoski, Roger Le Grand, Antonio Cosma, Anne-Sophie Beignon, et al..
SPADEVizR: an R package for Visualization, Analysis and Integration of SPADE results.
Bioin-formatics, Oxford University Press (OUP), 2017, pp.btw708. �10.1093/bioinformatics/btw708�.
�hal-02385937�
Systems biology
SPADEVizR: an R package for visualization,
analysis and integration of SPADE results
Guillaume Gautreau, David Pejoski, Roger Le Grand, Antonio Cosma,
Anne-Sophie Beignon and Nicolas Tchitchek*
CEA – Universite´ Paris Sud 11 – INSERM U1184, Immunology of Viral Infections and Autoimmune Diseases, 92260
Fontenay-aux-Roses, France
*To whom correspondence should be addressed. Associate Editor: Jonathan Wren
Received on July 18, 2016; revised on September 26, 2016; editorial decision November 3, 2016; accepted on November 5, 2016
Abstract
Motivation: Flow, hyperspectral and mass cytometry are experimental techniques measuring cell
marker expressions at the single cell level. The recent increase of the number of markers
simultan-eously measurable has led to the development of new automatic gating algorithms. Especially, the
SPADE algorithm has been proposed as a novel way to identify clusters of cells having similar
phenotypes in high-dimensional cytometry data. While SPADE or other cell clustering algorithms
are powerful approaches, complementary analysis features are needed to better characterize the
identified cell clusters.
Results: We have developed SPADEVizR, an R package designed for the visualization, analysis and
integration of cell clustering results. The available statistical methods allow highlighting cell
clus-ters with relevant biological behaviors or integrating them with additional biological variables.
Moreover, several visualization methods are available to better characterize the cell clusters, such
as volcano plots, streamgraphs, parallel coordinates, heatmaps, or distograms. SPADEVizR can
also generate linear, Cox or random forest models to predict biological outcomes, based on the
cell cluster abundances. Additionally, SPADEVizR has several features allowing to quantify and to
visualize the quality of the cell clustering results. These analysis features are essential to better
in-terpret the behaviors and phenotypes of the identified cell clusters. Importantly, SPADEVizR can
handle clustering results from other algorithms than SPADE.
Availability and Implementation: SPADEVizR is distributed under the GPL-3 license and is available
at https://github.com/tchitchek-lab/SPADEVizR.
Contact: [email protected]
Supplementary information:
Supplementary data
are available at Bioinformatics online.
1 Introduction
Cytometry is an experimental technique used to characterize cell properties at the single cell level. Flow cytometry is the most com-mon technique and allows measuring simultaneously up to 18 cell markers. Thanks to mass and hyperspectral cytometry techniques, the number of simultaneously measurable cell markers has increased up to 50 (Bendall et al., 2011;Gre´gori et al., 2014). This increase of measurable cell markers has led to the development of new
automatic gating algorithms, such as SPADE (Qiu et al., 2011) or ACCENSE. The aim of these algorithms is to identify group of cells, also named cell clusters, having similar expressions in the whole dataset for selected markers. Cell cluster behaviors are then analyzed in terms of variations of associated cells among the different biolo-gical samples and conditions.
The SPADE algorithm, which stands for Spanning-tree Progression Analysis of Density-normalized Events, was developed
VCThe Author 2016. Published by Oxford University Press. 779
This is an Open Access article distributed under the terms of the Creative Commons Attribution Non-Commercial License (http://creativecommons.org/licenses/by-nc/4.0/), which permits non-commercial re-use, distribution, and reproduction in any medium, provided the original work is properly cited. For commercial re-use, please contact [email protected]
Bioinformatics, 33(5), 2017, 779–781 doi: 10.1093/bioinformatics/btw708 Advance Access Publication Date: 1 December 2016 Applications Note
to identify cell clusters in the context of mass cytometry data. In summary, SPADE is a hierarchical clustering-based algorithm com-bined to a density-based down-sampling procedure. SPADE results can be mainly summarized by two matrices: the cluster abundance matrix which contains the number of cells associated to each cluster for each sample and the cluster phenotype matrix which contains the marker median expressions for each cluster of each sample.
While SPADE is a powerful approach, the interpretation of the behaviors or phenotypes of the identified cell clusters can be chal-lenging, in particular in the scope of a whole dataset. For instance, SPADE has no methods allowing to highlight cell clusters with a cell abundance statistically different between two biological conditions or associated with an additional biological variable. Moreover, SPADE lacks of visualization methods to deeply characterize the phenotypes of the cell clusters in the whole dataset.
We have developed SPADEVizR, an R package to visualize, ana-lyze and integrate results provided by SPADE. This package extends the original SPADE outputs with techniques such as volcano plots, streamgraphs, parallel coordinates, heatmaps, or distograms. Moreover, several statistical methods allow the identification of clusters with important biological behaviors. SPADEVizR also has features allowing the quantification and the visualization of the quality of clustering results and can be used with results generated by algorithms different from SPADE. We illustrate the capabilities of our package using a mass cytometry dataset (Pejoski et al., 2016), obtained in a macaque vaccination study (Supplementary Fig. S1, and user tutorial).
2 Statistical methods
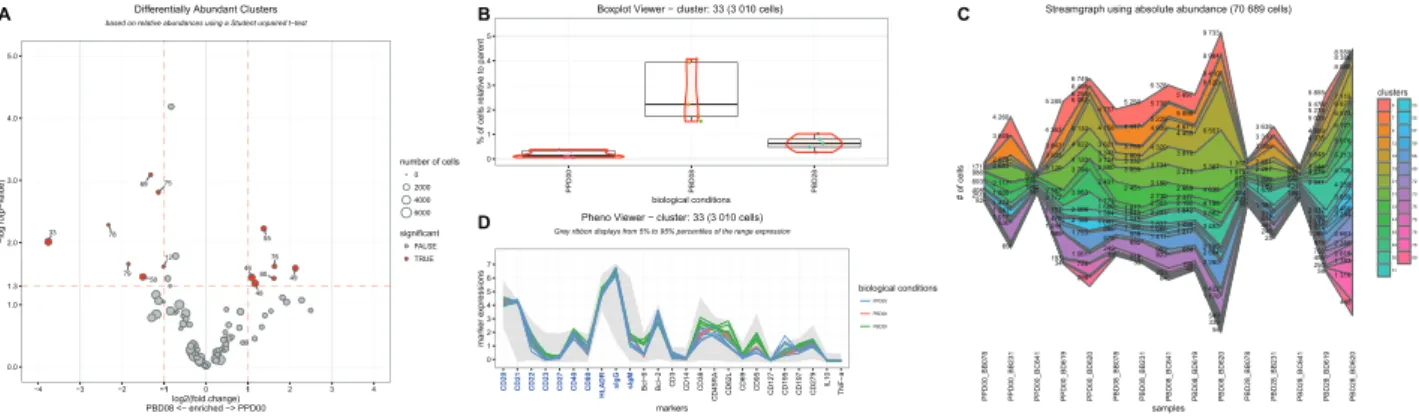
SPADEVizR allows the identification of three types of relevant cell clusters. Abundant Clusters correspond to clusters having a cell abun-dance statistically greater than a specific threshold for a given set of samples, identified by one sample t-tests. Differentially Abundant Clusters correspond to clusters having a cell abundance statistically different between two biological conditions, identified by two sample t-tests. Correlated Clusters correspond to clusters having a cell abun-dance correlated with an additional biological variable, identified by Pearson or Spearman correlations. These clusters with important be-haviors can be visualized using scatter plot or volcano plot representa-tions (Supplementary Fig. S1A, B andFig. 1A).
Statistical tests can be easily parametrized and corrected for mul-tiple comparisons. Clusters having similar cell abundance profiles
can be classified, using various methods such as k-means (user man-ual and tutorial), and can be visman-ualized using colored circle packing representations (Supplementary Fig. S1C). SPADEVizR can also generate linear, Cox and random forest models to predict biological outcomes, based on the cluster abundances (Supplementary Fig. S2).
3 Visualization methods
Boxplot (Fig. 1B) and kinetic (Supplementary Fig. S1D) representa-tions available in SPADEVizR allows efficient visualizarepresenta-tions and comparisons of cluster abundances between different samples and conditions. Moreover, streamgraph representations can display sim-ultaneously absolute and relative cell abundances for a set of clusters (Fig. 1C). While the original SPADE tree representations display data for one single sample, SPADEVizR can display trees based on multiple samples (Supplementary Fig. S1E). Nodes can also be gradient-colored based on marker expression and relevant cell clus-ters previously identified can be highlighted. The number of cells associated to each cluster for each sample can also be displayed using a dot plot representation to visualize the heterogeneity of clus-ter sizes (Supplementary Fig. S1F).
In SPADEVizR, phenotypical characterization of the cell clusters can be performed using categorical heatmaps or parallel coordinates (Supplementary Fig. S1G and D). While heatmaps provide global overviews, parallel coordinates provide more details by highlighting the homogeneity of marker expressions between the samples. SPADEVizR can generate multidimensional scaling representations to visualize the similarities between samples or clusters, based on theirs abundance profiles (Supplementary Fig. S1H and I). In such representations, each dot corresponds to a cluster or sample and the distances between the dots are proportional to the Euclidean dis-tances computed based on the cell abundance profiles. Biplot repre-sentations can be generated to visualize the co-expressions between two cell markers for one or multiple samples and can be restricted to one or multiple clusters (Supplementary Fig. S1J). Additionally, all pairwise marker co-expressions for selected samples or selected clus-ters can be visualized using distograms (Supplementary Fig. S1K).
SPADEVizR can generate PDF reports, which gather all these stat-istical results and visual representations, to make easier the analysis of cell clustering results (user tutorial and user manual). Finally, clusters having uniform phenotypes can be quantified using the Hartigan’s Dip test and the interquartile range (IQR). Uniform clusters are defined as clusters having unimodal expression distributions,
Fig. 1. Selected visualization representations available in SPADEVizR. (A) Volcano plot showing Differentially Abundant Clusters (DAC) between baseline and 8 days post-boost. DACs are labeled and colored in red. The size of the dots is proportional to the cell cluster sizes. (B) Dotplot and boxplot showing the cell abun-dances for the cluster 33 in each sample and each condition. A red violon indicates the distribution of cell abunabun-dances. (C) Streamgraph showing absolute and relative abundances for a set of clusters across all the samples. (D) Parallel coordinates showing the phenotype of the cluster 33. Grey ribbon represents the marker expression ranges in the entire dataset. More details about this dataset and analysis are provided inSupplementary Figure S1and in the user manual
780 G.Gautreau et al.
estimated by the Dip test, and having low spread of expressions, esti-mated by the IQR, for all their clustering markers. Clusters having low number of associated cells can also be quantified. Reports with heatmaps and expression densities can be generated to visualize the quality of the clustering results (Supplementary Fig. S3).
4 Conclusion
SPADEVizR constitutes a powerful approach for interpreting clus-tering results from the SPADE algorithm or other automatic gating algorithms. The available statistical and visualization methods are very valuable to analyze high-dimensional cytometry data.
Funding
This work has been supported the grants ‘Investissement d’avenir: Equipements d’Excellence’ – 2010 FlowCyTech (ANR-10-EQPX-02-01) and
‘Infrastructures Nationales en Biologie et Sante´’ – 2011 IDMIT (ANR-11-INBS-0008).
Conflict of Interest: none declared.
References
Bendall,S.C. et al. (2011) Single-cell mass cytometry of differential immune and drug responses across a human hematopoietic continuum. Science, 332, 687–696.
Gre´gori,G. et al. (2014) Hyperspectral cytometry. Curr. Top. Microbiol. Immunol., 377, 191–210.
Pejoski,D. et al. (2016) Identification of vaccine-altered circulating B cell phenotypes using mass cytometry and a two-step clustering analysis. J. Immunol., 196, 4814–4831.
Qiu,P. et al. (2011) Extracting a cellular hierarchy from high-dimensional cytometry data with SPADE. Nat. Biotechnol., 29, 886–891.
Visualization, analysis and integration of SPADE results 781