HAL Id: cea-00832927
https://hal-cea.archives-ouvertes.fr/cea-00832927
Submitted on 5 Jan 2021
HAL is a multi-disciplinary open access
archive for the deposit and dissemination of
sci-entific research documents, whether they are
pub-lished or not. The documents may come from
teaching and research institutions in France or
abroad, or from public or private research centers.
L’archive ouverte pluridisciplinaire HAL, est
destinée au dépôt et à la diffusion de documents
scientifiques de niveau recherche, publiés ou non,
émanant des établissements d’enseignement et de
recherche français ou étrangers, des laboratoires
publics ou privés.
The Hidden ”Agn Main Sequence”: Evidence for a
Universal Black Hole Accretion to Star Formation Rate
Ratio Since Z
2 Producing an M _BH-M
∗ Relation
J. R. Mullaney, Emanuele Daddi, M. Béthermin, D. Elbaz, S. Juneau, M.
Pannella, M. T. Sargent, D. M. Alexander, R. C. Hickox
To cite this version:
J. R. Mullaney, Emanuele Daddi, M. Béthermin, D. Elbaz, S. Juneau, et al.. The Hidden ”Agn Main
Sequence”: Evidence for a Universal Black Hole Accretion to Star Formation Rate Ratio Since Z
2 Producing an M _BH-M
∗ Relation. The Astrophysical journal letters, Bristol : IOP Publishing,
2012, 753, pp.L30. �10.1088/2041-8205/753/2/L30�. �cea-00832927�
arXiv:1204.2824v2 [astro-ph.CO] 6 Jun 2012
THE HIDDEN “AGN MAIN SEQUENCE”: EVIDENCE FOR A UNIVERSAL BLACK HOLE ACCRETION TO STAR FORMATION RATE RATIO SINCE z ∼ 2 PRODUCING A MBH–M∗ RELATION
J. R. Mullaney1,2, E. Daddi1, M. B´ethermin1, D. Elbaz1, S. Juneau1, M. Pannella1, M. T. Sargent1, D. M. Alexander2, R. C. Hickox3
Draft version October 16, 2018
ABSTRACT
Using X-ray stacking analyses we estimate the average amounts of supermassive black hole (SMBH) growth taking place in star-forming galaxies (SFGs) at z ∼ 1 and z ∼ 2 as a function of galaxy stellar mass (M∗). We find the average SMBH growth rate follows remarkably similar trends with M∗ and redshift as the average star-formation rates (SFRs) of their host galaxies (i.e., ˙MBH∝M∗0.86±0.39 for the z ∼ 1 sample and ˙MBH∝M∗1.05±0.36 for the z ∼ 2 sample). It follows that the ratio of SMBH growth rate to SFR is (a) flat with respect to M∗ (b) not evolving with redshift and (c) close to the ratio required to maintain/establish a SMBH to M∗ ratio of ≈ 10−3 as also inferred from today’s MBH–MBulgerelationship. We interpret this as evidence that SMBHs have, on average, grown in-step with their host galaxies since at least z ∼ 2, irrespective of host galaxy mass and AGN triggering mechanism. As such, we suggest that the same secular processes that drive the bulk of star formation are also responsible for the majority of SMBH growth. From this, we speculate that it is the availability of gas reservoirs that regulate both cosmological SMBH growth and star formation.
Subject headings: galaxies: active—galaxies: evolution—galaxies: star formation—X-rays: general
1. INTRODUCTION
The tight observed relationship between galaxy bulge mass and the mass of its central, supermassive black hole (SMBH; e.g., H¨aring & Rix 2004), hereafter MBH– MBulge, suggests galaxy growth (i.e., star-formation) is closely tied to the principal mode of SMBH growth: ac-cretion during periods of nuclear activity (i.e., active galactic nuclei, or AGN). However, the MBH–MBulge re-lationship only provides a snapshot of the end result, with the details surrounding when, how and under what conditions these links were forged remaining poorly un-derstood. Indeed, it is not yet clear whether all episodes of star-formation are eventually accompanied by SMBH growth, or whether such evolutionary links are limited to the most rapidly growing systems, such as those in-duced by major-mergers (see Alexander & Hickox 2011 for a review). A major difficulty in exploring the links between ongoing SMBH and galaxy growth stems partly from scatter introduced by the different duty cycles of AGN and star-formation episodes, leading to what ap-pears to be only very weak correlations between the two events (e.g., Silverman et al. 2009; Mullaney et al. 2012). Since SMBH growth appears to be so closely tied to galaxy growth, it is pertinent to ask whether average SMBH accretion rates trace star-formation rates (SFRs). In this vein, Daddi et al. (2007b) showed that the ra-tio of average SMBH accrera-tion rate to SFR in star-forming galaxies (SFGs) at z ∼ 2 was roughly consis-tent with that inferred from today’s MBH–MBulge rela-tionship. However, focussing on only the global average conceals details of how SMBH and galaxy mass is built
1Irfu/Service d’Astrophysique, CEA-Saclay, Orme des
Merisiers, 91191, Gif-sur-Yvette Cedex, France
2Department of Physics, Durham University, South Road,
Durham DH1 3LE, U.K.
3Department of Physics and Astronomy, Dartmouth College,
6127 Wilder Laboratory, Hanover, NH 03755, USA
up. Indeed, it is now evident that SFGs have formed stars at a rate that is roughly proportional to their stel-lar masses (M∗) since at least z ∼ 2, while their average specific SFRs (i.e., sSFR = SFR/M∗) increase strongly with redshift (e.g., Noeske et al. 2007; Elbaz et al. 2007; Daddi et al. 2007a; Pannella et al. 2009; Karim et al. 2011; Elbaz et al. 2011). Here, we determine whether these trends between SFR, M∗ and redshift for SFGs also extend to the growth of their resident SMBHs. We use H0= 71 km s−1 Mpc−1, ΩΛ = 0.73, ΩM= 0.27 and a Chabrier initial mass function.
2. DATA AND ANALYSES
We measure the average SMBH accretion rates in SFGs at 0.5 < z < 2.5 in the GOODS-South field. Our two samples of z ∼ 1 and z ∼ 2 galaxies (607 and 1146 sources, respectively) are from the K-selected catalogue of Daddi et al. (2007a; 2007b; see also Salmi et al. 2012 for details of the z ∼ 1 sample). SFRs for these galaxies are based on 24 µm and UV observations, respectively, and are known to be unbiased on average (Daddi et al. 2007a; Elbaz et al. 2010). Both samples were divided into the same set of stellar mass (M∗) bins. The average SFR of SFGs in these bins, plotted as a function of M∗, is shown in Fig. 1a. The shallower slope of the z ∼ 1 SFR–M∗ relation compared to the z ∼ 2 sample is due to an Eddington bias introduced by the flux limit of the 24 µm data used to estimate their SFRs. By comparing like-for-like average X-ray emission (and inferred SMBH accretion rates) with average SFRs and using the SFGs as priors for our X-ray matching/stacking we ensure that this bias has no effect on our results.
The X-ray data used for this study were taken from the 4 Ms Chandra deep-field observations (Cycle 9 DDT; see Xue et al. 2011 for details), which entirely cover our SFG samples. To determine the average level of SMBH accretion taking place in the SFGs we account for X-ray
2 Mullaney et al.
TABLE 1
Derived Average Physical Properties of Sub-samples
(1) (2) (3) (4) (5) (6) (7) (8) (9)
Mass range NDet NStk hM∗i hSFRi hF2−10keVi hL2−10keVi hLBoli h ˙MBHi
z∼ 1 9.76 − 10.09 12 138 9.952 ± 0.088 3.89 ± 0.32 20+38−16 0.5 +1.0 −0.3 3.3 +5.8 −2.1 2.0 +3.6 −1.3 10.09 − 10.42 22 112 10.232 ± 0.092 7.19 ± 0.51 22+15−10 0.71 +0.94 −0.37 4.4 +5.3 −2.4 2.7 +3.2 −1.5 10.42 − 10.75 28 82 10.592 ± 0.098 12.62 ± 0.97 82+43−31 3.8 +2.9 −1.6 22 +17 −10 14 +10 −6 10.75 − 11.25 41 77 10.95 ± 0.14 16.0 ± 1.6 82+48−33 3.7 +2.5 −1.4 22 +14 −8 13.3 +8.5 −5.2 z∼ 2 9.76 − 10.09 20 327 9.907 ± 0.094 20.77 ± 0.89 9.9+7.6−5.1 2.8 +2.8 −1.3 17 +16 −8 10.3 +9.6 −5.0 10.09 − 10.42 32 206 10.24 ± 0.10 34.1 ± 2.0 17.3+7.2−5.6 4.0 +2.9 −1.5 24 +16 −10 14.7 +9.7 −5.8 10.42 − 10.75 34 67 10.564 ± 0.091 58.4 ± 5.3 50+24 −18 12.9+8.8−4.9 77+49−30 47+30−18 10.75 − 11.25 18 28 10.90 ± 0.11 151 ± 22 140+130 −80 25 +25 −12 150 +140 −70 90 +86 −44
Note. — (1) Stellar mass range (log[M⊙]), (2) Number of X-ray detected galaxies, (3) Number of stacked X-ray undetected galaxies, (4)
Stellar mass (log[M⊙]), (5) SFR (M⊙yr−1), (6) Observed-frame 2-10 keV X-ray flux (10−17ergs s−1cm−2), (7) Intrinsic AGN rest-frame
2-10 keV X-ray luminosity (1042ergs s−1cm−2) (8) Bolometric AGN luminosity (109 L
⊙), (9) SMBH accretion rate (10−3 M⊙yr−1).
Columns 4-9 contain mean-average values.
non-detections as well as X-ray detections. First, we used positional matching to identify those galaxies detected in X-rays, matching to the optical positions reported in Xue et al. (2011) and assuming a matching radius of 1′′
. The numbers of identified matches in each of our M∗ and redshift bins are given in Table 1. For the remain-der, we stacked the X-ray data at the optical positions of the SFGs, taking care to avoid detected sources and only stacking within 8′
of the average aim-point of the Chandraobservations.4 For each of our redshift and mass bins the total (i.e., detected + undetected) X-ray counts are dominated by the X-ray detected sources. Average count rates were determined by summing the counts from the detected sources and the stacks then dividing this by the total effective exposure times (of both detected and undetected sources). Average band ratios, fluxes at the observed-frame 2-10 keV band and obscuration-corrected luminosities at a rest-frame 2-10 keV band (i.e., LX) were calculated using the methodology outlined in Luo et al. (2008) which uses band-ratios to correct for obscuration (see our Table 1). The average contribu-tion to LXfrom star-formation was calculated using two different SFR-LXrelations (from Ranalli et al. 2003 and Vattakunnel et al. 2012) and subtracted to leave the in-trinsic LX of the AGN. Both relations estimate a non-AGN contribution of < 5% in each of our mass and red-shift bins, meaning this correction has no significant im-pact on our results.
Once the average intrinsic X-ray luminosities had been estimated for the SFGs in each of our M∗ and redshift bins, we used this information to estimate average AGN bolometric luminosities (i.e., LBol). For simplicity, we derive our main results using a constant bolometric cor-rection factor of 22.4 to convert LX to LBol (the me-dian bolometric correction factor of a sample of local, LX= 1041−46 ergs s−1 AGN from Vasudevan & Fabian 2007). From LBol we derive SMBH accretion rates (i.e.,
˙
MBH) using:
4 We note the results from our X-ray stacks are
con-sistent within the errors of those obtained using CSTACK (http://cstack.ucsd.edu/) developed by Takamitsu Miyaji, which uses the 2 Ms CDF-S data.
˙
MBH(M∗, z) = (1 − ǫ)Lbol(M∗, z)
ǫc2 (1)
where c is the speed of light in a vacuum and ǫ is the ef-ficiency by which mass is converted into radiated energy via the accretion process. Here we assume ǫ = 0.1 (e.g., Marconi et al. 2004), or that roughly 10% of mass within the accreting system is converted into energy that is ra-diated away via electromagnetic radiation, irrespective of MBH.
As the number of X-ray counts for each bin is domi-nated (i.e., > 80%) by X-ray detected sources, uncertain-ties on the mean LX were calculated using a bootstrap-ping technique; repeatedly selecting 2/3 of the detected sample in each bin at random and calculating the disper-sion of the resulting LX distribution. The uncertainties on LBol and ˙MBH were then propagated from our esti-mates of the uncertainties on the mean LX.
3. RESULTS
In Fig. 1b we plot the average LX of X-ray detected + undetected (i.e., stacked) SFGs as a function of M∗ for our two redshift samples. Both our z ∼ 1 and z ∼ 2 samples show a clear increase in their average LX with increasing M∗ for the mass range considered. This is in contrast to studies of individually detected X-ray AGN which find no such correlation (e.g., Mullaney et al. 2012). It is only when the scatter in LXdue to AGN vari-ability is averaged-out that the correlation between LX and M∗ for SFGs presents itself. A least-squares fit to these data gives LX∝M∗0.86±0.39 for the z ∼ 1 sample and LX∝M∗1.05±0.36 for the z ∼ 2 sample. As we ne-glect the (unknown) possible variations of accretion effi-ciencies and bolometric corrections with stellar masses, LX can be directly replaced by ˙MBH in these equations to give the same relationships between ˙MBH and M∗. Importantly, we also find that the average LX of SFGs increases with redshift, being a factor of 5.2 ± 1.4 higher, on average, at z ∼ 2 compared to z ∼ 1. This is com-parable to the factor of 6.1 ± 2.3 higher average SFRs of the z ∼ 2 sample.
To demonstrate this last point we have included in our LX-M∗ plot (Fig. 1b) the observed trend between
Fig. 1.—(a) Average SFRs (right-hand axis) versus stellar mass for our z ∼ 1 (open circles) and z ∼ 2 (filled squares) samples of SFGs (left-hand axis gives equivalent infrared luminosity for illustrative purposes only). Dotted and dashed lines indicate a least-squares linear fit to these data. (b) Average X-ray lumi-nosities of the SFGs in our samples (same symbols as top panel) after accounting for any host galaxy contribution. Lines have the same gradients as in the top panel, only normalised to best-fit the inferred ˙MBH, which is indicated in the right-hand axis. (c)
Average SMBH accretion rate to SFR ratio for our two redshift samples. The uncertainties on these points are consistent with a flat ˙MBH/SFR ratio with respect to M∗for both the z ∼ 1 and
z∼ 2 samples, indicated by the dotted and dashed lines, respec-tively. 1-σ uncertainties are included in each panel, but are smaller than the points in panel (a).
SFR and M∗derived from our two samples of SFGs (i.e., SFR∝M∗0.6 and SFR∝M∗0.9 for the z ∼ 1 and z ∼ 2 populations, respectively), normalised to fit the average inferred ˙MBHof the respective redshift sample but main-taining the gradient. Plotting ˙MBH/SFR as a function of M∗ (Fig. 1c) we find this ratio is only marginally de-pendent on M∗ and is strikingly similar for our z ∼ 1 and z ∼ 2 samples (i.e., MBH/SFR ∝ M∗˙ 0.3±0.4 and
˙
MBH/SFR ∝ M∗0.2±0.4 for the z ∼ 1 and z ∼ 2 samples, respectively). Furthermore, the uncertainties are consis-tent with a flat ˙MBH/SFR ratio with respect to M∗ for both samples (i.e., ˙MBH = [0.6 − 0.8] × 10−3·SFR for our z ∼ 1 sample and ˙MBH = [0.5 − 0.7] × 10−3·SFR for
our z ∼ 2 sample).5
By taking the average X-ray output of SFGs it follows that the ensemble growth rate of SMBHs increases with both increasing M∗ and redshift in a manner that is re-markably similar to the average levels of star-formation taking place in SFGs. The independence of the average
˙
MBH/SFR ratio on M∗implies its constancy during the rapid growth phases of galaxies. Next, we consider how this constant ratio conforms to our understanding of rel-ative SMBH growth both locally and at high redshifts.
The mass of a SMBH today, at redshift zf = 0, can be described in terms of its total accretion history since zi and its mass at zi, i.e.,6
MBH(zf) = MBH(zi) + Z z=zf
z=zi
˙
MBH(t)dt (2) Our observations support a constant average ratio be-tween the SMBH and galaxy growth rates, i.e., ˙MBH = α ˙M∗.7 Replacing the resulting integral with ∆M∗(z = zi→ zf), we obtain,
MBH(zf) = MBH(zi) + α∆M∗(z = zi→ zf) (3) Similarly, the stellar mass of the host galaxy at zf is given by,
M∗(zf) = M∗(zi) + ∆M∗(z = zi→ zf) (4) so the black hole to stellar mass ratio is given by,
MBH(zf) M∗(zf) =
MBH(zi) + α∆M∗(z = zi→ zf) M∗(zi) + ∆M∗(z = zi→ zf) (5) Defining β as the initial MBHto M∗ratio (relative to the growth rate ratio, i.e., α) and γ as the relative change in M∗, i.e., MBH(zi) = βαM∗(zi), γ = ∆M∗(z = zi→ zf) M∗(zi) (6) we obtain, MBH(zf) M∗(zf) = α γ + β γ + 1 ≈ α (when γ ≫ β) (7) Thus, as soon as enough activity has taken place so that the (uncertain) initial conditions can be neglected, one expects constant MBH to M∗ ratios independent of red-shift and roughly equal to the observed growth rate ratio. It is not surprising then that the growth ratios are close to the SMBH to stellar mass ratio inferred from today’s MBH–MBulge relationship, indicating that this relative growth rate is crucial in defining these ratios.
4. DISCUSSION: A HIDDEN AGN “MAIN SEQUENCE”
Our results suggest that it is coeval growth at constant relative rates averaged over cosmological timescales that
5 Adopting a luminosity-dependent bolometric correction factor
from Hopkins et al. (2007) gives ˙MBH/SFR ∝ M∗0.5±0.5 for both
redshift bins; the error-bars remain consistent with a flat distribu-tion.
6 We neglect merging SMBHs as they will not affect the
to-talmass contained within SMBHs while merger-induced starbursts contribute only ∼ 10% of stellar-mass build-up (Rodighiero et al. 2011).
7 Note: ˙M ∗≡ SFR
4 Mullaney et al.
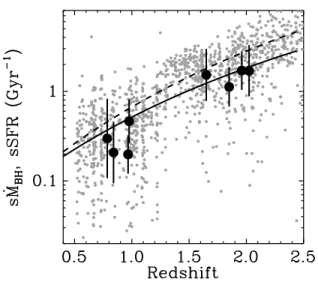
Fig. 2.— Specific SMBH accretion rates (i.e., s ˙MBH= ˙MBH/MBH; assuming MBH = 1.5 × 10⁻³M∗)
plot-ted as a function of redshift for our stellar mass and redshift bins (large black points). Included in this plot are the sSFRs of the galaxies in our samples (small gray points), and the sSFR-z relationships from Elbaz et al. (2011) and Pannella et al. (2009) (solid and dashed lines, respectively). We have increased the specific SMBH accretion rates by a factor of 2 to account for missing AGN due to e.g. obscuration, but note that the relativechange in average ˙MBH/MBHbetween our redshift bins is
remarkably similar to that of the sSFRs.
produces the links between SMBH and stellar mass in-ferred from the MBH–MBulgerelation. To address this in more detail there are a number of points that should be considered carefully.
First, we emphasise that our results are cosmologically relevant, referring to the bulk of the SMBH and galaxy growth. The 0.5 < z < 2.5 epoch spanned by our samples correspond to the vast majority of both global star (e.g., Dickinson et al. 2003; Magnelli et al. 2011) and SMBH (e.g., Marconi et al. 2004) formation history.
Likewise, although we miss the most luminous AGN their absence will not change our results. Integrating the “LADE” AGN X-ray luminosity function of Aird et al. 2010, we estimate that ∼20–30% of all SMBH accretion at 0.5 < z < 2.5 takes place in AGNs that are rare enough such that ≤ 3 would be expected to be found in our survey (i.e., rarer than three per 2 × 10⁵ Mpc3 at z ∼ 1 and three per 4 × 10⁵ Mpc3 at z ∼ 2, correspond-ing to LX> 2 × 1044ergs s−1and LX> 3 × 1044 ergs s−1, respectively). Similarly, we could miss . 2% of the SFR density because of volume effects. We note that the frac-tion of AGNs in low-SFR galaxies not included in our SFG sample is also negligible at these redshifts, being .10% (e.g., Mullaney et al. 2012).
Obscuration is a potentially more serious issue, as we will underestimate the contribution of the heavily ob-scured (i.e., Compton-thick) AGNs thought to be respon-sible for .50% of total SMBH growth (e.g., Gilli et al. 2007). This could introduce a factor of . 2 correction, but is unlikely to be substantially larger than the ob-served, unobscured contribution. Obscuration due to orientation effects (unified model) is unlikely to depend strongly on either mass or redshift and, as such, will not affect the observed correlations. It is unclear whether the levels of obscuration due to merger driven starbursts changes as a function of galaxy mass and/or redshift.
However, the fraction of starbursts does not appear to change significantly with redshift or galaxy mass and ac-counts for only 10–15% of all star-formation (at least for the ranges considered here; Rodighiero et al. 2011; Sargent et al. 2012).
This obscured AGN fraction, together with the fact that a fraction of the stars forming will quickly die due to stellar evolution, leads us to conclude that our results support a constant MBH to M∗ ratio of:
MBH
M∗ ≈ (1 − 2) × 10
−3 (8)
at 0.5 < z < 2.5 – consistent with the conclusions of Jahnke et al. (2009) and Cisternas et al. (2011a). This ratio is also consistent with the local MBH/MBulgeratio, suggesting that it is the same relation. At this point it is important to note that, while there is some evidence to suggest that todays MBH correlates most tightly with bulge mass (Kormendy et al. 2011), for the sake of this letter we do not distinguish between galaxy and bulge mass/SFR as it is impossible to reliably determine which of the stars formed at z & 0.5 will be in bulges by z ∼ 0. Having said that, it is thought the the majority of stars formed at these high redshifts in the M∗ range consid-ered will collapse to form massive bulges by z ∼ 0 (e.g., Renzini 2006), probably due to the effects of mergers.
Using Eqn. (8) we can compute approximate SMBH masses for our galaxy samples. Since the ˙MBHto SFR ra-tio has remained consistent with the SMBH and galaxy mass ratio since z ∼ 2 the specific SMBH growth rate (i.e., s ˙MBH= ˙MBH/MBH) traces the same trend with red-shift as the average sSFRs of SFGs (e.g., Pannella et al. 2009; Elbaz et al. 2011; Fig. 2). Thus, when doing en-semble (i.e., time) averages, the SMBH population forms an “AGN main-sequence” (where roughly ˙MBH∝MBH, on average) that follows the same trends with stellar mass and redshift as the so-called galactic main se-quence of e.g., Noeske et al. (2007); Elbaz et al. (2007); Daddi et al. (2007a).
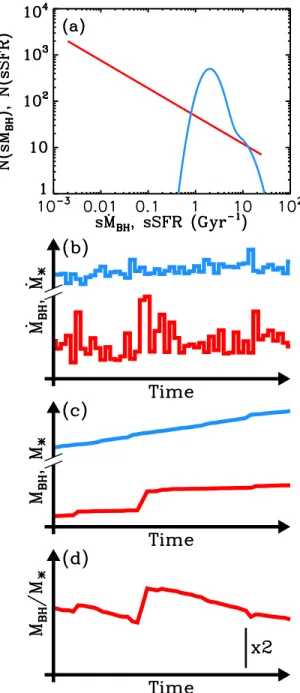
It is interesting to interpret these results in terms of the frequency of nuclear and star-forming activity in galaxies. For this, we consider the distribution of AGN Edding-ton ratios (λǫ∝ ˙MBH/MBH) and galaxy sSFRs. Recently, Aird et al. (2012) suggested that the λǫ distribution of X-ray AGNs can be described purely as a function of λǫ and redshift; i.e., independently of M∗ (Fig. 3a).8 This broad distribution for AGNs, which spans over four or-ders of magnitude in λǫ(see also, e.g., Babi´c et al. 2007; Hopkins & Hernquist 2009), contrasts with the distribu-tion of sSFR of galaxies that is remarkably narrow, yet also independent of M∗ (Sargent et al. 2012; Fig. 3a). This is the main reason why the AGN main sequence remains hidden; there are strong changes in s ˙MBH com-pared to minor changes in the sSFRs of galaxies (Fig. 3). This has the implication that outliers should exist in the MBH-M∗relation when the SMBH growth has taken advantage over the M∗growth and vice versa, in
qualita-8 Studies of optically-selected, broad-line quasars have reported
log-normal λǫ distributions. However, by selection, those AGNs
have considerably higher average LBol(≈ 1013L⊙; e.g., Shen et al.
2008) than our samples and, as such, are less directly relevant to our analyses.
Fig. 3.— (a): Probability distribution functions (PDFs) of s ˙MBH(∝ Eddington ratio; red: Aird et al. 2012) and sSFRs (blue;
Sargent et al. 2012) at a given redshift (arbitrary y-scaling). Note the broad s ˙MBHPDF, indicative of the large variations in nuclear
activity compared to the sSFR of the host. Lower three panels: Cartoon illustrating the growth rates (b) and total and relative masses (c and d, respectively) of SMBHs and their hosts. The host grows steadily, whereas the SMBH grows in fits and spurts, causing the SMBH mass to “lead and lag” the galaxy mass at dif-ferent times but, on average, remaining closely tied. Scale in panel (d) indicates a factor of 2 change.
tive agreement with observations (e.g., Alexander et al. 2008; Targett et al. 2012; also Volonteri & Stark 2011).
The rise of the specific growth of galaxies with red-shift has recently been attributed to the strong in-crease in the gas fractions of galaxies from z = 0 to 2 (Daddi et al. 2008, 2010; Tacconi et al. 2010; Geach et al. 2011). Given that the cosmological growth rate between SMBHs and M∗ remains roughly constant, it seems that gas fractions also play an important role in driving SMBH growth during this epoch. However, clar-ifying the physical processes (feedback, volume effects, etc.) that set ˙MBH/SFR ≈ 10−3 and determine how gas fraction translates to different sSFR and s ˙MBH distribu-tions (Fig. 3a) remains an open issue that is beyond the scope of this letter.
Our results provide insights into how the relation-ships between SMBHs and their host galaxies are forged. The vast majority (i.e., ≈98%) of galaxies that form our parent sample are main-sequence (MS) SFGs (e.g., Rodighiero et al. 2011). Morphological and dynamical studies do find evidence of mergers among these galax-ies (e.g., Elmegreen et al. 2007; F¨orster Schreiber et al. 2009), but being on the MS (Kartaltepe et al. 2011) im-plies their star-formation is not strongly enhanced by these interactions (Di Matteo et al. 2008). Such MS galaxies are responsible for ≈90% (Elbaz et al. 2011; Rodighiero et al. 2011; Sargent et al. 2012) of all star-formation taking place during this epoch. Of course, the most massive, distant galaxies and SMBHs probed here will have grown their mass at earlier times when other processes – such as major-mergers – may have played a more dominant role. However, for SFGs to have hM˙BH
SFRi ≈ MBH
M ∗|z=0 during the time when the bulk of to-day’s stellar and SMBH mass was built-up implies that a significant fraction of all SMBH growth takes place in MS galaxies whose SFRs are not enhanced by mergers. This view is consistent with recent studies of the sSFRs and morphologies of X-ray selected AGN hosts which find that the AGN population is dominated by non-mergers (e.g., Cisternas et al. 2011b; Schawinski et al. 2011; Mullaney et al. 2012; Kocevski et al. 2012; Santini et al. 2012). Indeed, results from recent hydrodynamical mod-els (e.g., Bournaud et al. 2011) suggest that it is possi-ble to have efficient SMBH accretion inside gas rich, high redshift clumpy galaxies, without invoking galaxy-galaxy interactions or mergers.
We thank M. Dickinson, R. Gilli, A. Renzini and the anonymous referee. We acknowledge financial support from STFC (DMA) and grants: ERC-StG UPGAL 240039, ANR-08-JCJC-0008.
REFERENCES Aird, J., Nandra, K., Laird, E. S., et al. 2010, MNRAS, 401, 2531
Aird, J., Coil, A. L., Moustakas, J., et al. 2012, ApJ, 746, 90 Alexander, D. M., & Hickox, R. C. 2011, arXiv:1112.1949 Alexander, D. M., Brandt, W. N., Smail, I., et al. 2008, AJ, 135,
1968
Babi´c, A., Miller, L., Jarvis, M. J., et al. 2007, A&A, 474, 755 Bournaud, F., Dekel, A., Teyssier, R., et al. 2011, ApJ, 741, L33 Cisternas, M., Jahnke, K., Bongiorno, A., et al. 2011a, ApJ, 741,
L11
Cisternas, M., Jahnke, K., Inskip, K. J., et al. 2011b, ApJ, 726, 57 Daddi, E., Dannerbauer, H., Elbaz, D., et al. 2008, ApJ, 673, L21 Daddi, E., Dickinson, M., Morrison, G., et al. 2007a, ApJ, 670,
156
Daddi, E., Alexander, D. M., Dickinson, M., et al. 2007b, ApJ, 670, 173
Daddi, E., Bournaud, F., Walter, F., et al. 2010, ApJ, 713, 686 Di Matteo, P., Bournaud, F., Martig, M., et al. 2008, A&A, 492,
6 Mullaney et al.
Dickinson, M., Papovich, C., Ferguson, H. C., & Budav´ari, T. 2003, ApJ, 587, 25
Elbaz, D., Daddi, E., Le Borgne, D., et al. 2007, A&A, 468, 33 Elbaz, D., Hwang, H. S., Magnelli, B., et al. 2010, A&A, 518, L29 Elbaz, D., Dickinson, M., Hwang, H. S., et al. 2011, A&A, 533,
A119
Elmegreen, D. M., Elmegreen, B. G., Ravindranath, S., & Coe, D. A. 2007, ApJ, 658, 763
F¨orster Schreiber, N. M., Genzel, R., Bouch´e, N., et al. 2009, ApJ, 706, 1364
Geach, J. E., Smail, I., Moran, S. M., et al. 2011, ApJ, 730, L19 Gilli, R., Comastri, A., & Hasinger, G. 2007, A&A, 463, 79 H¨aring, N., & Rix, H.-W. 2004, ApJ, 604, L89
Hopkins, P. F., & Hernquist, L. 2009, ApJ, 698, 1550
Hopkins, P. F., Richards, G. T., & Hernquist, L. 2007, ApJ, 654, 731
Jahnke, K., Bongiorno, A., Brusa, M., et al. 2009, ApJ, 706, L215 Karim, A., Schinnerer, E., Mart´ınez-Sansigre, A., et al. 2011,
ApJ, 730, 61
Kartaltepe, J. S., Dickinson, M., Alexander, D. M., et al. 2011, arXiv:1110.4057
Kocevski, D. D., Faber, S. M., Mozena, M., et al. 2012, ApJ, 744, 148
Kormendy, J., Bender, R., & Cornell, M. E. 2011, Nature, 469, 374
Luo, B., Bauer, F. E., Brandt, W. N., et al. 2008, ApJS, 179, 19 Magnelli, B., Elbaz, D., Chary, R. R., et al. 2011, A&A, 528, A35 Marconi, A., Risaliti, G., Gilli, R., et al. 2004, MNRAS, 351, 169
Mullaney, J. R., Pannella, M., Daddi, E., et al. 2012, MNRAS, 419, 95
Noeske, K. G., Weiner, B. J., Faber, S. M., et al. 2007, ApJ, 660, L43
Pannella, M., Carilli, C. L., Daddi, E., et al. 2009, ApJ, 698, L116 Ranalli, P., Comastri, A., & Setti, G. 2003, A&A, 399, 39 Renzini, A. 2006, ARA&A, 44, 141
Rodighiero, G., Daddi, E., Baronchelli, I., et al. 2011, ApJ, 739, L40
Salmi, F., Daddi, E., Elbaz, D., et al. 2012, submitted to ApJL Santini, P., Rosario, D., Shao, L., et al. 2012, ArXiv e-prints Sargent, M. T., B´ethermin, M., Daddi, E., & Elbaz, D. 2012,
ApJ, 747, L31
Schawinski, K., Treister, E., Urry, C. M., et al. 2011, ApJ, 727, L31
Shen, Y., Greene, J. E., Strauss, M. A., Richards, G. T., & Schneider, D. P. 2008, ApJ, 680, 169
Silverman, J. D., Lamareille, F., Maier, C., et al. 2009, ApJ, 696, 396
Tacconi, L. J., Genzel, R., Neri, R., et al. 2010, Nature, 463, 781 Targett, T. A., Dunlop, J. S., & McLure, R. J. 2012, MNRAS,
420, 3621
Vasudevan, R. V., & Fabian, A. C. 2007, MNRAS, 381, 1235 Vattakunnel, S., Tozzi, P., Matteucci, F., et al. 2012, MNRAS,
420, 2190
Volonteri, M., & Stark, D. P. 2011, MNRAS, 417, 2085 Xue, Y. Q., Luo, B., Brandt, W. N., et al. 2011, ApJS, 195, 10