HAL Id: hal-02551306
https://hal.archives-ouvertes.fr/hal-02551306
Submitted on 5 Jun 2020HAL is a multi-disciplinary open access archive for the deposit and dissemination of sci-entific research documents, whether they are pub-lished or not. The documents may come from teaching and research institutions in France or abroad, or from public or private research centers.
L’archive ouverte pluridisciplinaire HAL, est destinée au dépôt et à la diffusion de documents scientifiques de niveau recherche, publiés ou non, émanant des établissements d’enseignement et de recherche français ou étrangers, des laboratoires publics ou privés.
Distributed under a Creative Commons Attribution - NonCommercial - NoDerivatives| 4.0 International License
Silicon isotope ratio measurements by inductively
coupled plasma tandem mass spectrometry for
alteration studies of nuclear waste glasses
A. Gourgiotis, T. Ducasse, E. Barker, Patrick Jollivet, S. Gin, Sylvain Bassot,
Charlotte Cazala
To cite this version:
A. Gourgiotis, T. Ducasse, E. Barker, Patrick Jollivet, S. Gin, et al.. Silicon isotope ratio measurements by inductively coupled plasma tandem mass spectrometry for alteration studies of nuclear waste glasses. Analytica Chimica Acta, Elsevier Masson, 2017, 954, pp.68-76. �10.1016/j.aca.2016.11.063�. �hal-02551306�
here + X O 9 l! S > K / + X O 9 l! S 0 E Figure
to download Figure: Figures revised versic
0.05 0.06 0.07 0.08 0.09
29Si16Ox+ / 28Si16Ox+
Fig.1
Q1 (m/z) ORS
Q2 (m/z)
O260
28Si+
acl6o+-,
14N2+Jl
44Ca+, 60Ni+, 44Ca16O
14N21H+ 14N15N+ 45Sc+, 61Ni+, 45Sc16O+ O2 61 3°Si+. 14N16O+ 46Ca+, 46Ti+, 62Ni+ 46Ti16O+, 46Ca16O+ O2 62 30 30Si16O2+ 30Si16O+ 14N16O2+ 46
Fig.2
+ Z
0
9 i! S 8 Z :/ + Z O 9 i !S 6 zJ
0 QSH %Fig
0.1 1 10 10029Si16O2+ intégration time (s)
°.5 S© C/5 00 0.4 O CZ2 O Q
in
0.3 0.2 0.1b
• • 11 • • <» 10 100 1000 Number of sweeps 1.3
+ Z 0 9 l! S 8 Z
/
+ Z 0 9 l! S 6 Z 0.0530 0.0525 0.0520 0.0515 0.0510 0.0375 0.0370 0.0365 0.0360 0.0355Fig.4
+ Z 0 9 l! S 8 Z/
+ Z 0 9 l! S o £+ Z 0 9 l! S 8 Z
/
+ Z 0 9 l! S o £ 0.052 0.053 0.054 29Si16O2+ / 28Si16O2+Fig.5
*Revised manuscript (Clean version) Click here to view linked References
1 2 3 4 5 6 7 1 2 3 4 9 10 11 12 13 14 15 16 17 18 19 20 21 22 23 24 25 26 27 28 29 30 31 32 33 34 35 36 37 38 39 40 41 42 43 44 45 46 47 48 49 50 51 52 53 54 55 56 57 58 59 60 61 62 63 64 5 6 7 8 9 10 11 12 13 14 15 16 17 18 19 20 21 22 23 24 25
Silicon isotope ratio measurements by inductively coupled plasma tandem
mass spectrometry for alteration studies of nuclear waste glasses
•••••1 2 1 o 9
Gourgiotis Alkiviadis , Ducasse Thomas , Barker Evelyne , Jollivet Patrick , Gin Stéphane , Bassot Sylvain1, Cazala Charlotte1
1 : Institut de Radioprotection et de Sûreté Nucléaire (IRSN) PRP-DGE/SRTG/LT2S
2 : CEA, DEN, DTCD, SECM, F-30207 Bagnols-sur-Ceze, France
Keywords
Silicon isotope ratios, triple quadrupole, ICP-QQQ, ICP-MS/MS, nuclear glasses, tandem mass spectrometry
26 27 28 29 30 31 32 33 34 35 36 37 38 39 40 41 42 43 44 45 46 47 48 49 50 51 52 53 54 55 56
Abstract
High-level long-lived nuclear waste arising from spent fuel reprocessing is vitrified in silicate glasses for final disposal in deep geologic formations. In order to better understand the mechanisms driving glass dissolution, glass alteration studies, based on silicon isotope ratio monitoring of Si-doped aqueous solutions, were carried out in laboratories.
In this work were explored the capabilities of the new type of quadrupole-based ICP-MS, the Agilent 8800 tandem quadrupole ICP-MS/MS, for accurate silicon isotope ratio determination for alteration studies of nuclear waste glasses. In order to avoid silicon polyatomic interferences a new analytical method was developed using O2 as the reaction gas in the Octopole Reaction System (ORS), and silicon isotopes were measured in mass-shift mode. A careful analysis of the potential polyatomic interferences on SiO+ and SiO2+ ion species was performed, and we found that SiO+ ion species suffer from important polyatomic interferences coming from the matrix of sample and standard solutions (0.5M HNO3). For SiO2+ no interferences were detected and thus these ion species were chosen for silicon isotope ratio determination. A number of key settings for accurate isotope ratio analysis like, detector dead time, integration time, number of sweeps, wait time offset, memory blank and instrumental mass fractionation, were considered and optimized. Particular attention was paid to the optimization of abundance sensitivity of the quadrupole mass filter before the ORS. We showed that poor abundance sensitivity leads to a significant shift of the data away from the Exponential Mass Fractionation Law (EMFL) due to the spectral overlaps of silicon isotopes combined with different oxygen isotopes (i.e. 28Si16O18O+, 30Si16O16O+). The developed method was validated by measuring a series of reference solutions with different Si enrichment. Isotope ratio trueness, uncertainty and repeatability were found to be <0.2%, <0.5% and <0.6%, respectively. These performances meet the requirements of the studies of nuclear glasses alteration and open up possibilities to use this method for precise determination of silicon content in natural samples by Isotope Dilution.
57 58 59 60 61 62 63 64 65 66 67 68 69 70 71 72 73 74 75 76 77 78 79 80 81 82 83 84 85 86 87 88
1. Introduction
Vitrification of liquid effluents issued from the reprocessing of spent nuclear fuel is considered to be the best solution for long-term immobilization of radionuclides[1]. Minor actinides and fission products in countries which have chosen the reprocessing of spent fuel are confined in borosilicate glasses. Those materials are considered particularly suitable for final disposal in deep, low permeable, geologic formations[2-4]. Work is still in progress to better understand the physical and chemical mechanisms of glass behavior under repository conditions[5, 6]. Water is considered to be the main cause of glass package corrosion and processes influencing the glass dissolution rate[7-13] must be understood sufficiently well to estimate the performance of nuclear waste glass in its disposal environment over geologic time scales. In this context, isotopic tracers are considered a powerful tool as they are able to trace ion exchanges between the solution and the glass[7, 14-16]. They are used to determine the contribution of the solution and the glass to the isotopic composition of the alteration layers. To this end, recent studies focused on leaching solutions containing amorphous silica highly enriched in Si [7, 16] in which silicon isotope ratio evolution is monitored at regular time intervals.
For silicon isotope ratio measurements, gas source Isotope Ratio Mass Spectrometry (IR- MS)[17] was the predominant technique, but it has been shown that Multi Collection Inductively Coupled Plasma Mass Spectrometry (MC-ICPMS) offers important advantages[18, 19]. The latter technique offers faster analytical protocols (both sample preparation and analysis time), and much smaller samples are required. However, one of the largest drawbacks in mass spectrometry coupled with a plasma source is the occurrence of polyatomic interferences deteriorating isotope ratio accuracy. The presence of a plethora of polyatomic interferences for silicon isotopes has been well documented[18, 20-22], and some of the most prominent are related to 14N2+, 14N2H+ and 14N16O+, which significantly overlay the Si , Si and Si peaks, respectively. Silicon isotope polyatomic interferences originate from reactions of the sample solvent (i.e. diluted HNO3) and entrained atmospheric gases in the plasma, and thus they cannot be removed by chemical purification of the analyzed samples.
89 90 91 92 93 94 95 96 97 98 99 100 101 102 103 104 105 106 107 108 109 110 111 112 113 114 115 116 117 118
In order to overcome this problem and to achieve accurate isotope ratio measurements, MC- ICP-MS with high-resolution capabilities was used[20, 23-25]. In the same context, High Resolution sector field ICP-MS (HR-ICP-MS) was also employed for the determination of silicon concentrations by isotope dilution[26, 27]. An hexapole collision/reaction cell based MC-ICP-MS was also used for silicon isotope ratio measurements in low resolution[28]. However, 14N16O+ interference on 30Si+ was not resolved, and only 29Si+ / 28Si+ ratios were measured.
Silicon isotope ratio determination by quadrupole ICP-MS (ICP-QMS) has not yet been reported to our knowledge. The lack of high resolution capabilities of the ICP-QMS makes silicon isotope ratio analysis quite complex. However, ICP-QMS has been widely employed for total silicon determination in a large variety of sample matrices. The isotope Si was mainly used; and to alleviate the problem of polyatomic interferences, Dynamic Reaction Cell (DRC)[29-31], Collision Reaction Interface (CRI)[32, 33], and Octopole Reaction System (ORS)[34, 35] with different gases (NH3, O2, CH4, H2, He) were used.
Recently, Agilent Technologies developed a new ICP-MS using a tandem quadrupole mass filter (ICP-MS/MS)[36, 37]. This new instrument is equipped with an ORS which is placed between the two quadrupole mass filters. When the MS/MS mode is activated, the first quadrupole prevents all off-mass ions from entering the cell, offering superior potential to deal with spectral overlaps in reaction mode.
Since the commercialization of the ICP-MS/MS, several scientific works with very interesting analytical results have been published, and a tutorial review is given by Balcaen et al.[38]. With this new instrument, and by using O2 as the reaction gas, total silicon determination was facilitated[39-42] due to a more efficient control of polyatomic interferences compared to a single quadrupole collision/reaction cell-based ICP-QMS. Moreover, with the ICP-MS/MS, more than one isotope can be used for total silicon determination; Amais
et
a/.[40] investigated the potential use of 28Si16O+ and 29Si16O+ ion species, and Aureliet
a/.[41] successfully used the three silicon isotopes for silicon content determination of silica nanoparticles. In both cases, calibration curves of the respective silicon isotopes were used supposing silicon natural isotope abundance in samples and standard solutions.119 120 121 122 123 124 125 126 127 128 129 130 131 132 133 134 135 136 137 138 139 140 141 142 143 144 145 146 147 148 149 150
However, although ICP-MS/MS was already used for isotope ratio measurements[37, 43-48], Silicon isotope ratio determination has not yet been reported with this technique.
The main objective of this work is to explore the potential of the tandem quadrupole ICP for silicon isotope ratio determination for alteration studies of nuclear glasses. In the present study, we report a novel analytical method which takes into account a number of key settings for accurate silicon isotope ratio analysis like, polyatomic interferences, detector dead time, integration time, number of sweeps, wait time offset, memory blank and instrumental mass fractionation. For the validation of the method, a series of reference solutions with different 29
Si enrichment levels were used. The detailed analytical development of the method is presented below.
Experimental
2.1 Instrumentation
The Agilent 8800 ICP-MS/MS (Agilent Technologies, Tokyo, Japan) used in this work has recently been installed at the LT2S laboratory of the Institut de Radioprotection et de Sûreté Nucléaire (IRSN). O2 was used as the reaction gas in the ORS, and silicon isotope ratio measurements were performed in mass shift mode (xSi16O2+). The O2 was introduced through the 4th inlet line. A Peltier-cooled (2°C) Scott-type spray chamber with a PFA nebulizer (0.1 mL min-1, ESI, USA) was used as the introduction system. In order to avoid discrete noise components caused by rotation of the peristaltic pump, the self-aspiration mode was used for the sample introduction to the ICP-MS/MS. All of the experimental parameters were optimized daily with a pure silicon test solution (100 ng g-1) in order to obtain the optimum signal-to-background ratio of m/z = 60. Typical sensitivity and stability (Relative Standard Deviation, %RSD) values measured for 5 min at m/z=60 are ~8*105 counts per second (cps) / ppm (pg g-1) and ~0.9%, respectively (1 sigma). Before each analytical session, a peak center mass calibration at m/z=60 (for the quadrupole mass filter after the ORS) was performed. It should be noted that peak center calibration is crucial for high order reaction product ions[49]. For all isotope measurements, the pulse counting mode was ensured. Typical instrumental settings and measurement parameters used throughout the experiments are summarized in Table 1.
151 152 153 154 155 156 157 158 159 160 161 162 163 164 165 166 167 168 169 170 171 172 173 174 175 176 177 178 179 180
2.2 Samples and reagents
Two silicas were used for the préparation of reference solutions and for Silicon isotope ratio measurements: i) the Chemgas silica material, highly enriched in Si ( Si < 0.01 %, Si = 99.4 %, 30Si = 0.6 %), with 29Si/30Si = 165.7(8) and, ii) the standard reference material IRMM-018a[50] (28Si = 92.22036 %, 29Si = 4.68730 %, 30Si = 3.09234 %), which for this work represents the natural silicon isotope abundance. The 29Si/28Si and 30Si/28Si isotope ratio values of IRMM-018a are equal to 0.0508272(40) and 0.0335320(42), respectively. For silica digestion, the alkali fusion method was used with KOH (Suprapur) flux and nickel crucibles. All dilutions were performed with 0.5 M (mol L-1) HNO3 obtained from Ultrapur (60 %) nitric acid and de-ionized water (18.2 MQ.cm Milli Q system, Millipore, USA). The same acid was used as the blank solution and also for the instrument-washing procedure between standards and samples. Sample purification was performed using BioRad AG50 X-12 (200 400 mesh) cation exchange resin. For instrument-tuning and oxygen flow rate optimization in the ORS, a solution of 100 ng g-1 of VWR pure silicon solution was used. For all measurements, Ultrapur O2 gas 5.2 quality (99.9992% purity) was injected in the ORS.
2.3 Sample préparation
Around 10 mg of Chemgas and 200 mg of IRMM-018a were mixed with KOH (Suprapur) and melted at 600°C. The proportion of the mixture between the silica powder and the KOH flux used in this work is mSiO2 / mKOH ~ 1/10. Potassium hydroxide was preferred over other fluxes such as lithium metaborate and alkaline carbonates because it provides the simplest composition and is easy to eliminate with ion-exchange resin. After alkali fusion, de- ionized water and diluted HNO3 (0.5 M) was added into the digested materials in order to yield final solution concentrations of 100 ppm and 200 ppm for the Chemgas and the IRMM- 018a, respectively. The solutions are then stored in chemically inert PTFE vessels.
181 182 183 184 185 186 187 188 189 190 191 192 193 194 195 196 197 198 199 200 201 202 203 204 205 206 207 208 29
Five reference solutions with different Si enrichment were fabricated by gravimétrie mixing of the Chemgas and the IRMM-018a solutions. Values of the reference solutions are presented in table 2. The ô29Si (ô29Si = [(29Si/28Si)sample / (29Si/28Si)iRMM-oi8a - 1]*1000) of the mixing solutions was adjusted roughly to 10 %o, 30 %o, 50 %o, 70 %o and 100 %o. This isotope composition of the reference solutions was chosen because of the same order of magnitude with the silicon isotope ratio variation, which is observed for alteration studies of nuclear glasses[15].
ô Si in the mixing solutions is lower than 0.1 %o. Isotope ratio uncertainties of the reference solutions were calculated by using the binary mixing equation and by propagating uncertainties of the isotope ratios, of the weights of the solutions as well as of their concentrations. Uncertainty propagation was performed using Monte Carlo simulations.
Before silicon isotope ratio analysis, reference solutions and the IRMM-018a were purified using BioRad AG50 X-12 (200-400 mesh) cation exchange resin, as described in detail by Georg
et
a/[23].2. Results and discussion
3.1 Mass-shift method for interference-free silicon isotope détection
As previously mentioned, accurate silicon isotope measurements by plasma source spectrometers is hampered by the presence of polyatomic interferences. As for this work, since diluted HNO3 (0.5 M) is the matrix of standards and samples, the generated major polyatomic interferences will contain N, O and H. A list of the major potential silicon interferences (after Engstrom
et
a/.[20]) is presented in table 3. In order to overcome this problem, oxygen was chosen as the reaction gas in the ORS. The reaction of Si+ with O2 is an O-atom transfer reaction (Si+ + O2 —— SiO+ + O) and is slightly endothermic[51]. Typically endothermic reactions do not occur spontaneously. However, the plasma source and collisional processes in the cell provide additional energy, which promotes the reaction, enabling the O2 mass-shift method to be applied.209 210 211 212 213 214 215 216 217 218 219 220 221 222 223 224 225 226 227 228 229 230 231 232 233 234 235 236 237 238 239
In the mass-shift mode, the first quadrupole (Q1) works as a unit mass filter allowing only ions with m / z = 28, 29 and 30 entering the ORS to react with O2. The second quadrupole (Q2) selects ions with m / z = 44, 45 and 46, corresponding to the ions of xSi16O+. The oxygen flow in the ORS was optimized by controlling both the signal intensity and the signal-to- background ratio at m/z = 44, and the optimum flow was found at 0.26 mL min-1.
In order to investigate if m / z = 44, 45 and 46 are free of polyatomic interferences, 0.5 M HNO3 blank solution was measured, and count rate ratios (cps45 / cps44, cps46 / cps44) were reported in a three isotope plot and compared to the Exponential Mass Fractionation Law (EMFL, Fig.1). The EMFL expresses the kinetic isotope fractionation[52] and was used as an indicator of data quality as unresolved interferences should cause ratios to be shifted away from the EMFL. For the calculation of the EMFL, the IRMM-018a reference values were used. Typical count rates for cps44, cps45, cps46, in blank solution were found to be -8.6*10 , ~6.0*102 and ~18.5*103, respectively and typical 28Si16O+ signal for 100 ng g-1 of Si was ~9*105 cps.
As can be seen in figure 1, signal ratios for HNO3 0.5 M (green squares) are not in good agreement with the EMFL. If the recorded signals at m / z = 44, 45 and 46 were generated only by xSi16O+ species, cps45, 46 / cps44 signal ratios correspond to 29, 30Si16O+ / 28Si16O+ ratios, which should be in good agreement with the EMFL (silicon could come from blank impurities and/or instrument silicon-containing materials with natural isotope composition close to the IRMM-018a in both cases). The high cps46 / cps44 ratios relative to the EMFL clearly point to the presence of an important interference at m / z = 46. 14N16O+ ion species, formed in the plasma after passing through the first quadrupole filter (m / z = 30), can react with O2 in the ORS, forming 14N16O2+ which interferes with 30Si16O+ at m / z = 46. In order to control the dependence of 14N16O2+ formation against HNO3 concentration, two HNO3 solutions with different concentrations (0.1 M and 1M) were fabricated from 60 % Ultrapur HNO3, and each solution was measured twice. From figure 1, it is clear that higher HNO3 concentrations favor not only 14N16O2+ formation but also a polyatomic interference at m / z = 45. In fact, the same applies to 14N21H+ and 14N15N+ ion species (m / z = 29) which are formed in the plasma and can react with O2 in the ORS, producing 14N216O^H+ and 14N15N16O+ which interfere with 29Si16O+ at m / z = 45. It should be noted that even if 14N216O1H+, 14N15N16O+
14 15 16 +
and 14N16O2+ are potentially the dominant inferences in this work, to a lesser extent ,14N2+ and14
240 241 242 243 244 245 246 247 248 249 250 251 252 253 254 255 256 257 258 259 260 261 262 263 264 265 266 267 268
12C16Q+ (m / z = 28) can react with O2 producing 14N216O+ and 12C16Q2+ at m / z = 44, interfering with 28Si16O+ ion species at m /z = 44.
The potential formation of polyatomic interferences at m / z = 44, 45 and 46 was based on the summary table of polyatomic interferences in ICP-MS after Thomas W. May and Ray H. Wiedmeyer[21].
Therefore, on shifting m / z from 28, 29, 30 to 44, 45, 46, we observed that xSi16O+ ion species are still affected by polyatomic interferences. Thus, this method was not satisfactory for silicon isotope ratio measurements. Moreover, it is worth mentioning that the dependence of the polyatomic interferences with the HNQ3 concentration makes their control between different standards and samples complicated and thus their correction quite complex.
Another product ion of the silicon reaction with O2 is the xSiO2+. The potential use of silicon dioxide for silicon isotope ratio measurements was investigated using the mass shift mode. The Q1 was settled at m / z = 28, 29, 30 and the Q2 at m / z = 60, 61, 62. For the oxygen flow optimization in the ORS, the signal intensity and the signal-to-background ratio at m/z = 60 were monitored, and the optimum flow was found at 0.24 mL min-1. To control the presence of polyatomic interferences at m / z = 60, 61 and 62, the same procedure described previously was performed. Typical counts rates in blank solution (HNO3 0.5 M) can be found in section 3.4. As can be seen in figure 1, signal ratios for all HNO3 solutions are in good agreement with the EMFL, and no dependence of signal ratios with HNO3 concentration was observed. This confirms that m / z = 60, 61, 62 are free of polyatomic interferences, and therefore, xSiO2+ ion species were chosen for silicon isotope ratio determination.
SiO2 was already used for total silicon concentration determination in complex matrices allowing for the improvement of detection limits relative to that obtained for silicon monoxide[39, 42].
Isobaric interferences at m / z = 44, 45, 46 and m / z = 60, 61, 62 (44,46Ca+, 45Sc+, 46Ti+, 60, 61, 62Ni) as well as their oxides (i.e. 44,46Ca16O+, 45Sc160+, 46Ti16Q+) were not considered because even if traces of these elements were still present in samples and standards after chemical purification, they were discarded from Q1 mass filter. Some of these inferences are presented in table 3.
269 270 271 272 273 274 275 276 277 278 279 280 281 282 283 284 285 286 287 288 289 290 291 292 293 294 295 296 297
A schematic représentation of the operating principle of the tandem mass spectrometer for Silicon isotope ratio measurement as well as the added value of the silicon isotope measurement as xSi16Ü2+ ion species are shown in figure 2.
3.2 Optimization of data acquisition parameters for isotope ratio measurements.
A number of key settings for accurate silicon isotope ratio measurements were tested and optimized. The reliability of the detector dead time (adjusted by the manufacturer at 31.8 ns) was controlled using silicon solutions with different concentrations (between 100 ng g-1 and 700 ng g-1). No significant variation of the 29, 30Si16O2+ / 28Si16O2+ ratios with the silicon concentration was observed, and thus no reevaluation of the detector dead time was needed.
The effect of the integration time and the number of sweeps per replicate on the isotope ratio precision was also investigated. The isotope ratio precision was expressed as the Relative Standard Deviation (%RSD) of the 29Si16O2+ / 28Si16O2+ ratio for 10 replicates. For all these tests, a solution of 400 ng g-1 of IRMM-018a was used. This concentration was chosen because it is close to that which was used for reference solution measurements. First, the integration time of the 29Si16O2+ was varied and that of 28Si16O2+ was kept constant at 1 s. During the optimization tests of the integration time, the number of sweeps was fixed at 1 and for this reason the integration time is the dwell time of the detected ion species.
As expected, the increase of the integration time significantly improved the %RSD of 29Si16O2+ / 28Si16O2+ ratio, and the improvement follows the counting statistics law (Fig. 3a). The counting statistics law is described by the following equation:
%RSD = 100 x V(1/c29 + 1/c28) (1)
where c29 and c28 are the total counts (cps x integration time) for 29Si16O2+ and 28Si16O2+ respectively. As can be seen from the counting statistic law (Fig. 3a), integration times higher than 6 s result in a slight improvement of the %RSD. For this reason, and in order to keep the total analysis time as low as possible, 6 s was chosen as the integration time for both 29Si16O2+ and 30Si16O2+ as their abundances are similar. In the same context, the increase of the 28Si16O2+ integration time beyond 1 s does not bring a significant improvement of the %RSD (figure 3a, dashed lines), and thus, 1 s was chosen as the integration time for 28Si16O2+.
28 16 +
298 299 300 301 302 303 304 305 306 307 308 309 310 311 312 313 314 315 316 317 318 319 320 321 322 323 324 325 326
Then the intégration times were kept constant (6 s for 29, 30Si16Ü2+ and 1 s for 28Si16Ü2+), and the number of sweeps per replicate was varied. The role of the sweeps is to rapidly scan the different isotopes (ion species) in order to approximate a simultaneous measurement. As can be seen in figure 3b, the number of sweeps does not significantly influence the ratio %RSD, and 20 sweeps per replicate was chosen for silicon isotope ratio measurements. With this number of sweeps, the dwell time of 29, 30Si16O2+ and 28Si16O2+ was 0.3 s and 0.05 s respectively.
Particular attention was paid to the optimization of the Wait Time Offset (WTÜ). The WTÜ is an additional wait time to the Q1 settling time, compensating for the slowdown of the ions in the ORS and giving the system time to arrive at steady state conditions[47, 53]. Different values of WTO were tested; and as can be seen in figure 4, no significant influence on the , 30Si16O2+ / 28Si16O2+ ratio was noticed. A WTO of 3 ms was selected for this work.
No replicates were performed for the measurements which were used for the optimization of the data acquisition parameters and ratio uncertainties presented in figure 4 were calculated following the next équation: 2*SD/Vn, were
SD
is the Standard Deviation andn
the number of replicates per measurement, in this casen
= 10.3.3 Optimization of the abundance sensitivity
Several measurements of the IRMM-018a standard solution (400 ng g-1) were performed, and silicon dioxide ratios were reported in a three-isotope plot (Fig. 5, blue dots). As can be seen, the data are significantly shifted away from the EMFL. As silicon measurement in its dioxide form is not suffering from polyatomic interferences, the influence of the abundance sensitivity of the Q1 mass filter was examined to explain this shift.
Abundance sensitivity is one of the most important figures of merit in a mass spectrometer system for precise isotope determination. It describes the signal contribution of the peak tail of a high-abundance isotope with mass M at neighboring masses (M ± 1, M ± 2,
etc).
Although abundance sensitivity is influenced by several factors (design of the quadrupole rods[54], frequency of the power supply,etc
.), kinetic energy of the ions, as they enter the quadrupole, operating vacuum[55] and peak resolution, has the biggest impact.327 328 329 330 331 332 333 334 335 336 337 338 339 340 341 342 343 344 345 346 347 348 349 350 351 352 353 354 355 356
Although sequential transmission of Silicon isotopes into the ORS prevents spectral overlaps due to the presence of different oxygen isotopes[44] (i.e. 28Si16O18O+, 30Si16O16O+), accurate silicon isotope ratio measurement can be hampered by the contribution of Si peak tailing on 29Si+ and 30Si+ (at M+1 and M+2). During 29Si+ and 30Si+ ion transmission through Q1mass filter, a small amount of 28Si+ enters the ORS and, 28Si16O17O+ (m/z = 61) interferes with 29Si16O16O+ (m/z = 61) shifting the data to the right and, 28Si16O18O+ (m/z = 62) and 28Si17O17O+ (m/z = 62) interfere with 30Si16O16O+ (m/z = 62) shifting the data upwards (Fig.5). Therefore, Si peak tail in high masses can explain the shift of the ratio data away from the EMFL.
When the ORS is pressurized with O2, the analyzer pressure increases from ~ 2.4*10-4 Pa (no gas in the ORS) to ~ 6.3*10-4 Pa (with 0.24 mL min-1 of O2 in the ORS). It is well accepted that a lower vacuum in the analyzer can lead to more collisions between gas molecules and ions, resulting in a higher spread in kinetic energy of the ions and therefore more of a tail mainly at the low mass side of the main peak[55]. As our aim was to work in optimum condition of signal-to-background ratio, the O2 flux was maintained at the same value and, no investigations were carried about the operating vacuum of the instrument.
Parameters influencing the peak resolution and the kinetic energy of the ions entering the
quadrupole were explored and optimized. The
Q1 Mass Offset, Q1 Mass Gain
andExtract 2,
were settled in order to minimize Si peak tailing contribution on Si and Si . With the first two parameters, the peak resolution was improved from ~ 0.8 amu to ~ 0.57 amu (at 10% of peak high). The last parameter allowed the reducing of the ion kinetic energy, which leads to an increase in the residence time of ions in the quadrupole mass analyzer and results in improved mass separation. After parameter optimization, data fit well with the EMFL (Fig. 5, red dots), confirming that Q1 abundance sensitivity was efficiently improved. However, it should be noted that peak tailing improvement was accompanied by a sacrifice in sensitivity of about 15%. Sensitivity performance, presented in section 2.1 (Instrumentation), has taken into account abundance sensitivity optimization.
357 358 359 360 361 362 363 364 365 366 367 368 369 370 371 372 373 374 375 376 377 378 379 380 381 382 383 384 385
3.4 Memory blank and instrumental mass fractionation
For memory blank, a washing procedure to reduce signal intensities was applied after every sample or standard. This procedure included a short pre-wash of the auto-sampler probe for 10 s with 0.5 M HNO3 and a wash for 2 min with the same acid. After washing, silicon dioxide intensities were measured for 0.5 M HNO3 blank solution and then corrected to sample and standard measurements. Typical intensities for 28, 29, 30Si16O2+ in blank solution were found to be ~ 800 cps, ~ 40 cps and ~ 30 cps, respectively. The wash procedure effectively reduces signal intensities to the original blank values. Procedural blank intensities were found to be at the same level with that of HNO3 blank solution.
The sample-standard bracketing procedure (standard solution (IRMM-018a) - sample ( Si- enriched reference solutions) - standard solution (IRMM-018a)) was adopted to correct for instrumental mass fractionation. To do this, the exponential mass fractionation law[56] was used:
Rtrue Rmeas (m1 / m2^
where
R
true andR
meas are the true and measured isotope ratios for isotopes 1 and 2, withm
1and
m
2 being their respective atomic masses, andp,
the mass fractionation factor. TheP
factors were calculated for both 29Si / 28Si and 30Si / 28Si ratios (in xSiO2+ form) of the IRMM- 018a standard solution (p29/28, p30/28). These factors were used for the correction of the isotope fractionation for the respective ratios ( Si/ Si, Si/ Si) of the reference solutions.
386 387 388 389 390 391 392 393 394 395 396 397 398 399 400 401 402 403 404 405 406 407 408 409 410 411 412 29
3.5 Isotope composition détermination of Si-enriched reference solutions
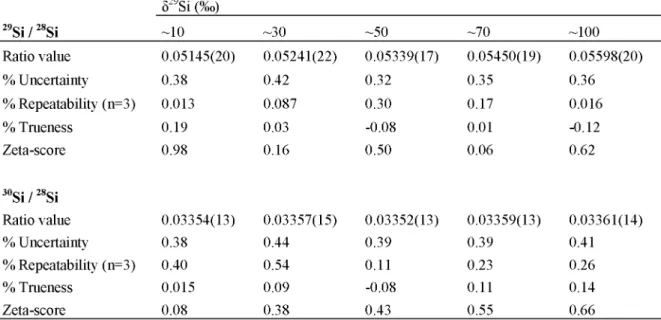
The developed method described above was applied to measure isotope composition in a series of reference solutions with different Si enrichment (Table 2). Silicon isotope ratio measurements were found to be in good agreement with the values of the reference solutions (zeta-score < 2, according to ISO 13528[57]) that allowed for the validation of our method (Fig. 6).
Each measurement consisted of fifteen consecutive replicates and every solution was measured three times in order to estimate the method repeatability which was calculated as the %RSD for the three measurements.
Isotope ratio uncertainties were calculated for each individual measurement by propagating uncertainties of the mass fractionation factors (^29/28, ^30/28) and of the measured silicon ratios (calculated using 2*SD/Vl5). The detailed equation for uncertainty propagation used in this work can be found in Section 5 of the Supplementary Information by Gourgiotis et al.[58]. The method repeatability and the isotope ratio uncertainties were calculated for a coverage factor
k
= 2.This method allowed achieving isotope ratio trueness, uncertainty and repeatability at <0.2%, <0.5%, <0.6%, respectively. Reference solution repeatability was similar to repeatability obtained for the IRMM-018a (0.2 % and 0.4 % for 29, 30Si/28Si, n = 16) during the analytical protocol for the measurement of the reference solutions (~4h). These performances are similar to those obtained for silicon isotope measurements by HR-ICP-MS for silicon Isotope Dilution[27]. Average values of, isotope ratios, uncertainties, zeta-score, repeatability and trueness can be found in table 4.
413 414 415 416 417 418 419 420 421 422 423 424 425 426 427 428 429 430 431 432 433 434 435 436 437 438 3.6 Conclusion
This is the first time where Silicon isotope ratio measurements were performed by quadrupole- based ICP-MS and more specifically by ICP-MS/MS. In order to avoid silicon polyatomic interferences, oxygen was used as the reaction gas in the ORS, and silicon isotope determination was performed in mass-shift mode using SiO2+ ion species. A number of key parameters for accurate isotope ratio measurements were carefully evaluated and corrected. With this new method, isotope ratio uncertainties, trueness and repeatability were found to be <0.5%, <0.2% and <0.6%, respectively. The method performances meet the requirements for nuclear glasses studies and more generally for investigations of silicate dissolution rates based on isotope doping[59].
We believe that this method can be seen as a valid alternative for HR-ICP-MS and be easily transferred to other application fields like geosciences, i.e. for precise silicon content determination in natural samples by Isotope Dilution (ID).
439
References
1 2 3 4 5 6 7 8 9 10 11 12 13 14 440 441 442 443 444 445 446 447 448 15 449 16 450 17 18 19 20 451 452 453 21 454 455 456 457 458 459 460 461 462 463 22 23 24 25 26 27 28 29 30 31 32 33 464 34 465 35 466 36 37 38 39 467 468 469 40 470 41 471 42 43 44 45 46 472 473 474 475 47 476 48 49 50 51 52 477 478 479 480 53 481 54 482 55 56 57 58 483 484 485 59 486 60 61 62 63[1] C. Poinssot, S. Gin, Long-term Behavior Science: The cornerstone approach for reliably assessing the long-term performance of nuclear waste, Journal of Nuclear Materials, 420 (2012) 182-192.
[2] I.W. Donald, Waste Immobilization in Glass and Ceramic Based Hosts: Radioactive, Toxic and Hazardous Wastes, John Wiley & Sons Inc., 2010.
[3] M.I. Ojovan, W.E. Lee, New Developments in Glassy Nuclear Wasteforms, Nova Science Publishers Inc., New York2007.
[4] B. Grambow, Nuclear Waste Glasses - How Durable?, Elements, 2 (2006) 357-364.
[5] J.D. Vienna, J.V. Ryan, S. Gin, Y. Inagaki, Current Understanding and Remaining Challenges in Modeling Long-Term Degradation of Borosilicate Nuclear Waste Glasses, International Journal of Applied Glass Science, 4 (2013) 283-294.
[6] S. Gin, A. Abdelouas, L.J. Criscenti, W.L. Ebert, K. Ferrand, T. Geisler, M.T. Harrison, Y. Inagaki, S. Mitsui, K.T. Mueller, J.C. Marra, C.G. Pantano, E.M. Pierce, J.V. Ryan, J.M. Schofield, C.I. Steefel, J.D. Vienna, An international initiative on long-term behavior of high-level nuclear waste glass, Materials Today, 16 (2013) 243-248.
[7] S. Gin, P. Jollivet, M. Fournier, F. Angeli, P. Frugier, T. Charpentier, Origin and consequences of silicate glass passivation by surface layers, Nat Commun, 6 (2015).
[8] S. Gin, P. Frugier, P. Jollivet, F. Bruguier, E. Curti, New Insight into the Residual Rate of Borosilicate Glasses: Effect of S/V and Glass Composition, International Journal of Applied Glass Science, 4 (2013) 371-382.
[9] S. Gin, X. Beaudoux, F. Angéli, C. Jégou, N. Godon, Effect of composition on the short-term and long-term dissolution rates of ten borosilicate glasses of increasing complexity from 3 to 30 oxides, Journal of Non-Crystalline Solids, 358 (2012) 2559-2570.
[10] P. Frugier, S. Gin, Y. Minet, T. Chave, B. Bonin, N. Godon, J.E. Lartigue, P. Jollivet, A. Ayral, L. De Windt, G. Santarini, SON68 nuclear glass dissolution kinetics: Current state of knowledge and basis of the new GRAAL model, Journal of Nuclear Materials, 380 (2008) 8-21.
[11] D. Rebiscoul, A. Van der Lee, F. Rieutord, F. Né, O. Spalla, A. El-Mansouri, P. Frugier, A. Ayral, S. Gin, Morphological evolution of alteration layers formed during nuclear glass alteration: new evidence of a gel as a diffusive barrier, Journal of Nuclear Materials, 326 (2004) 9-18.
[12] K. Ferrand, A. Abdelouas, B. Grambow, Water diffusion in the simulated French nuclear waste glass SON 68 contacting silica rich solutions: Experimental and modeling, Journal of Nuclear Materials, 355 (2006) 54-67.
[13] P. Jollivet, F. Angeli, C. Cailleteau, F. Devreux, P. Frugier, S. Gin, Investigation of gel porosity clogging during glass leaching, Journal of Non-Crystalline Solids, 354 (2008) 4952-4958.
[14] B.P. McGrail, J.P. Icenhower, D.K. Shuh, P. Liu, J.G. Darab, D.R. Baer, S. Thevuthasen, V. Shutthanandan, M.H. Engelhard, C.H. Booth, P. Nachimuthu, The structure of Na2O-Al2O3-SiO2 glass: impact on sodium ion exchange in H2O and D2O, Journal of Non-Crystalline Solids, 296 (2001) 10-26.
[15] N. Valle, A. Verney-Carron, J. Sterpenich, G. Libourel, E. Deloule, P. Jollivet, Elemental and isotopic (29Si and 18O) tracing of glass alteration mechanisms, Geochimica et Cosmochimica Acta, 74 (2010) 3412-3431.
[16] S. Gin, P. Jollivet, M. Fournier, C. Berthon, Z. Wang, A. Mitroshkov, Z. Zhu, J.V. Ryan, The fate of silicon during glass corrosion under alkaline conditions: A mechanistic and kinetic study with the International Simple Glass, Geochimica et Cosmochimica Acta, 151 (2015) 68-85.
[17] M.A. Brzezinski, J.L. Jones, C.P. Beucher, M.S. Demarest, H.L. Berg, Automated Determination of Silicon Isotope Natural Abundance by the Acid Decomposition of Cesium Hexafluosilicate, Analytical Chemistry, 78 (2006) 6109-6114.
487 1 488 489 490 491 492 7 493 8 494 9 495 10 496 i1 497 13 498 14 499 500 15 16 17 18 19 501 502 503 2 0 504 21 505 22 23 24 25 506 507 508 26 509 27 28 29 30 31 32 510 511 512 513 514 33 515 34 35 36 37 38 516 517 518 519 39 520 40 41 42 43 44 521 522 523 524 45 525 46 526 47 48 49 50 51 52 527 528 529 530 531 53 532 54 55 56 57 58 533 534 535 536 59 537 60 61 62 63 64 538
[18] D. Cardinal, L.Y. Alleman, J. de Jong, K. Ziegler, L. Andre, Isotopic composition of Silicon measured by multicollector plasma source mass spectrometry in dry plasma mode, Journal of Analytical Atomic Spectrometry, 18 (2003) 213-218.
[19] C.L. De La Rocha, Measurement of silicon stable isotope natural abundances via multicollector inductively coupled plasma mass spectrometry (MC-ICP-MS), Geochemistry, Geophysics, Geosystems, 3 (2002) 1-8.
[20] E. Engstrom, I. Rodushkin, D.C. Baxter, B. Ohlander, Chromatographic Purification for the Determination of Dissolved Silicon Isotopic Compositions in Natural Waters by High-Resolution Multicollector Inductively Coupled Plasma Mass Spectrometry, Analytical Chemistry, 78 (2006) 250 257.
[21] T.W. May, R.H. Wiedmeyer, A Table of Polyatomic Interferences in ICP-MS, Atomic Spectroscopy, 19 (1998) 150-155.
[22] Y. Takaku, K. Masuda, T. Takahashi, T. Shimamura, Determination of trace silicon in ultra-high- purity water by inductively coupled plasma mass spectrometry, Journal of Analytical Atomic Spectrometry, 9 (1994) 1385-1387.
[23] R.B. Georg, B.C. Reynolds, M. Frank, A.N. Halliday, New sample preparation techniques for the determination of Si isotopic compositions using MC-ICPMS, Chemical Geology, 235 (2006) 95-104. [24] K. Abraham, S. Opfergelt, F. Fripiat, A.-J. Cavagna, J.T.M. De Jong, S.F. Foley, L. André, D. Cardinal, 530SÎ and 529SÎ Déterminations on USGS BHVO-1 and BHVO-2 Reference Materials with a New Configuration on a Nu Plasma Multi-Collector ICP-MS, Geostandards and Geoanalytical Research, 32 (2008) 193-202.
[25] P.S. Savage, F. Moynier, Silicon isotopic variation in enstatite meteorites: Clues to their origin and Earth-forming material, Earth and Planetary Science Letters, 361 (2013) 487-496.
[26] P. Klemens, K.G. Heumann, Development of an ICP-HRIDMS method for accurate determination of traces of silicon in biological and clinical samples, Fresenius' Journal of Analytical Chemistry, 371 (2001) 758-763.
[27] F. Fripiat, R. Corvaisier, J. Navez, M. Elskens, V. Schoemann, K. Leblanc, L. André, D. Cardinal, Measuring production—dissolution rates of marine biogenic silica by 30Si-isotope dilution using a high-resolution sector field inductively coupled plasma mass spectrometer, Limnology and Oceanography: Methods, 7 (2009) 470-478.
[28] X. Sun, P. Andersson, M. Land, C. Humborg, C.-M. Morth, Stable silicon isotope analysis on nanomole quantities using MC-ICP-MS with a hexapole gas-collision cell, Journal of Analytical Atomic Spectrometry, 25 (2010) 156-162.
[29] H.-t. Liu, S.-J. Jiang, Dynamic reaction cell inductively coupled plasma mass spectrometry for determination of silicon in steel, Spectrochimica Acta Part B: Atomic Spectroscopy, 58 (2003) 153 157.
[30] C.-H. Yang, S.-J. Jiang, Determination of B, Si, P and S in steels by inductively coupled plasma quadrupole mass spectrometry with dynamic reaction cell, Spectrochimica Acta Part B: Atomic Spectroscopy, 59 (2004) 1389-1394.
[31] F. Aureli, M. D'Amato, B. De Berardis, A. Raggi, A.C. Turco, F. Cubadda, Investigating agglomeration and dissolution of silica nanoparticles in aqueous suspensions by dynamic reaction cell inductively coupled plasma-mass spectrometry in time resolved mode, Journal of Analytical Atomic Spectrometry, 27 (2012) 1540-1548.
[32] D.R. Neves, R.S. Amais, J.A. Nobrega, J.A.G. Neto, Assessment of Polyatomic Interferences Elimination Using a Collision Reaction Interface (CRI) for Inorganic Analysis of Fuel Ethanol by ICP- QMS, Analytical Letters, 45 (2012) 1111-1121.
[33] G.L. Donati, R.S. Amais, J.A. Nobrega, Tungsten coil electrothermal matrix decomposition and sample vaporization to determine P and Si in biodiesel by inductively coupled plasma mass spectrometry, Journal of Analytical Atomic Spectrometry, 28 (2013) 280-287.
[34] J. Heroult, V. Nischwitz, D. Bartczak, H. Goenaga-Infante, The potential of asymmetric flow field- flow fractionation hyphenated to multiple detectors for the quantification and size estimation of silica nanoparticles in a food matrix, Analytical and Bioanalytical Chemistry, 406 (2014) 3919-3927.
539 540 541 542 543 544 545 546 547 548 549 550 551 552 553 554 555 556 557 558 559 560 561 562 563 564 565 566 567 568 569 570 571 572 573 574 575 576 577 578 579 580 581 582 583 584 585 586 587 588 589 590
[35] G.D. Woods, F.I. Fryer, Direct elemental analysis of biodiesel by inductively coupled plasma- mass spectrometry, Analytical and Bioanalytical Chemistry, 389 (2007) 753-761.
[36] S.D. Fernandez, N. Sugishama, J.R. Encinar, A. Sanz-Medel, Triple Quad ICPMS (ICPQQQ) as a New Tool for Absolute Quantitative Proteomics and Phosphoproteomics, Analytical Chemistry, 84 (2012) 5851-5857.
[37] L. Balcaen, G. Woods, M. Resano, F. Vanhaecke, Accurate determination of S in organic matrices using isotope dilution ICP-MS/MS, Journal of Analytical Atomic Spectrometry, 28 (2013) 33-39.
[38] L. Balcaen, E. Bolea-Fernandez, M. Resano, F. Vanhaecke, Inductively coupled plasma - Tandem mass spectrometry (ICP-MS/MS): A powerful and universal tool for the interference-free determination of (ultra)trace elements - A tutorial review, Analytica Chimica Acta, 894 (2015) 7-19. [39] Trace level analysis of sulfur, phosphorus, silicon and chlorine in NMP using the Agilent 8800 triple Quadrupole ICP-MS, Application note: 5991-2303EN, 2013.
[40] R.S. Amais, C.D.B. Amaral, L.L. Fialho, D. Schiavo, J.A. Nobrega, Determination of P, S and Si in biodiesel, diesel and lubricating oil using ICP-MS/MS, Analytical Methods, 6 (2014) 4516-4520.
[41] F. Aureli, M. D'Amato, A. Raggi, F. Cubadda, Quantitative characterization of silica nanoparticles by asymmetric flow field flow fractionation coupled with online multiangle light scattering and ICP- MS/MS detection, Journal of Analytical Atomic Spectrometry, 30 (2015) 1266-1273.
[42] A. Virgilio, R.S. Amais, D. Schiavo, J.A. Nobrega, Dilute-and-Shoot Procedure for Determination of As, Cr, P, Pb, Si, and V in Ethanol Fuel by Inductively Coupled Plasma Tandem Mass Spectrometry, Energy & Fuels, 29 (2015) 4339-4344.
[43] T. Ohno, Y. Muramatsu, Y. Shikamori, C. Toyama, N. Okabe, H. Matsuzaki, Determination of ultratrace 129I in soil samples by Triple Quadrupole ICP-MS and its application to Fukushima soil samples, Journal of Analytical Atomic Spectrometry, 28 (2013) 1283-1287.
[44] M. Tanimizu, N. Sugiyama, E. Ponzevera, G. Bayon, Determination of ultra-low 236U/238U isotope ratios by tandem quadrupole ICP-MS/MS, Journal of Analytical Atomic Spectrometry, 28 (2013) 1372-1376.
[45] T. Ohno, Y. Muramatsu, Determination of radioactive cesium isotope ratios by triple quadrupole ICP-MS and its application to rainwater following the Fukushima Daiichi Nuclear Power Plant accident, Journal of Analytical Atomic Spectrometry, 29 (2014) 347-351.
[46] J. Zheng, W. Bu, K. Tagami, Y. Shikamori, K. Nakano, S. Uchida, N. Ishii, Determination of 135Cs and 135Cs/137Cs Atomic Ratio in Environmental Samples by Combining Ammonium Molybdophosphate (AMP)-Selective Cs Adsorption and Ion-Exchange Chromatographic Separation to Triple-Quadrupole Inductively Coupled Plasma-Mass Spectrometry, Analytical Chemistry, 86 (2014) 7103-7110.
[47] E. Bolea-Fernandez, L. Balcaen, M. Resano, F. Vanhaecke, Tandem ICP-mass spectrometry for Sr isotopic analysis without prior Rb/Sr separation, Journal of Analytical Atomic Spectrometry, 31 (2016) 303-310.
[48] E. Bolea-Fernandez, S.J.M. Van Malderen, L. Balcaen, M. Resano, F. Vanhaecke, Laser ablation- tandem ICP-mass spectrometry (LA-ICP-MS/MS) for direct Sr isotopic analysis of solid samples with high Rb/Sr ratios, Journal of Analytical Atomic Spectrometry, 31 (2016) 464-472.
[49] L. Balcaen, E. Bolea-Fernandez, M. Resano, F. Vanhaecke, Accurate determination of ultra-trace levels of Ti in blood serum using ICP-MS/MS, Analytica Chimica Acta, 809 (2014) 1-8.
[50] S. Valkiers, T. Ding, M. Inkret, K. RuRe, P. Taylor, Silicon isotope amount ratios and molar masses for two silicon isotope reference materials: IRMM-018a and NBS28, International Journal of Mass Spectrometry, 242 (2005) 319-321.
[51] Agilent 8800 Triple Quadrupole ICP-MS, Understanding oxygen reaction mode in ICP-MS/MS, Application note: 5991-1708EN, 2012.
[52] E.D. Young, A. Galy, H. Nagahara, Kinetic and equilibrium mass-dependent isotope fractionation laws in nature and their geochemical and cosmochemical significance, Geochimica et Cosmochimica Acta, 66 (2002) 1095-1104.
[53] Agilent 8800 Triple Quadrupole ICP-MS, Hardware Maintenance Manual, Agilent Technologies pp. 134-135.
591 1 592 593 594 595 596 597 598 599 600 601 9 10 11 12 13 602 14 15 16 17 18 19 603 604 605 606 607 20 608 609 610 611 612 21 22 23 24 25 26 27 28 29 30 613 31 32 614 33 34 35 36 37 38 39 617 40 41 42 43 44 45 46 620 47 48 621 49 50 51 52 53 54 55 624 56 57 58 59 60 61 62 63 64 615 616 618 619 622 623 625 626
[54] K. Blaum, C. Geppert, P. Müller, W. Nortershauser, E.W. Otten, A. Schmitt, N. Trautmann, K. Wendt, B.A. Bushaw, Properties and performance of a quadrupole mass filter used for resonance ionization mass spectrometry, International Journal of Mass Spectrometry, 181 (1998) 67-87.
[55] C.-C. Shen, R. Lawrence Edwards, H. Cheng, J.A. Dorale, R.B. Thomas, S. Bradley Moran, S.E. Weinstein, H.N. Edmonds, Uranium and thorium isotopic and concentration measurements by magnetic sector inductively coupled plasma mass spectrometry, Chemical Geology, 185 (2002) 165 178.
[56] W.A. Russell, D.A. Papanastassiou, T.A. Tombrello, Ca isotope fractionation on the Earth and other solar system materials, Geochimica et Cosmochimica Acta, 42 (1978) 1075-1090.
[57] Statistical methods for use in proficiency testing by interlaboratory comparisons, ISO 13528, (2015).
[58] A. Gourgiotis, S. Berail, P. Louvat, H. Isnard, J. Moureau, A. Nonell, G. Manhes, J.-L. Birck, J. Gaillardet, C. Pecheyran, F. Chartier, O.F.X. Donard, Method for isotope ratio drift correction by internal amplifier signal synchronization in MC-ICPMS transient signals, Journal of Analytical Atomic Spectrometry, 29 (2014) 1607-1617.
[59] C. Zhu, Z. Liu, A. Schaefer, C. Wang, G. Zhang, C. Gruber, J. Ganor, R.B. Georg, Geochemistry of
the Earth's surface GES-10 Paris France, 18-23 August, 2014.Silicon Isotopes as a New
Method of Measuring Silicate Mineral Reaction Rates at Ambient Temperature, Procedia Earth and Planetary Science, 10 (2014) 189-193.
627
Tables
9 10 11 12 13 14 15 16 17 18 19 20 21 22 23 24 25 26 27 28 29 30 31 32 33 34 35 36 37 38 39 40 41 42 43 44 45 46 47 48 49 50 51 52 630 53 54 631 55 56 57 58 59 60 61 62 63 628 629 632 633 ICP-MS/MSSample Introduction System
Nebulizer PFA Micro-Concentric (ESI)
Spray chamber Scott (quartz)
Torch One-piece (quartz)
Sample gas (L min-1) 0.88
Ar makeup gas (L min-1) 0.36
Liquid uptake (pL min-1) ~150
ICP-MS/MS conditions
RF power (W) 1550
Plasma gas flow rate (L min-1) 15
Auxiliary flow rate (L min-1) 0.9
Extract 1 and 2 (V) -3, -195
Q1 and 2 Mass Gain 152, 126
Q1 and 2 Mass Offset 131, 128
O2 reaction gas flow rate (mL min-1) 0.24 Sensitivity on 28Si16O2+ (cps ppm-1) ~8x10⁵ Signal on 28Si16O2+ for HNO3 0.5M (cps) ~800
Acquisition parameters
Peak shape (points) 1
Integration time for 28, 29, 30Si16O2+ (s) 1, 6, 6
Number of sweeps per replicate 20
Number of replicates per sample 15
Table 1. ICP-MS/MS operating conditions
634 1 2 3 4 5 6 7 8 9 10 11 12 13 14 15 635 16 17 636 18 19 20 637 21 22 23 24 25 26 27 28 29 30 31 32 33 34 35 36 37 38 39 40 41 42 43 44 638 45 4 6 639 47 4 7 640 49 641 50 51 52 642 53 54 55 643 56 57 58 59 60 61 62 63 64 644 645
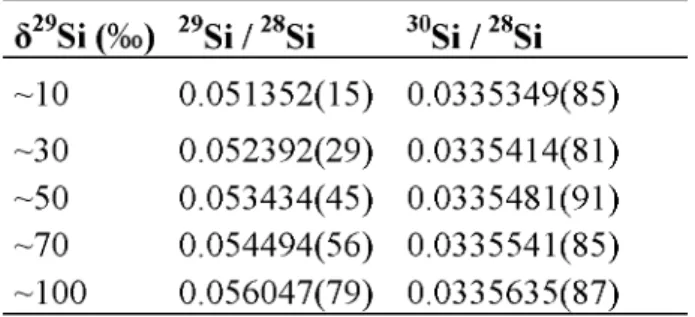
ô29Si (%) 29Si / 28Si 30Si / 28Si ~10 0.051352(15) 0.0335349(85) ~30 0.052392(29) 0.0335414(81) ~50 0.053434(45) 0.0335481(91) ~70 0.054494(56) 0.0335541(85) ~100 0.056047(79) 0.0335635(87)
Table 2. Isotope ratio values of the reference solutions used for the method validation. All uncertainties are expressed for a coverage factor k=2.
m/z Isotopes/molecules of interest Interferences Isobaric Polyatomic 28 28Si+ 14N2+, 12c16o+ 29 29Si+ 14N21H+ 30 30Si+ 14n16o+ 44 28Si16O+ 44Ca+ 14N216O+, 12C16O2+ 45 29Si16O+ 45Sc+ 14N216O1H+, 14n15n16o+ 46 30Si16O+ 46Ca+, 46Ti+ 14N16O2+, 46Ca16O+, 46Ti16O+ 60 28Si16O2+ 60Ni+ 44Ca16O+ 61 29Si16O2+ 61Ni+ 45Sc16O+ 62 30Si16O2+ 62Ni+ 46Ti16O+
Table 3. List of potential polyatomic and isobaric interferences for silicon isotopes and xSiOx+ ion species. Only major interferences for silicon isotopes are noted (after Engstrom
et
a/[20].). Potential polyatomic interferences for the xSiOx+ ion species were found in the paper of May T. W. and Wiedmeyer R. H.[21].646 647 648 649 650 651 652 653 654 655 656 657 658 659 660 661 S29Si (%o) 29Si / 28Si ~10 ~30 ~50 ~70 ~100 Ratio value 0.05145(20) 0.05241(22) 0.05339(17) 0.05450(19) 0.05598(20) % Uncertainty 0.38 0.42 0.32 0.35 0.36 % Repeatability (n=3) 0.013 0.087 0.30 0.17 0.016 % Trueness 0.19 0.03 -0.08 0.01 -0.12 Zeta-score 0.98 0.16 0.50 0.06 0.62 30Si / 28Si Ratio value 0.03354(13) 0.03357(15) 0.03352(13) 0.03359(13) 0.03361(14) % Uncertainty 0.38 0.44 0.39 0.39 0.41 % Repeatability (n=3) 0.40 0.54 0.11 0.23 0.26 % Trueness 0.015 0.09 -0.08 0.11 0.14 Zeta-score 0.08 0.38 0.43 0.55 0.66
Table 4. Average values of isotope ratios, uncertai nty, repeatability and truene ss for different Silicon reference materials. Zeta-score was expressed according to ISO 13528[57]. Isotope ratio uncertainties were calculated by taking into account uncertainties of the mass fractionation factors
(fi2m%, p3m8)
and the measured silicon ratios. Isotope ratio repeatability was calculated as the %RSD for three measurements of the same solution. Trueness is expressed as the difference between the average isotope ratio and the values of the reference solutions. Uncertainty and repeatability are expressed for a coverage factork
= 2.662 663 664 665 666 667 668 669 670 671 672 673 674 675 676 677 678 679 680 681 682 683 684 685 686 687 688 689 690
Figure captions
Figure 1. Three-isotope plot for xSi16O+ (open squares) and xSi16Ü2+ (open circles) ion species in Ultrapur HNO3 solutions with different concentrations. xSi16O+ ratios are shifted away from the Exponential Mass Fractionation Law (EMFL) due to important polyatomic interferences. The good agreement of the xSi16O2+ ratios with the EMFL points to the absence of polyatomic interferences. Uncertainties of the ratios were calculated following the next equation: 2xSD/Vn, were
SD
is the Standard Deviation andn
the number of replicates per measurement, in this casen
= 10.Figure 2. Simplified schematic representation of the operating principle of the tandem mass spectrometer for silicon isotope ratio measurements, showing the advantageous use of xSi16O2+ ions species compared to xSi16O+.
Figure 3. Evolution of the Relative Standard Deviation (%RSD) of 29Si16O2+ / 28Si16O2+ ratio measurements (red dots) for: (a) different integration times for 29Si16O2+ and 1 s for 28Si16O2+ and (b) different number of sweeps and fixed integration times (6 s for 29Si16O2+ and 1 s for 28Si16O2+). Solid and dashed lines represent the counting statistics law for different integration times for 28Si16O2+.
Figure 4. 29,30Si16O2+ / 28Si16O2+ ratios as a function of different Wait Time Offset. Uncertainties of the ratios were calculated following the next equation: 2*SD/Vn, were
SD
is the Standard Deviation andn
the number of replicates per measurement, in this casen
= 10.Figure 5. Three-isotope plot for 29,30Si16O2+ / 28Si16O2+ ratios before (blue dots) and after (red dots) abundance sensitivity optimization. For these measurements, a solution of 400 ng g-1 of the IRMM-018a was used. The solid line represents the Exponential Mass Fractionation Law (EMFL). Uncertainties of the ratios were calculated following the next equation: 2*SD/Vn, were
SD
is the Standard Deviation andn
the number of replicates per measurement, in this casen
= 15.691 692 693 694 695 698 9 696 10 11 697 12 13 14 15 16 17 18 19 20 21 22 23 24 25 26 27 28 29 30 31 32 33 34 35 36 37 38 39 40 41 42 43 44 45 46 47 48 49 50 51 52 53 54 55 56 57 58 59 60 61 62 63 29
Figure 6. Measurements of reference solutions with different Si enrichment (red dots). Each solution was measured three times. Solid lines represent values of the referent solutions and dashed lines their uncertainties. Isotope ratio uncertainties were calculated for each individual measurement by propagating uncertainties of the mass fractionation factors and of the measured silicon ratios. All uncertainties are expressed for a coverage factor